 Global X Research Team
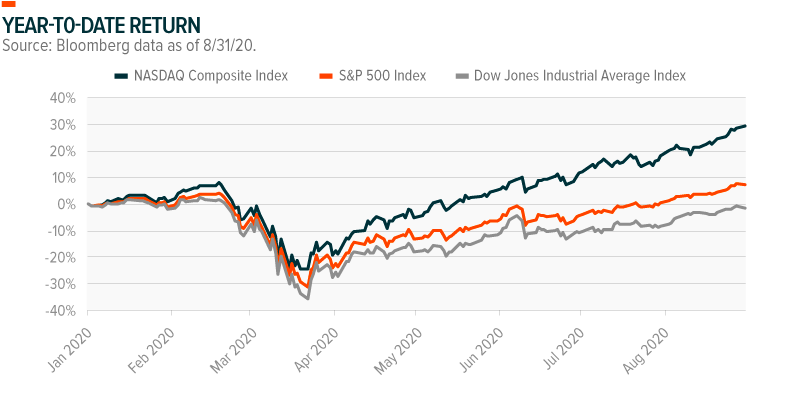
The decline was similar, but the recovery has been quite different. It is a challenge to think of a time when there has been such a large discrepancy between the price return on the NASDAQ Composite Index and that of the S&P 500 or Dow Jones Industrial Average Index. The NASDAQ Composite Index surpassed its February high back in June and has been sprinting ever since. This contrasts with the S&P 500 Index, which achieved this milestone in August and the Dow Jones Industrial Average Index which has only just recouped its losses.1
While generally trending in the same direction, the magnitude of the experience has been quite different. YTD there have been 19 trading days where the NASDAQ and S&P 500 Index moved in opposite directions – 14 of which the NASDAQ was going up while the S&P 500 was going down. This becomes even more pronounced when we look at the difference between the NASDAQ and the Dow Jones Industrial Average. YTD, there have been 36 days when the NASDAQ and Dow have moved in opposite directions – 26 of which favored the NASDAQ. Relative to the last decade, the number of days with differences in performance direction is on par with prior years. However, this was a record in terms these days tending to favor the NASDAQ.
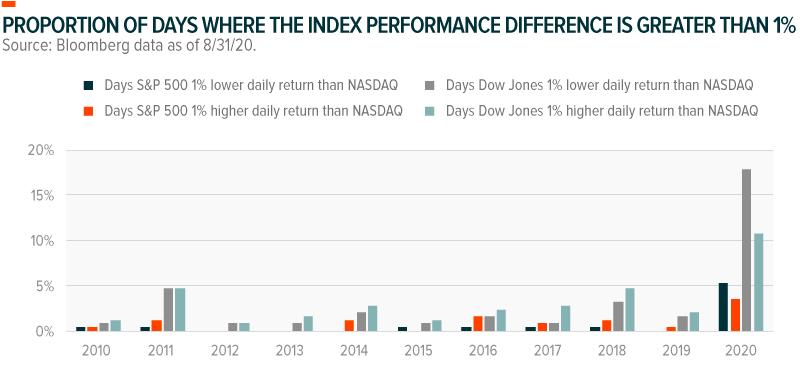
Digging deeper, there have been 15 trading days, or around 9% of year-to-date trading days where there has been more than a 1% performance difference between the NASDAQ and the S&P 500. This becomes much larger when focusing on the Dow Jones Industrial Average. 29% of trading days have seen more than a 1% difference in performance between the NASDAQ and the Dow. The chart below reflects that this level of performance difference is off the charts relative to the past decade.
A large amount of the performance difference can be attributed to the sector and industry composition of each index (S&P 500, NASDAQ, and DOW). Year-to-date, only three of the GICS sectors within the S&P 500 Index outperformed the broader S&P 500 Index: Information Technology, Consumer Discretionary and Communication Services. The NASDAQ has been the largest beneficiary as these sectors currently comprise more than 75% of the index. For the S&P 500 Index, this exposure drops to around 50% while for the Dow it is only 43%. All three indexes have benefited from their large-cap focus, but the growth/momentum tilt of the NASDAQ has certainly left the others in its dust this year.