Skip to Main Content
Subscribe to Newsletters
Global X Logo
Search
Content loaded

Explore

Our ETFs

Investment Insights

Product ResearchCharting DisruptionMidyear Outlook 2026

Investor Resources

EducationHow to InvestTax Resources

About Us

About Global XNewsroomCareersContact Us

Follow Us

socaial media icon for LinkedInLinkedInSocial media icon for X (twitter)XSocial media icon for FacebookFacebookSocial media icon for InstagramInstagramSocial media icon for Youtube

Copyright © 2026 Global X. All rights reserved.

Privacy PolicyAccessibility Statement
YouTube

Subscribe to our newsletter

Get the latest news and updates from our team.

Subscribe

SEI Investments Distribution Co. (1 Freedom Valley Drive, Oaks, PA, 19456) is the distributor for the Global X Funds.

Check the background of SIDCO and Global X's Registered Representatives on FINRA's BrokerCheck.

Content
Product ResearchPortfolio ConstructionCore

Chart: Which Risks Have Been Rewarded?

x
G
Global X ResearchGlobal X Research Team
Jun 22, 2017·3 min read
170622-Risks_Being_Rewarded-02

Related articles

1of2
Product ResearchREITEquity Income Strategies

Mortgage REITs, Explained

In this piece, we explain the Mortgage REIT business model, its performance drivers and the outlook for Mortgage REITs in the current environment.

R

Rohan Reddy

Oct 5, 20176 min read
Product ResearchPortfolio ConstructionInvestment Education

The Case for Risk Managed Income ETFs

Product ResearchREITEquity Income Strategies

Mortgage REITs, Explained

In this piece, we explain the Mortgage REIT business model, its performance drivers and the outlook for Mortgage REITs in the current environment.

Related funds
Income
DIVSuperDividend® U.S. ETF
Explore All ETFs
Footnotes

1. The risk free rate is the interest rate on a security with no credit or duration risk. We estimate the risk free rate as the yield on the 3 month T-bill.

Generally, investors can seek returns above the risk free rate1 from three broad sources of risk:

Duration - interest rate risk

Credit - potential default risk

Equity - Stock market risk

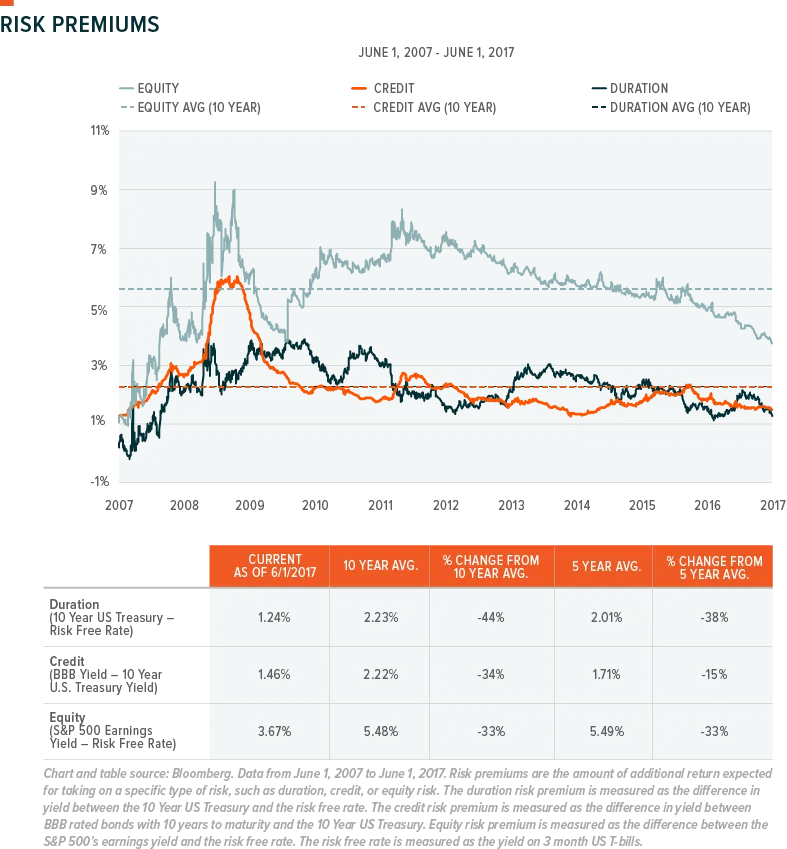
In the chart and table below, we seek to compare how these risks are being rewarded today versus their longer term averages.


Index data are for illustrative purposes only and do not represent actual fund performance. Index performance returns do not reflect any management fees, transaction costs or expenses. Indices are unmanaged and one cannot invest directly in an index. Past performance does not guarantee future results.

Duration: At the moment, the yield curve is remarkably flat as a result of the Fed raising rates four times since Q4 2015, and the 10 year treasury at virtually the same level since that date. As a result of this flat yield curve, taking on additional duration risk (as defined by the difference in yield between 10 year treasuries and 3 month T-bills) is providing a limited amount of additional yield of 1.24%. Our analysis indicates this is a 44% drop-off from the 10 year average yield pickup from taking on duration risk.

Credit: Over the last 10 years, credit risk (as measured by the difference between 10 year BBB bonds and 10 year treasuries) has provided virtually the same risk premium as duration. The story is largely the same today with BBB credit adding 1.46% in yield. While much of the financial media is discussing the flatness of the yield curve, the lack of yield pickup from credit is similarly significant. On a five year basis, however, which excludes the impact of the financial crisis, the drop-off in credit spreads is less significant, with the current yield pickup only 15% below 5 year averages.

Equity: Lower risk premiums are not just prevalent in fixed income, but are also apparent in the equity space. We estimated the equity risk premium as the earnings yield of the S&P 500 (the inverse of price-to-earnings), minus the risk free rate. These earnings can materialize as dividends and share buybacks, or retained for future investments. Since yield has been sparsely available in the fixed income space from credit and duration, investors have increasingly turned to stocks, pushing valuations to historically high levels. The earnings yield on the S&P amounted to 3.67% above the risk free rate –­ a figure 33% below long term averages.

Conclusion: 

It’s important to remember that the data from the last 10 years includes the experience of a financial crisis resulting in extraordinary central bank intervention to rescue the economy.  As a result, we have witnessed an extended period of extremely low interest rates and other accommodative policies from the Fed, which has skewed this data versus other time frames. These policies played an important part in shrinking the yields on each risk factor compared to their 10 year averages. Yet it is important to note in asset allocation decisions which sources of potential returns look more expensive than others. For example, while duration may be useful in defending assets in a downturn, it is currently one of the most expensive risks compared to its 10 year average. Credit is also currently yielding much less than long term averages. Income-seeking investors may want to consider alternative sources of yield such as high dividend paying equities or real assets, like MLPs and REITs.


On August 26th, 2021, we listed the Global X Nasdaq 100 Risk Managed Income ETF (QRMI) on the Nasdaq stock exchange and..

R

Rohan Reddy

Aug 26, 20217 min read
R

Rohan Reddy

Oct 5, 20176 min read
Product ResearchPortfolio ConstructionInvestment Education

The Case for Risk Managed Income ETFs

On August 26th, 2021, we listed the Global X Nasdaq 100 Risk Managed Income ETF (QRMI) on the Nasdaq stock exchange and..

R

Rohan Reddy

Aug 26, 20217 min read