



Product ResearchIncome StrategiesOptions
Introducing the Global X Income Edge℠ ETF Suite
R
Robert J. Scrudato
Feb 18, 20265 min read
Get the latest news and updates from our team.
Copyright © 2026 Global X. All rights reserved.
SEI Investments Distribution Co. (1 Freedom Valley Drive, Oaks, PA, 19456) is the distributor for the Global X Funds.
Check the background of SIDCO and Global X's Registered Representatives on FINRA's BrokerCheck.
Robert J. Scrudato
The derivative income ETF landscape continues to experience significant demand. In 2023, 5% of all net new assets into U.S.-listed ETFs was absorbed by an ETF with a Buywrite option overlay strategy.1 This trend has continued into early 2024.2
One iteration of the Buywrite is a covered call & growth strategy. This strategy seeks to achieve a dual objective of option premium acquisition paired with some upside potential on the long reference asset. Even as interest rates remain elevated, equity income is in demand. Investors may find an equity-based covered call & growth strategy as a palatable core complement or as a replacement to factor-based dividend strategies, which can skew a portfolio’s equity sector and style box exposures. In this piece, we’ll detail how Global X’s flagship covered call & growth ETFs, the Nasdaq 100 Covered Call & Growth ETF (QYLG) and the S&P 500 Covered Call & Growth ETF (XYLG), may serve as reasonable portfolio additions.
The strategies employed by QYLG and XYLG are structured to maintain long exposure to a well-known stock index, the Nasdaq 100 and S&P 500 respectively, while writing covered calls on half of the portfolio’s notional exposure. This type of strategy may simplify the allocating process and serve as a replacement to equity dividend strategies.
Equity dividend strategies come equipped with some potential drawbacks, including isolated exposure to specific market sectors. Implementation of an index-based call writing strategy might help alleviate this concern.
Although interest rates remain elevated, the call option premiums generated by Buywrite ETF strategies have helped promote high distribution potential, keeping them in demand. Conversely, dividend ETF flows have dwindled, in comparison.
The equity-based ETF landscape has evolved and systematic options selling strategies, like QYLG and XYLG, have grown to represent a core piece. Both ETFs implement a covered call & growth strategy by writing “at-the-money” (ATM), cash-settled, index call options monthly on 50% of their respective stock portfolios while leaving the remaining 50% of the portfolio uncovered. The expectation is that each ETF can achieve half of the upside potential of its respective underlying index while its systematic monthly options writing strategy can create a stream of distributions representing half its premiums received, up to 1% of net asset value.
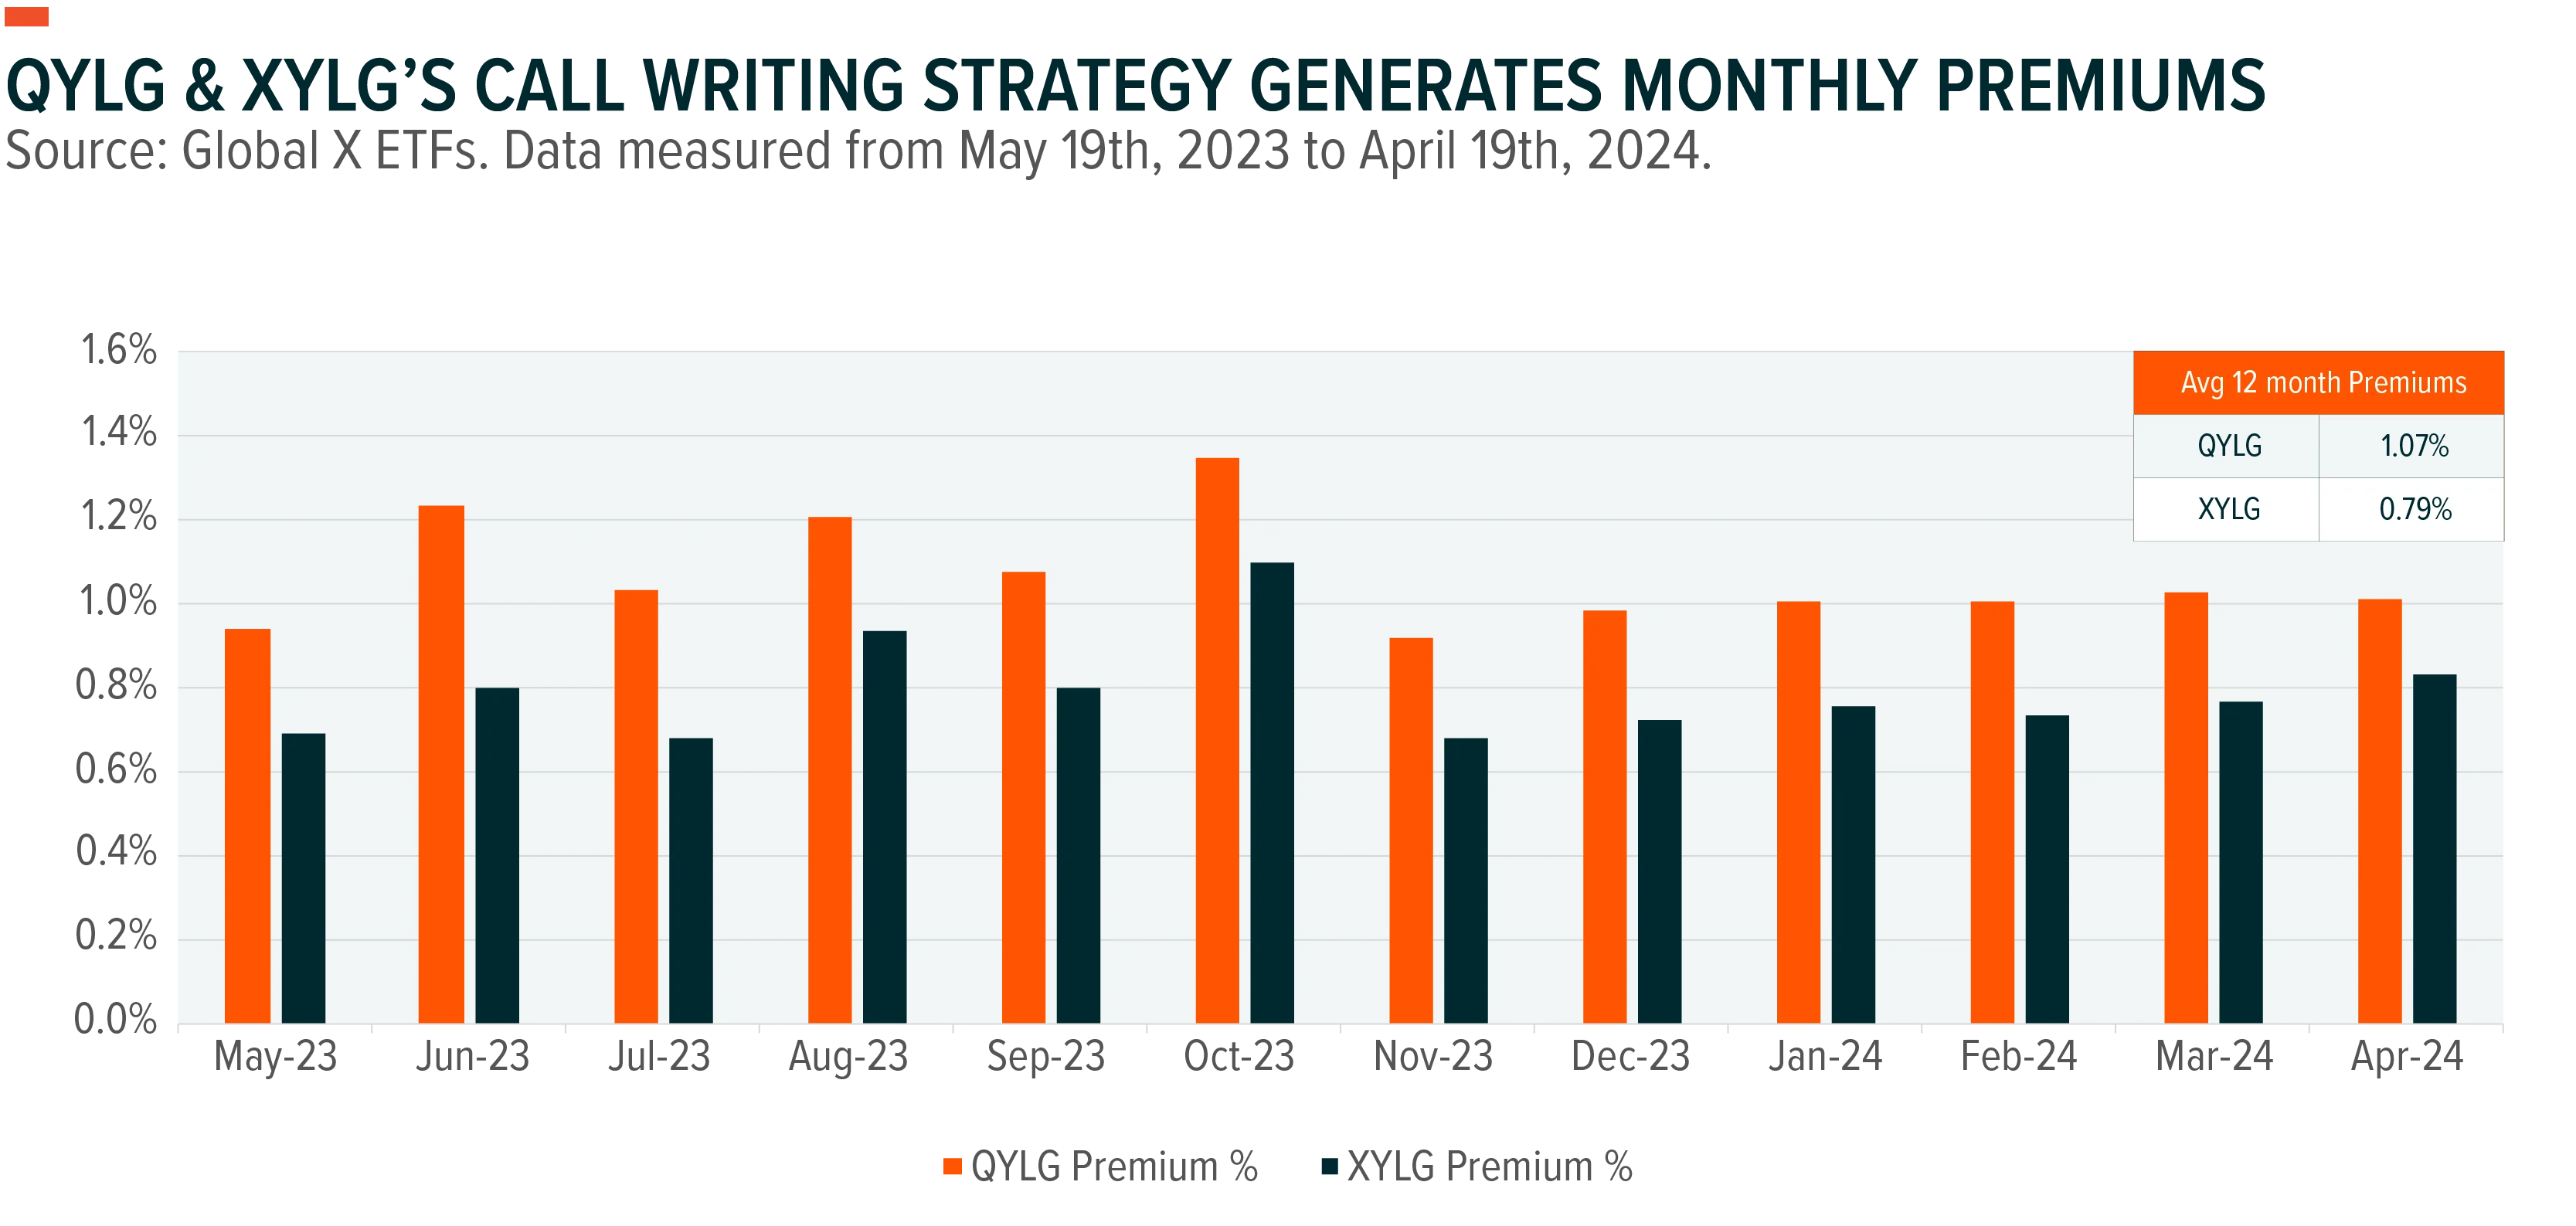
Implied volatility, which historically has a positive correlation with option prices, has trended to historically low levels, of late.3 However, by writing their call options “at-the-money”, option premium potential increases, since call options increase in value the closer the strike price of the contract is to the market price of the reference index at contract initiation. Recently, this component has enabled both ETFs to offer competitive 12-month trailing distributions relative to the yields on well-known U.S. dividend income indexes. In fact, year to date, as of 03/31/2024, both ETFs have outperformed the S&P 500 High Dividend and S&P 500 Dividend Aristocrats indexes. Over the last three years, XYLG has outperformed both indexes on a risk-adjusted basis when analyzing sortino ratios, a data point measuring returns for each unit of downside risk.
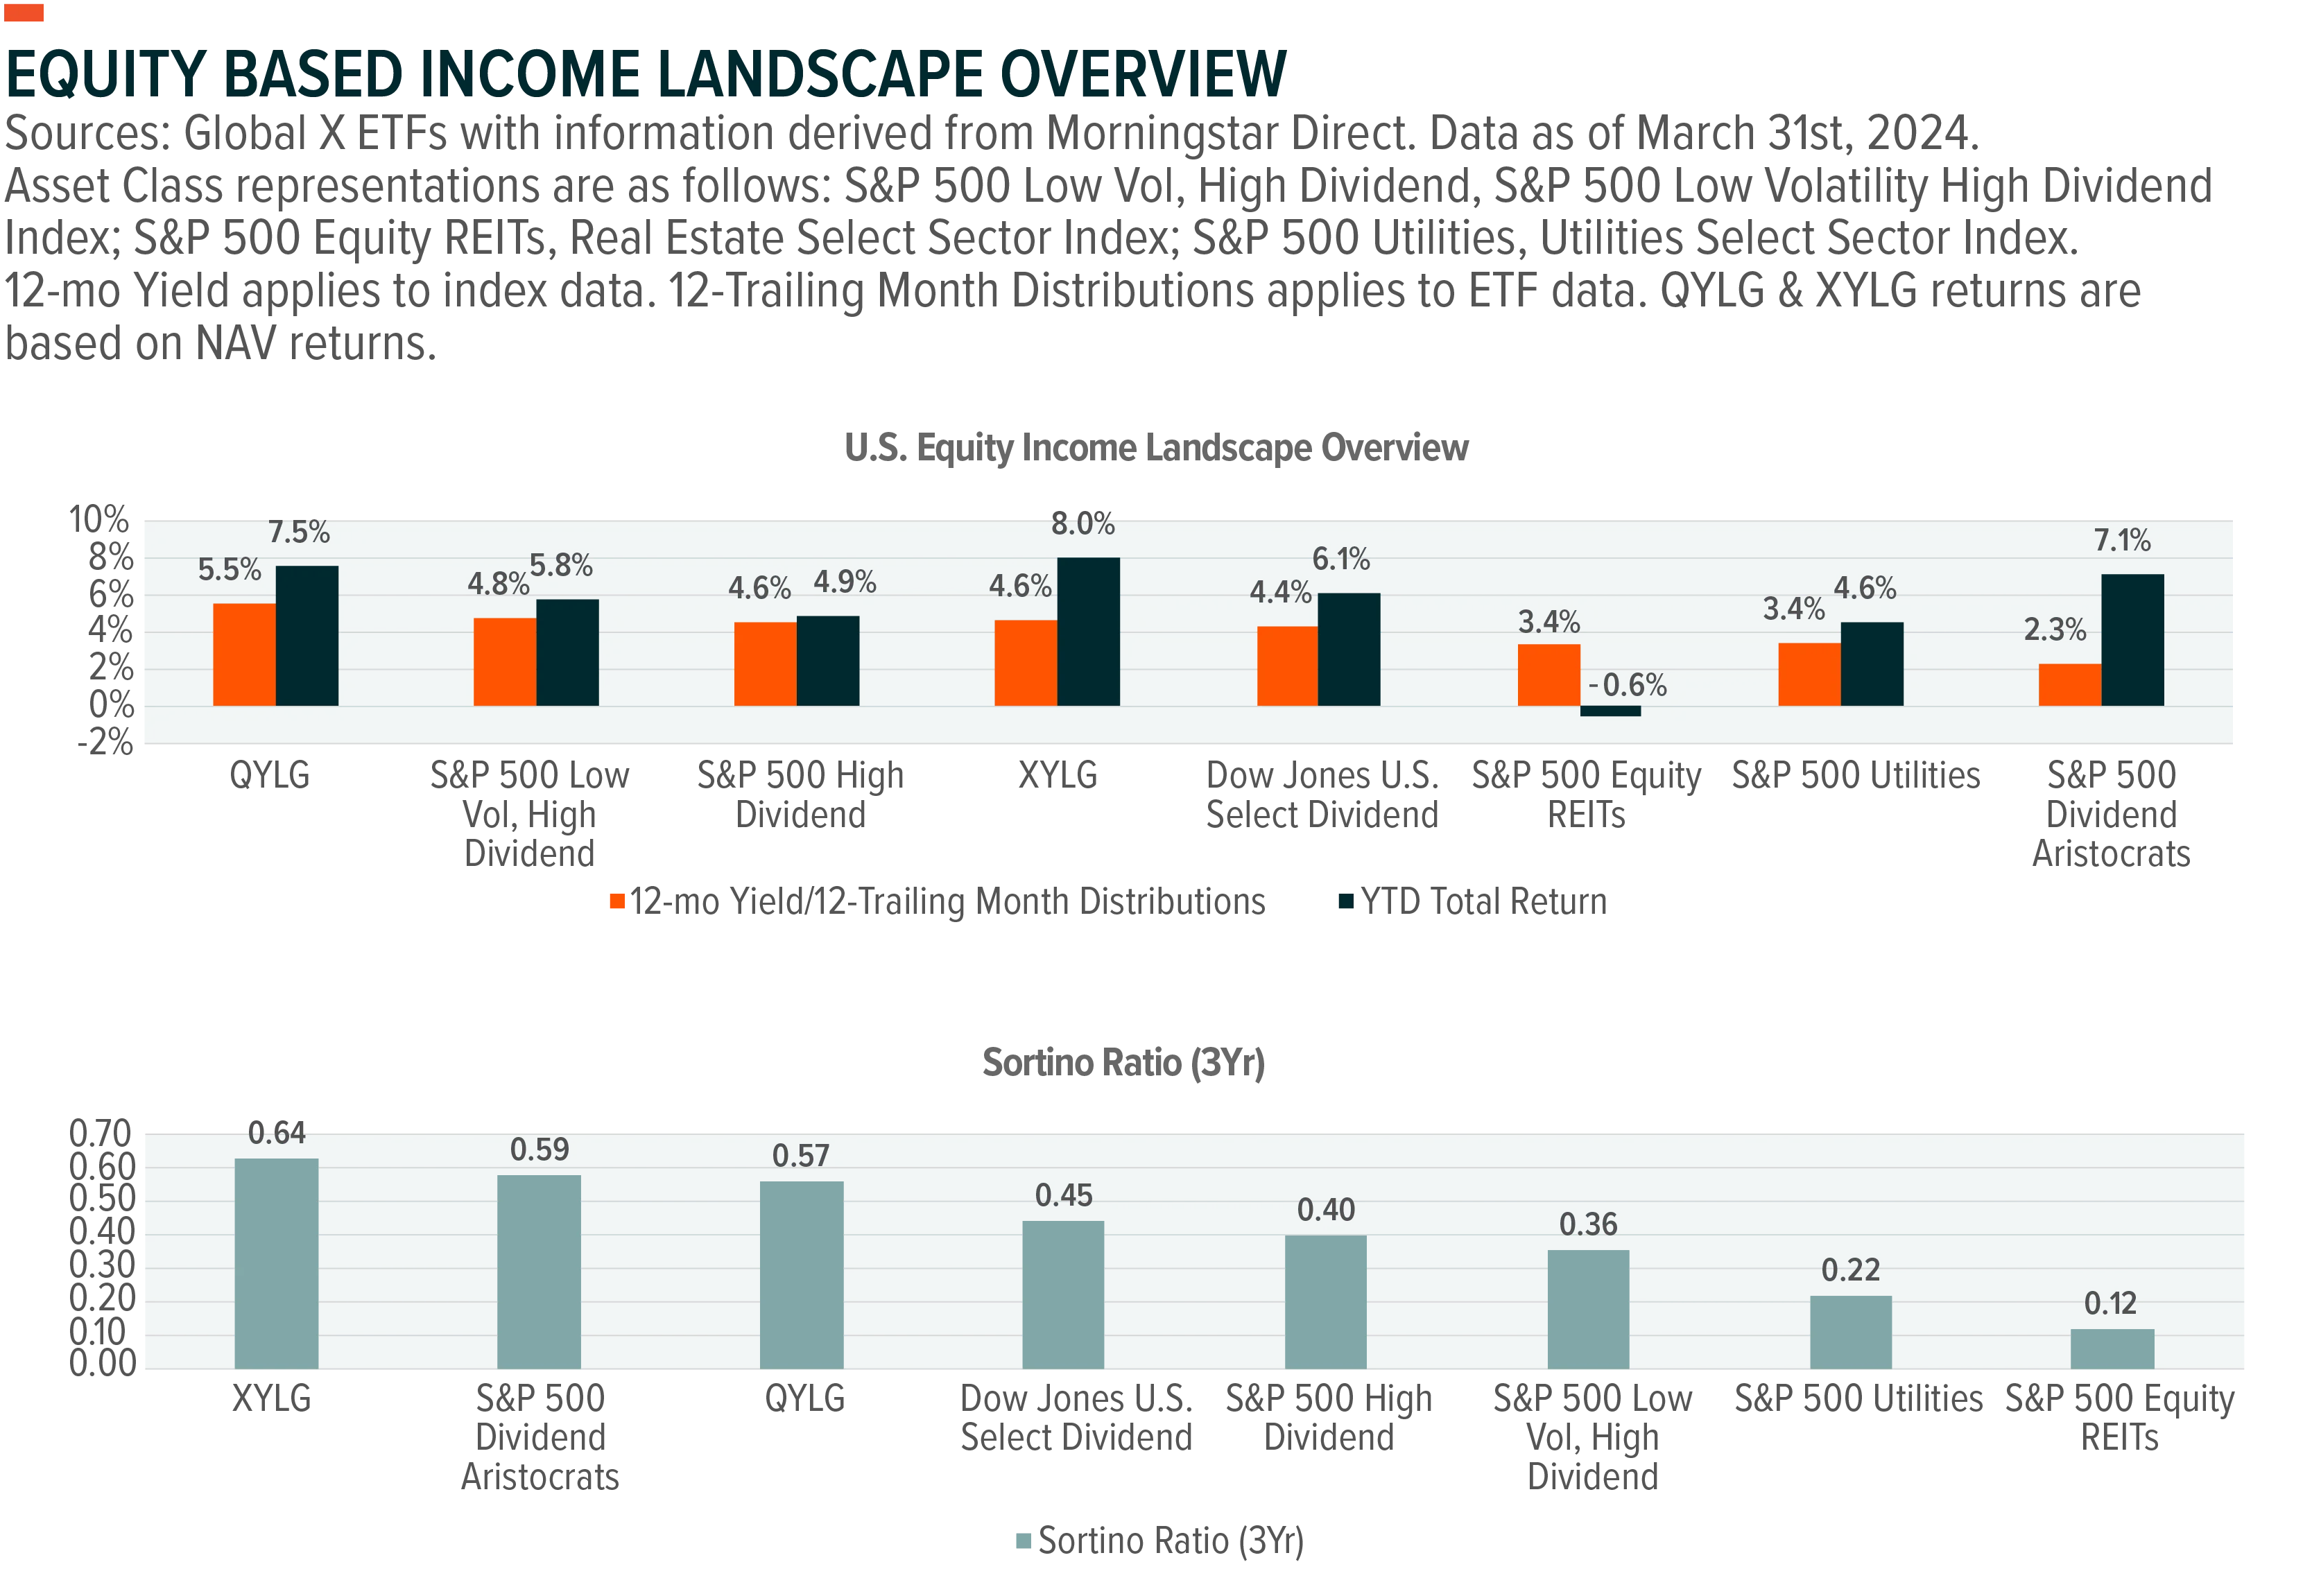
Past performance is not a guarantee of future results. Past performance does not guarantee future results. The investment return and principal value of an investment will fluctuate so that an investor’s shares, when sold or redeemed, may be worth more or less than their original cost and current performance may be lower or higher than the performance quoted. High short-term performance, when observed, is unusual and investors should not expect such performance to be repeated. For performance current to the most recent month- or quarter-end or a copy of the Fund prospectus, please visit QYLG and XYLG.
The 12-Trailing Month Distributions for the ETFs are estimated to include a return of capital. For a breakdown of the components of the most recent distribution, please see the 19a Notice for XYLG and QYLG.
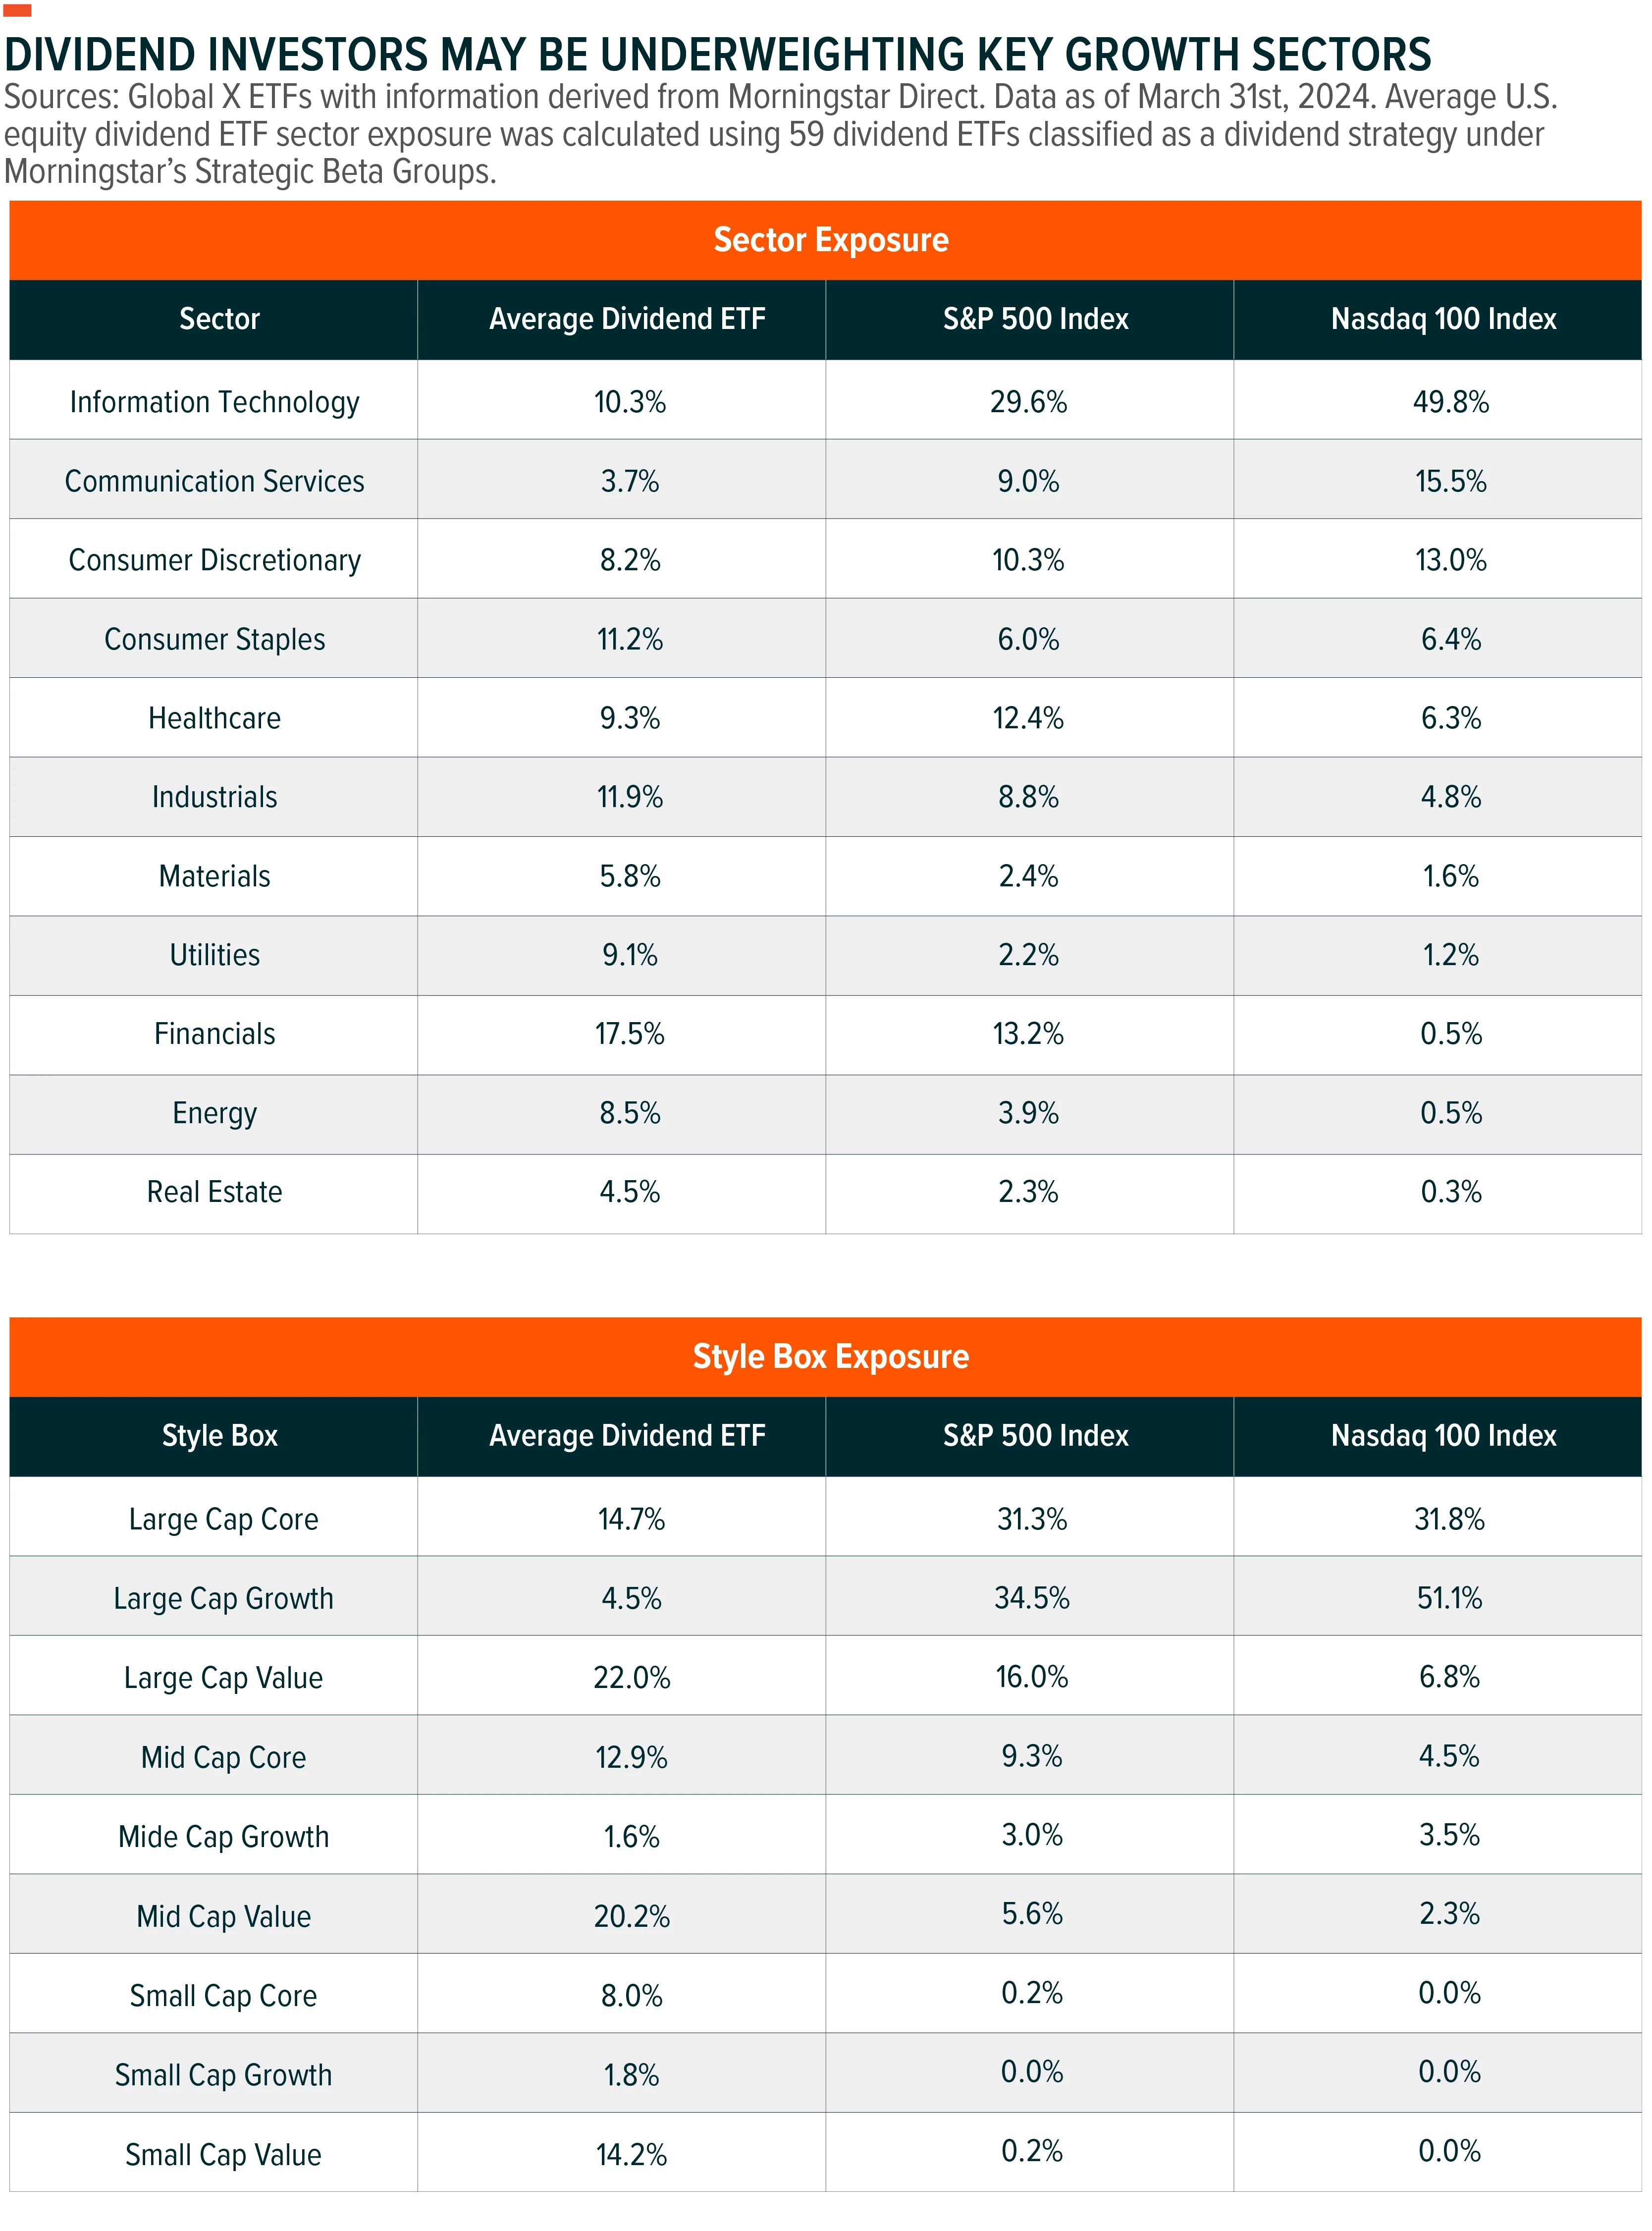
By maintaining underlying equity exposures that track the S&P 500 and Nasdaq 100, respectively, XYLG and QYLG grant investors the opportunity to diversify away from the value-oriented companies that are typically associated with dividend-targeted accounts. These include companies that exist in cyclical industries such as financials and materials, as well as defensive sectors like consumer staples and utilities. While equity dividend strategies may offer a defensive sector tilt, the reception of call premiums may play a defensive role for the Global X covered call & growth ETFs.
Presently, the average dividend ETF is underweight the information technology sector by a 19% margin relative to the S&P 500, and by a far wider gap versus the Nasdaq 100. As a consequence to this, these same strategies, on average, are underweight large cap equities, potentially increasing small and mid-cap size equity risks within an income allocation. By seeking to decrease portfolio volatility using premiums from an S&P 500 or Nasdaq 100 covered call strategy as opposed to dividend income, however, more of an interest in sectors characterized as growth might be attained.
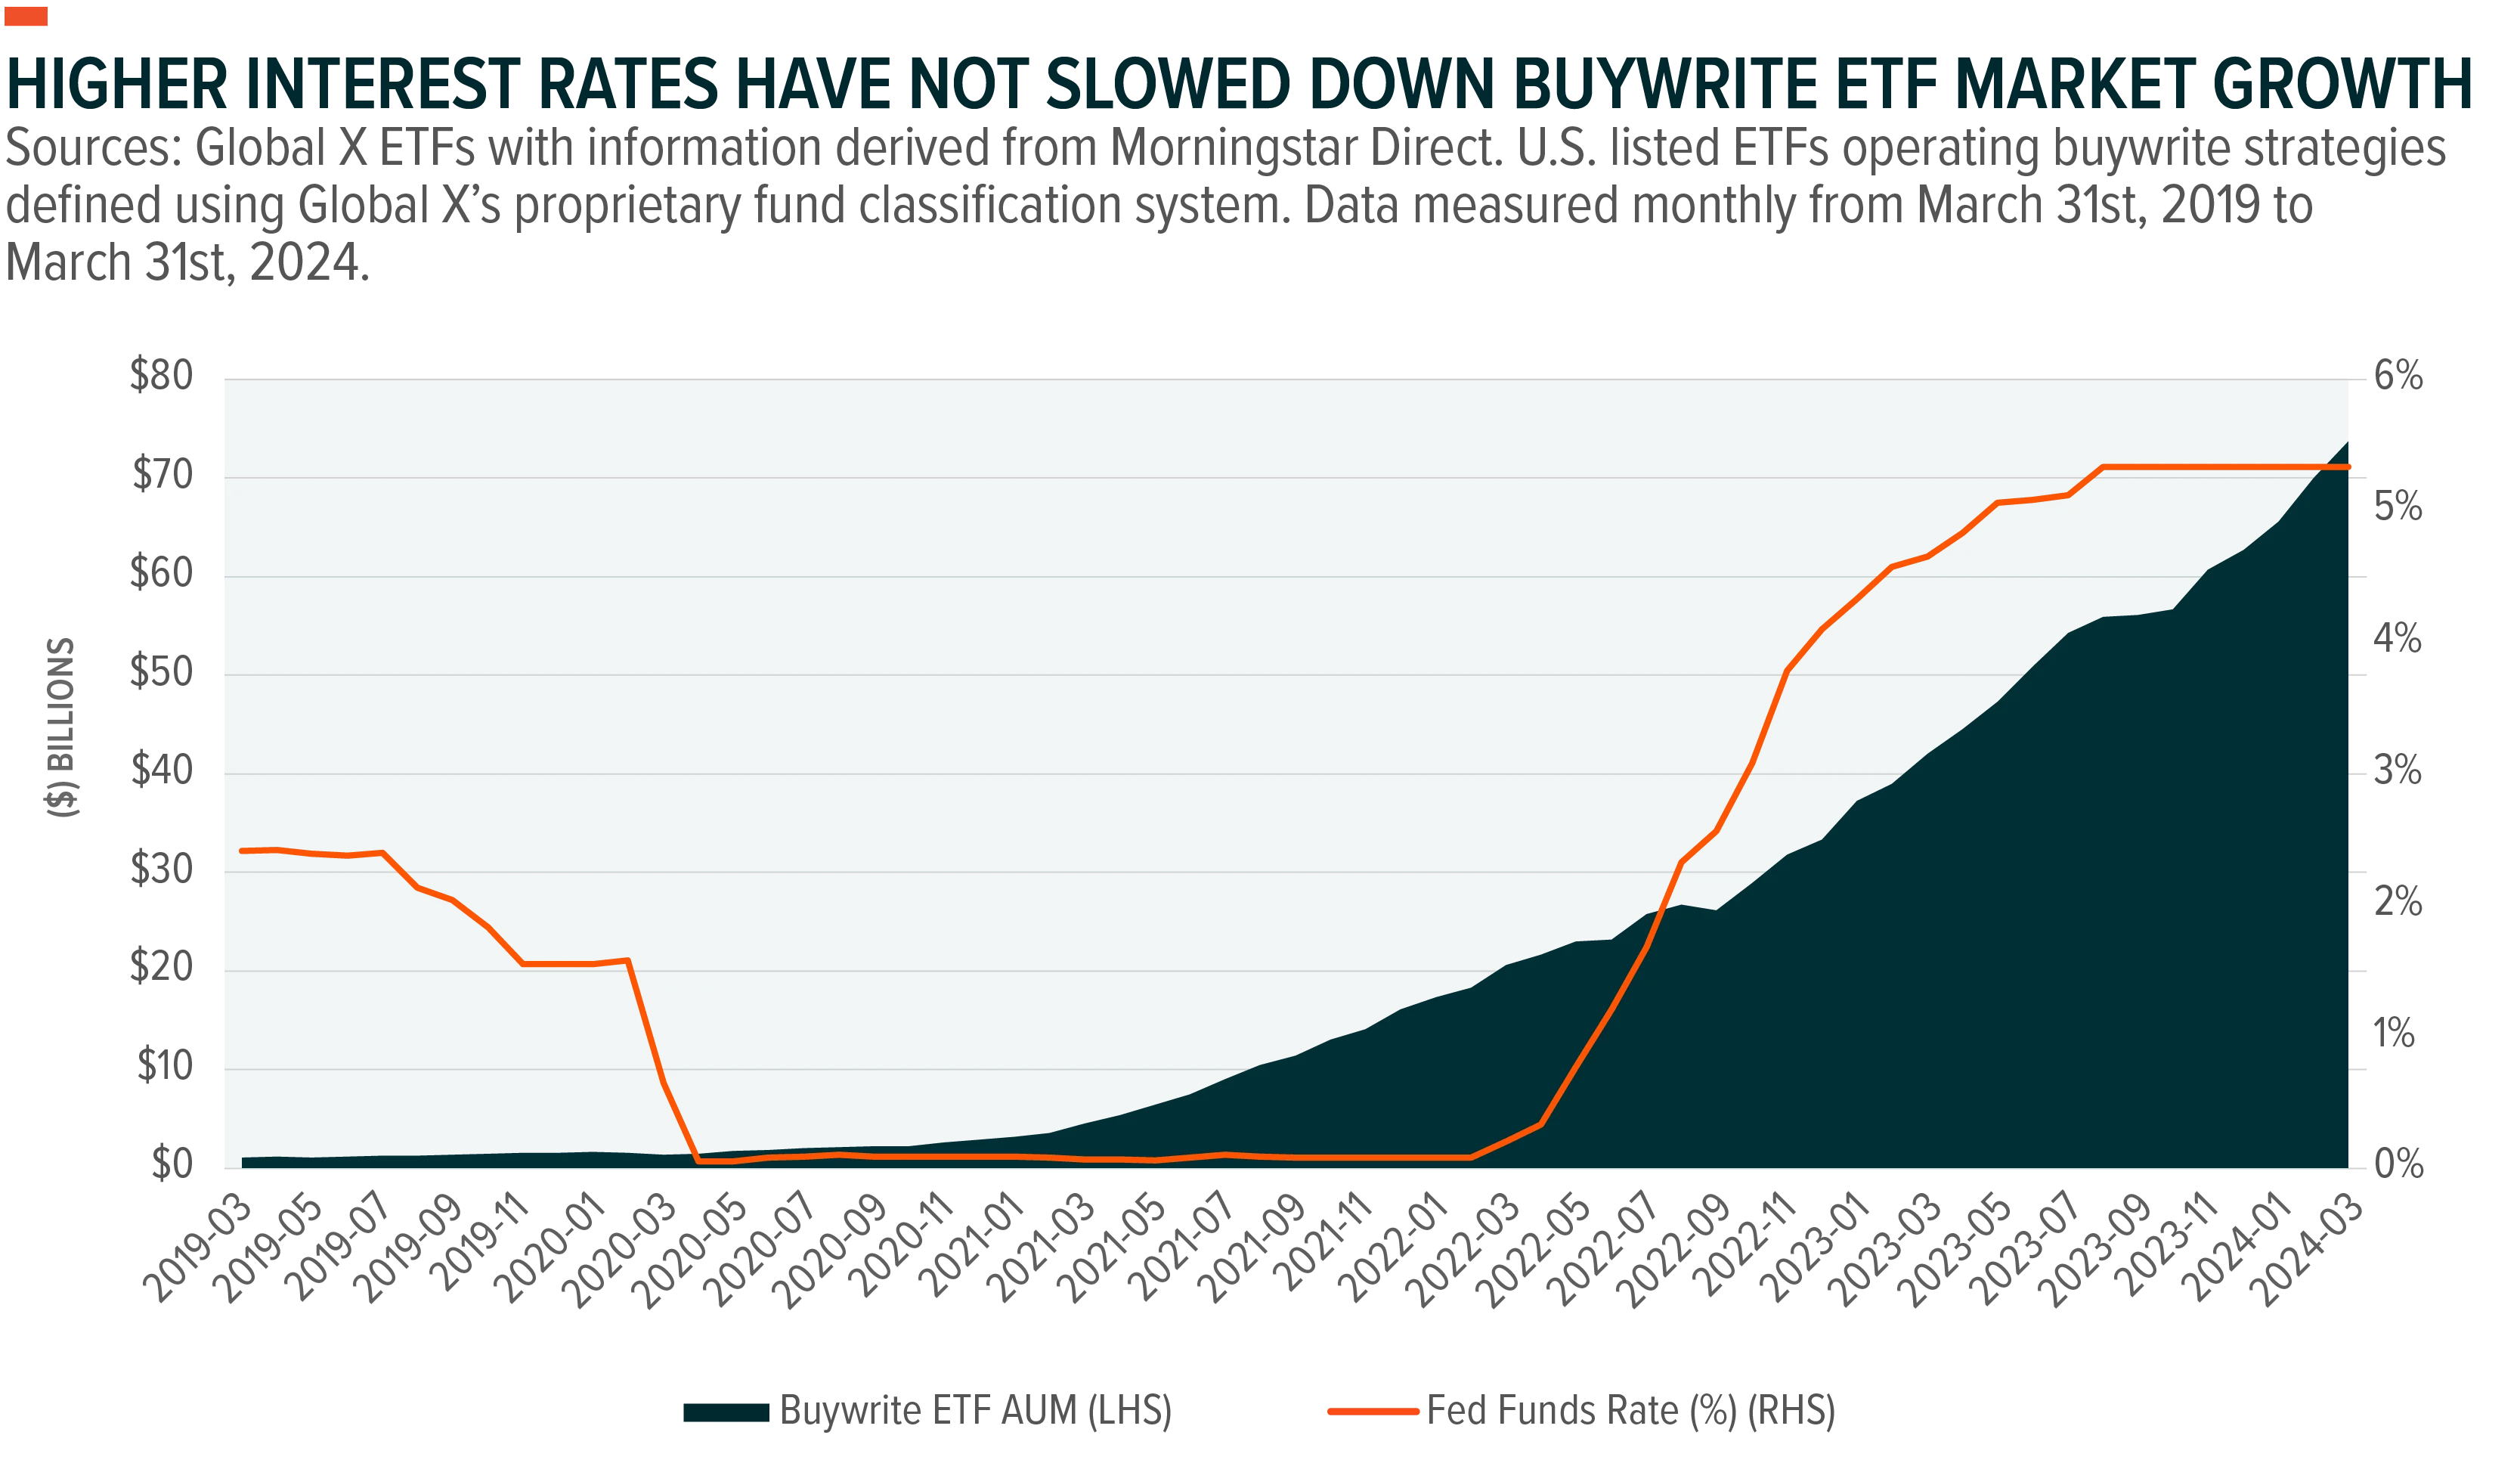
Buywrite ETFs have been made available to the public for more than a decade. However, the exponential growth story that they’ve developed of late was only recently catalyzed by the Federal Reserve’s zero-interest rate policies (“ZIRP”) of the COVID-19 era. In that environment, the yield-to-worst on U.S. high yield bonds fell to a 10-year low 3.75% by June of 2021.4 With credit failing to fully address the void, Buywrite strategies were able to pick up the slack and thrive. Dividend investing experienced similar demand, taking in more net new assets than any single-factor strategy over the last three years ($108B).5
This dynamic has changed, however, while investor demand for income has not. Over the last twelve months, Buywrite ETFs have experienced $26B in net flows versus a relatively meager $3B in net flows for dividend ETFs.6 Part of this is due to the elevated distribution potential that may be offered by such option strategies. Expansion also stems from the potential for investors to map core equity exposures more efficiently.
Dividend investing has historically represented a core component of income-oriented equity portfolios. However, with the introduction of covered call & growth funds investors now have the opportunity to retain the upside price appreciation potential associated with their broad equity index positions while instead pursuing call option premiums The S&P 500 and Nasdaq 100 indices have increasingly become a bedrock to core equity index investing over the last few years, and combined there are roughly $3.2T in assets under management tied to long-only ETFs and mutual funds that track these indices, representing 24% of all U.S. equity ETF and MF assets under management.7 By allocating to these same baskets of stocks through QYLG and XYLG, the portfolio allocation process for income investors who already invest in another investment fund that offers similar exposure may become easier and reduce exposure disruptions.
Related ETFs
QYLG – Global X Nasdaq 100 Covered Call & Growth ETF
XYLG – Global X S&P 500 Covered Call & Growth ETF
Click the fund name above to view current performance and holdings. Holdings are subject to change. Current and future holdings are subject to risk.
Global X and Morningstar Direct. Funds operating buywrite strategies defined using Global X’s proprietary fund classification system. Information measured from January 1, 2023 to December 31, 2023. Retrieved April 17, 2024.
Global X and Morningstar Direct. Funds operating buywrite strategies defined using Global X’s proprietary fund classification system. Information measured from January 1, 2024 to March 31, 2024. Buywrite ETFs have grown at an 11.88% organic growth rate year-to-date. Retrieved April 17, 2024.
Global X with information derived from Morningstar Direct. Measured from April 1, 2014 to March 31, 2024, the median Cboe Volatility Index (VIX) level was 16.06. As of March 31st, 2024, the level of the VIX was 13.01. Over the same timeframes, the median Cboe Nasdaq 100 Volatility Index (VXN) level was 19.55 and 16.66. Retrieved April 17, 2024.
Global X with information derived from Morningstar Direct. Measured monthly from March 2014 to March 2024 using yield-to-worst measurements of the Bloomberg US Corporate High Yield Bond Index. Retrieved April 17, 2024.
Global X with information derived from Morningstar Direct. Measured monthly from March 2021 to March 2024 using ETFs classified as a Dividend strategy under Morningstar’s Strategic Beta Groups. Retrieved April 17, 2024.
Global X with information derived from Morningstar Direct. Measured monthly from March 2023 to March 2024 using ETFs classified as a Buywrite strategy under Global X’s proprietary fund classification system and ETFs classified as a Dividend strategy under Morningstar’s Strategic Beta Groups. Retrieved April 17, 2024.
Global X and Morningstar Direct. Measured as of March 31st, 2024. Retrieved April 17, 2024.
The Income Edge℠ ETFs use weekly call options and dynamic coverage to target defined annualized distribution rates while maintaining equity exposure.
The Income Edge℠ ETFs use weekly call options and dynamic coverage to target defined annualized distribution rates while maintaining equity exposure.