Although the outbreak of a third Gulf war remains a developing story with no clear resolution, the implications for energy markets are already becoming evident: a severe disruption to global energy supply and a substantial rerouting of global trade flows. The closure of the Strait of Hormuz represents the largest disruption of the global oil & gas trade in modern history.1 When the dust settles, we believe interruptions to both crude oil shipments and liquefied natural gas (LNG) exports from one of the world’s most critical energy corridors could accelerate structural shifts in global markets.
Outside of OPEC+, the U.S. has grown to represent the largest producer of crude oil and natural gas in the world, and it is being increasingly relied upon to supply energy exports during major supply disruptions.2,3 With that in mind, two segments of the North American energy complex that may play an increasingly important role in the effort to stabilize global supply chains in this environment are midstream infrastructure operators and LNG suppliers, who may replace a portion of disrupted global production. Should geopolitical risk premiums remain embedded in Middle Eastern cargos, global buyers may increasingly turn to North America.
Exposure to these segments may be obtained through positions in the Global X MLP & Energy Infrastructure ETF (MLPX), the Global X MLP ETF (MLPA), and the Global X U.S. Natural Gas ETF (LNGX).
Key Takeaways
Damage to energy infrastructure could have lasting impacts. The closure of the Strait of Hormuz is materially impairing both production and transport, removing global oil and LNG supply from the market, and potentially making non-affected energy infrastructure more valuable.
Global energy markets are repricing around security of supply. As mitigation options fall short, importers may well prioritize reliability over cost and may accelerate a shift away from geopolitically exposed regions.
North American energy infrastructure and LNG exporters could benefit. Representing one of the world’s few major suppliers that is largely insulated from the disruption, the U.S. is positioned to capture market share, with midstream networks and LNG capacity at the center of this shift.
How This Conflict Differs from the Past
Historically, geopolitical tensions in energy-producing regions have typically resulted in temporary price spikes without meaningful disruptions to the underlying flow of energy. Even major conflicts in the region – including the Gulf War – left key trade routes and export infrastructure largely intact. The war with Iran appears different, however, in that it targets the heart of the global energy trade, directly disrupting both energy production across the Gulf and the transport of oil and natural gas via key trade routes in the Middle East. Attacks on shipping, production cuts from major energy producers, and halted exports across the Gulf have all resulted in disruption of roughly 20% of the world’s oil and gas flows.4
Key Developments
Production Disruptions across Major Oil Exporters: To date, Saudi Arabia, the United Arab Emirates (UAE), Kuwait, Iraq, Bahrain, and Oman have all cut output or suspended port operations, leading supply chains to grind to a halt and storage capacity to fill. Including Iran, these countries represent OPEC’s largest producers, resulting in millions of barrels per day (bpd) of lost supply.5,6
Major LNG Supply Offline: Qatar, the world’s 2nd largest producer of LNG, declared force majeure and halted production at the world’s largest LNG export facility, taking roughly 20% of global production offline.7 Damage to the facility impacts 17% of its export capacity and is estimated to take 3-5 years to repair.8
Strait of Hormuz All But Closed: Multiple civilian vessels, including tankers, container ships, and other bulk carriers have been attacked, as Iran continues to disrupt shipping in the Strait of Hormuz and across the Gulf Coast.9 Elevated insurance rates and the persistent threat of attack has left over a hundred ships moored on both sides of the Strait as of March 2nd.10
Energy Infrastructure under Attack: Multiple attacks on energy infrastructure across the region have been recorded, including storage facilities, refineries, and export terminals.11,12,13 Damage to this infrastructure could create lasting supply impacts, even if shipping routes normalize.
Lost Supply Recalibrates the Fundamentals for Global Energy Markets
Prior to the outbreak of the war, global oil and gas markets were expected to remain comfortably supplied in 2026.14,15 The International Energy Agency had projected nearly 3.7 million bpd of excess crude oil supply. However, those projections were effectively rendered obsolete on the first day of the conflict, when the closure of the Strait of Hormuz disrupted roughly 15 million bpd of crude exports and 4.5 million bpd of refined fuel exports.16
The longer that the Strait of Hormuz remains closed, the more meaningfully we expect the disruption to ripple through regional production. Storage capacity across several Gulf producers has rapidly filled, forcing Saudi Arabia, the UAE, Kuwait, Iraq, and Oman to curtail production amidst limited export routes.17 At the same time, attacks on shipping and regional energy infrastructure have taken additional capacity offline.18 In effect, the market is rapidly shifting from a projected surplus towards a potential deficit.
On March 11, Group of Seven (G-7) nations attempted to cushion this impact by reaching a unanimous decision to coordinate the release of 400 million barrels from global strategic petroleum reserves (SPR) – the largest coordinated release on record.19
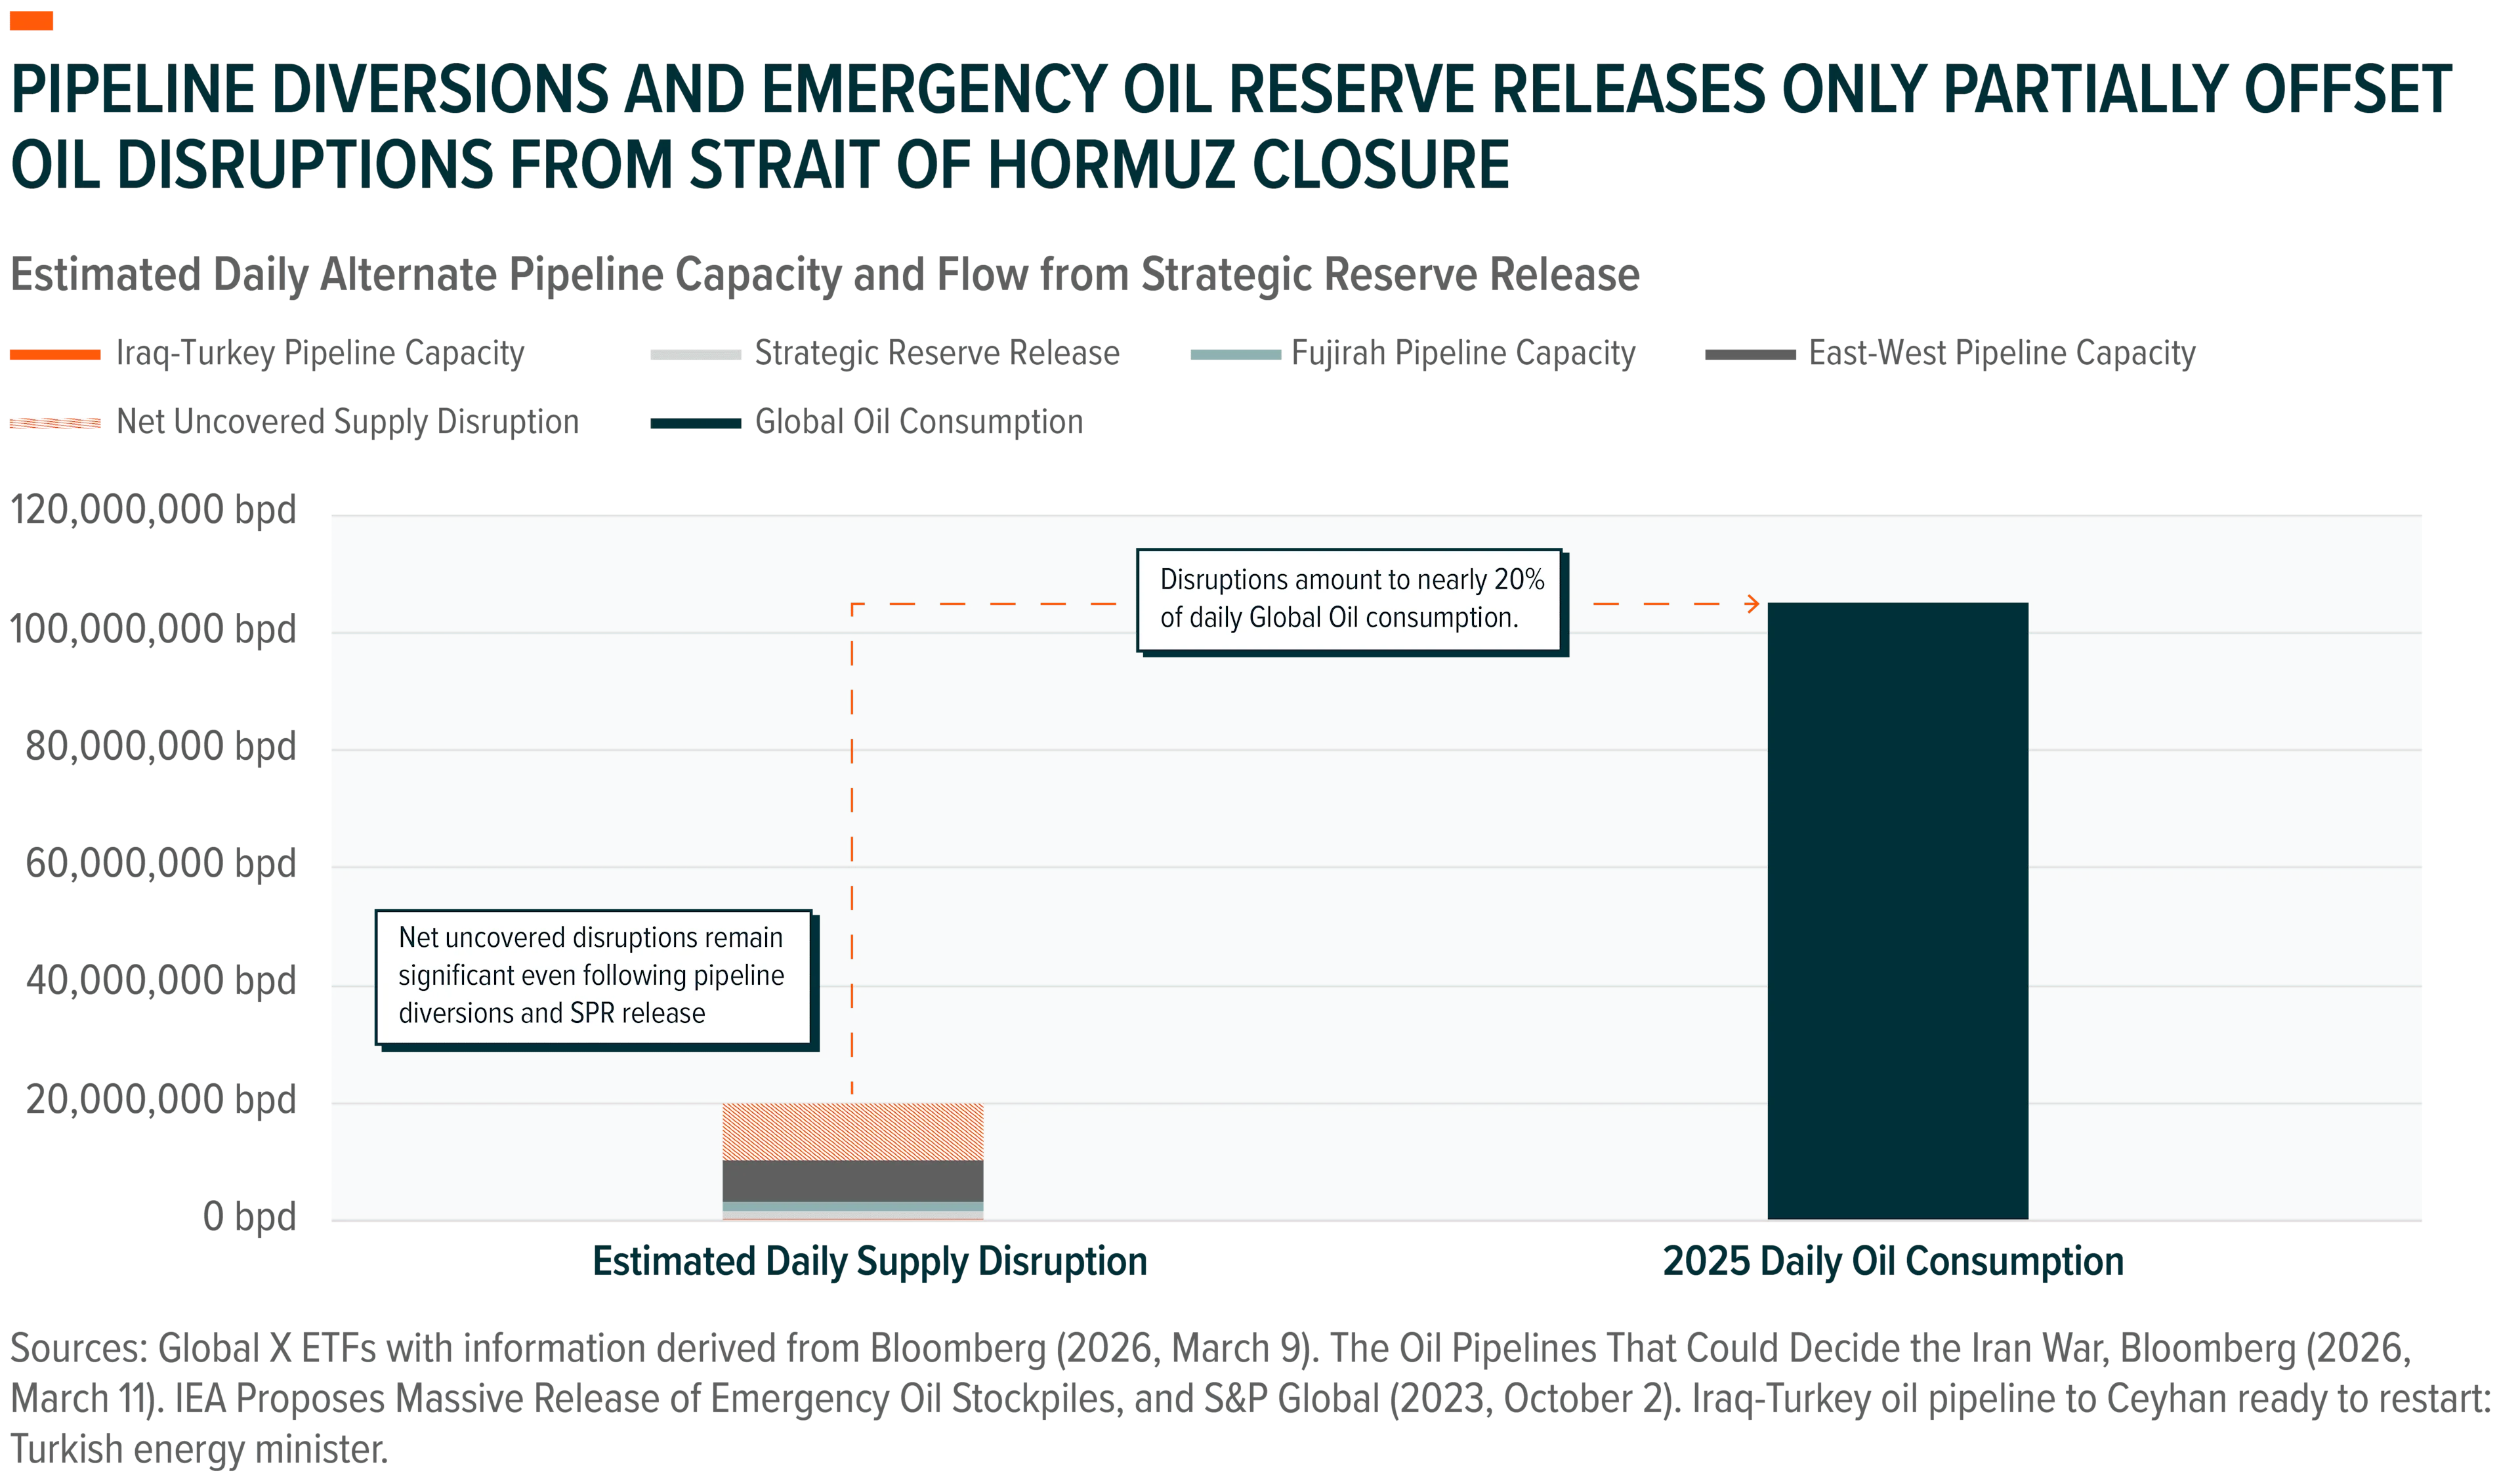
Despite its scale, the release will occur gradually, with operational constraints limiting flows to roughly 1.2 million bpd.20 As such, we view such actions as a temporary shock absorber to help stabilize global energy markets rather than a durable fix for global trade disruptions. We believe a sustainable solution mandates a lasting normalization of trade via the Strait of Hormuz.
Even under optimistic assumptions, relief options fall far short of replacing disrupted supply. OPEC members have limited ability to reroute exports away from the Strait of Hormuz, through which about 20 million bpd of global oil, condensate, and fuels typically flows.21 Saudi Arabia’s East-West pipeline, the UAE’s Fujirah pipeline, and the Iran-Turkey pipeline can collectively transfer around 8.5 million bpd of alternative capacity and, when including the 1.2 million bpd expected from SPR releases, may offset the disruption to the tune of about 10.2 million bpd, temporarily.22
LNG: Supply Disruptions Tighten Global Gas Markets
Relative to oil markets, the disruption to global LNG may prove even more acute. Unlike oil, which can often be rerouted through alternative shipping channels or supplemented by strategic reserves, LNG supply chains are far less flexible. LNG supply depends on specialized liquefaction facilities, dedicated tankers, and import terminals, leaving little room to quickly replace lost exports when disruptions occur. Storage capacity for LNG is also limited, meaning supply and demand must remain closely balanced. As a result, disruptions to major exporters can quickly tighten global markets and trigger sharp price movements.
The closure of the Strait of Hormuz has forced Qatar – the world’s second largest LNG producer – to halt production at its Ras Laffan export terminal, effectively removing 20% of global LNG supply from the market.23 With limited storage capacity and few alternative export routes available, much of this supply has been left stranded. QatarEnergy and Shell have already declared force majeure on LNG cargo originating from the region, forcing buyers to scramble for replacement shipments.
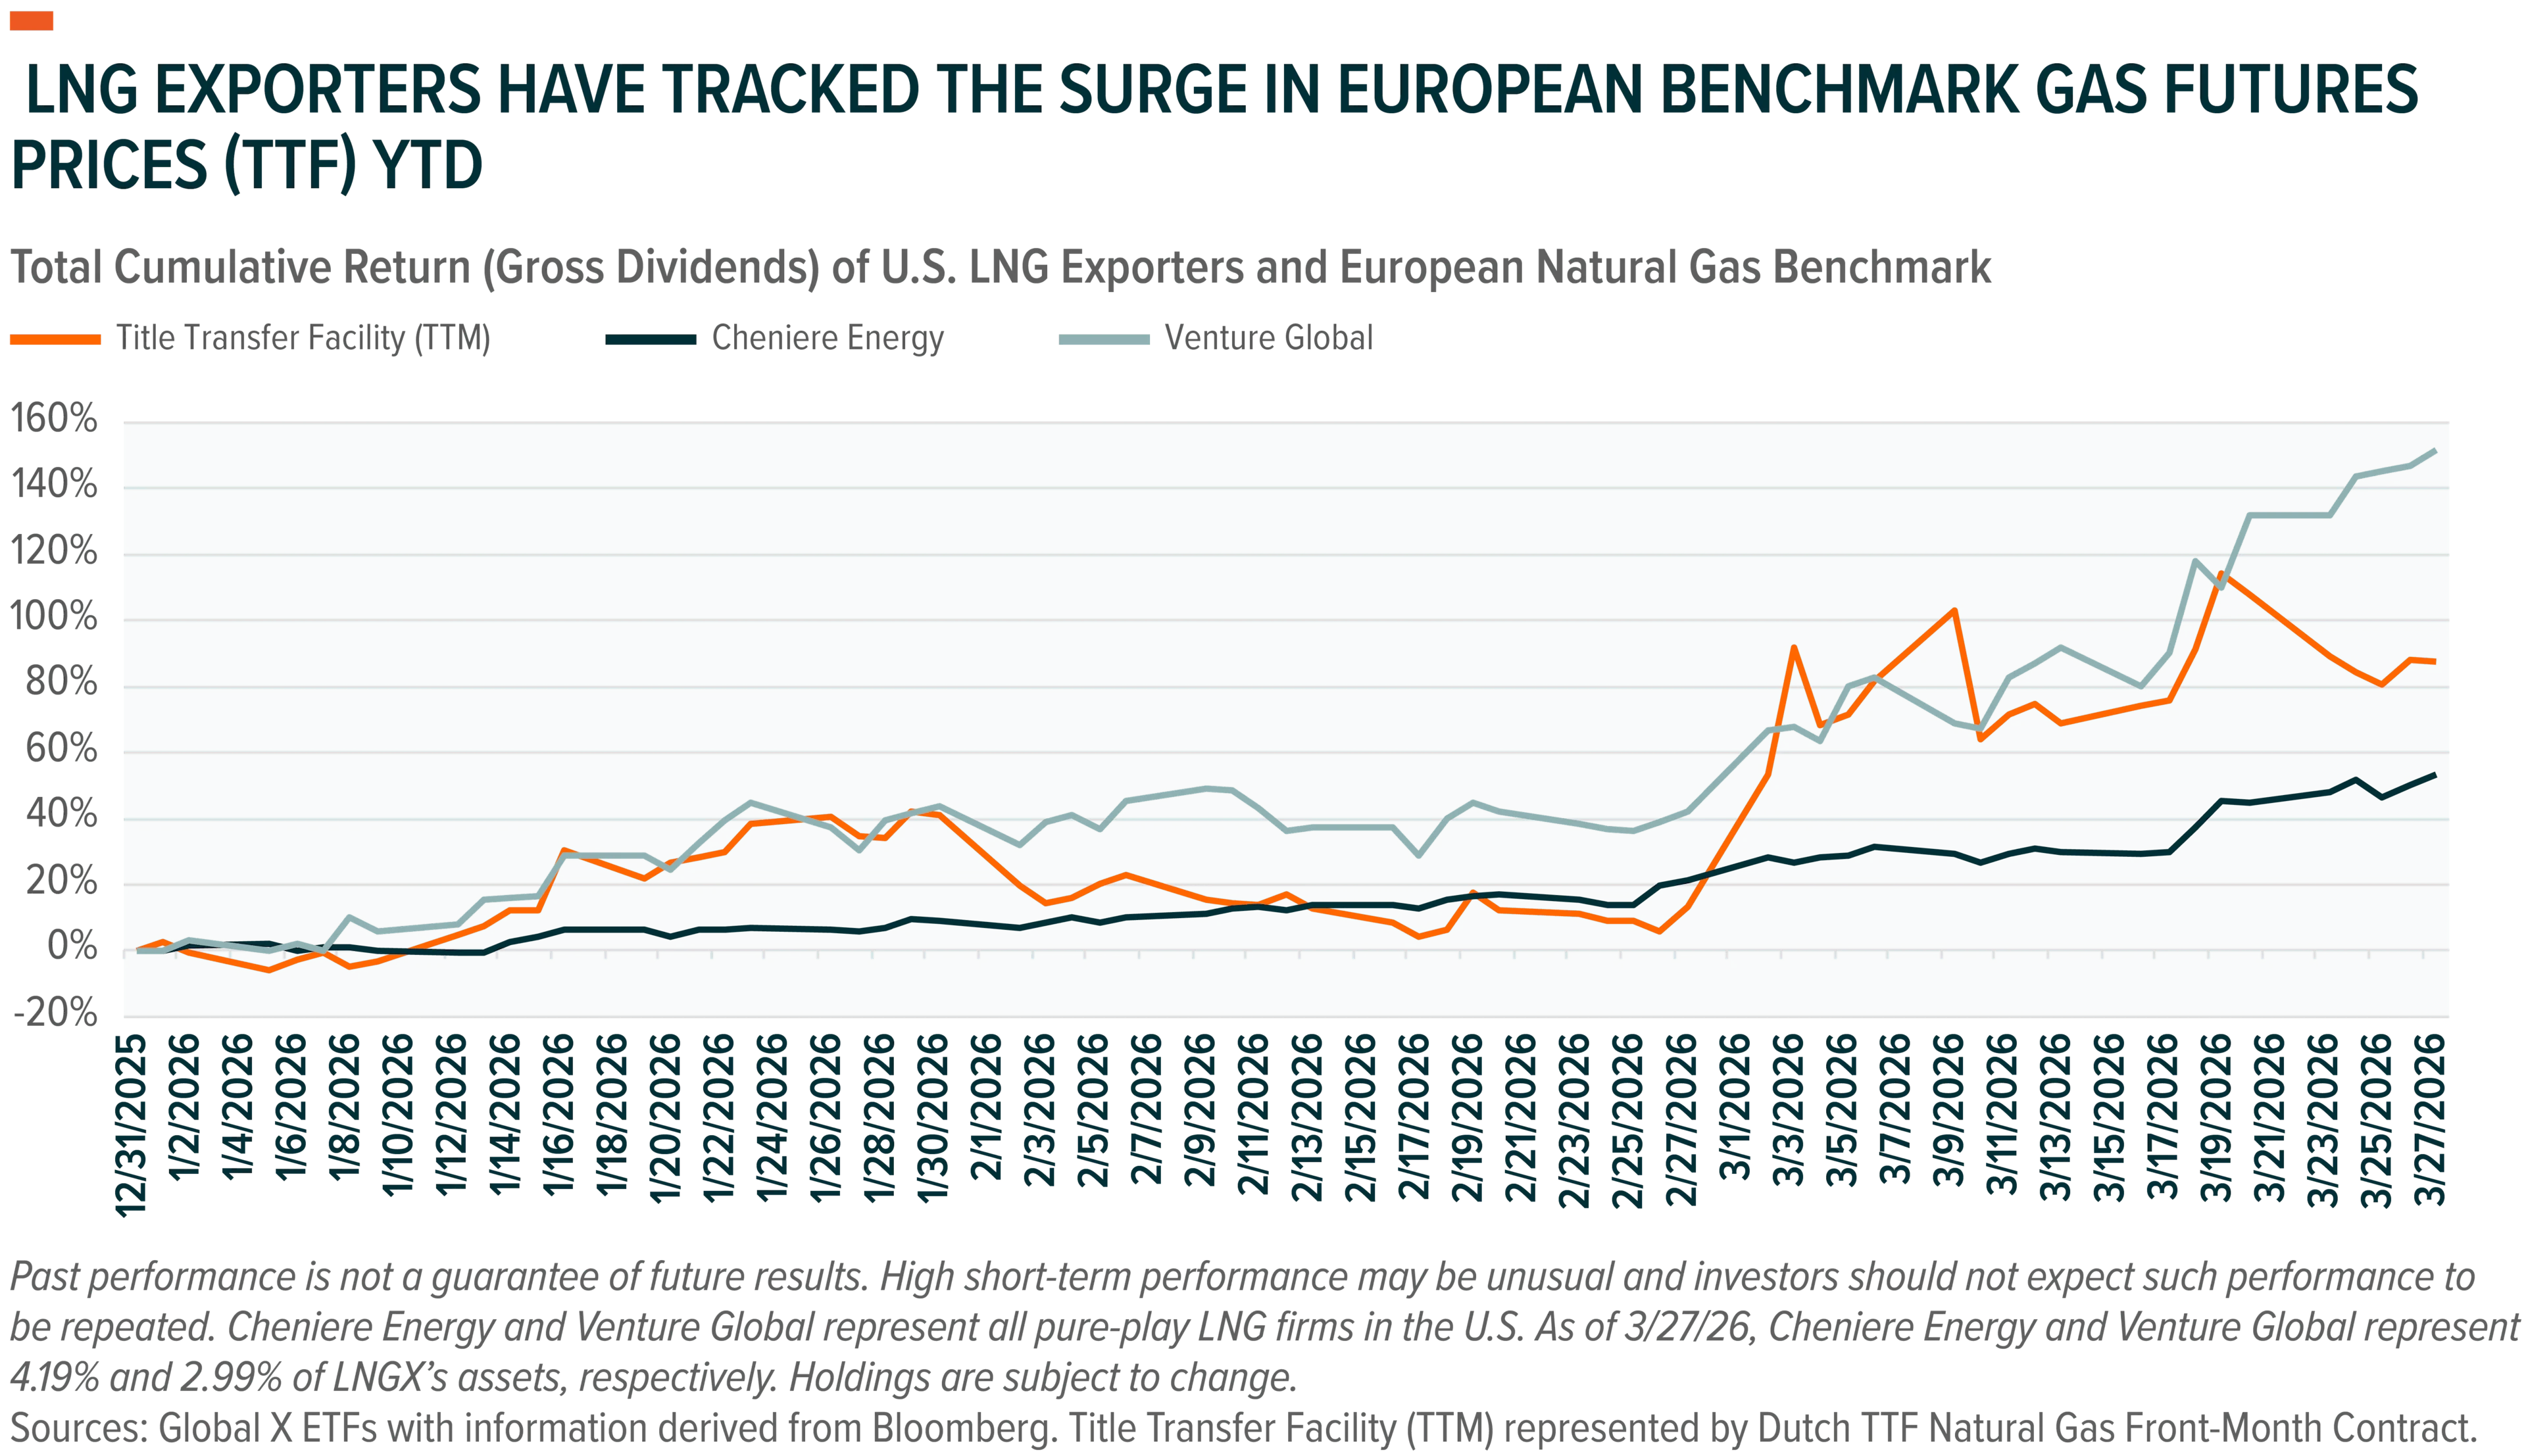
The sudden loss of Qatari supply has intensified competition for remaining cargoes, particularly among energy-importing regions such as Asia and Europe that rely heavily on LNG imports. European benchmark natural gas prices – measured by the Title Transfer Facility (TTF), a key pricing hub that often reflects global LNG demand – have already surged as buyers compete for limited spot supply.24
Even if hostilities were to subside quickly, restarting liquefaction facilities, repositioning shipping fleets, and normalizing export logistics could take months, if not years. Should disruptions persist, the prolonged loss of Qatari cargos could exacerbate a burgeoning deficit in global LNG markets.25 In this environment, midstream LNG exporters have exhibited varying sensitivity to rising global gas prices, reflecting differences in contract structures and market exposure. Year-to-date through March 13th , Venture Global has returned approximately 92%, closely tracking the surge in benchmark European gas futures (TTF), while Cheniere Energy has returned roughly 30%.26 This divergence largely reflects differences in sales structures and benchmark gas exposures: midstream exporters with a greater share of LNG sold into foreign spot markets can benefit more immediately from rising global prices, whereas exporters with a larger portion of volumes tied to long-term contracts tend to experience more stable, but less price-sensitive, performance.27
North American Energy: A Potential Hedge Against Energy-Induced Stagflation
While markets initially priced the Strait of Hormuz disruption as temporary, a prolonged closure risks amplifying global energy shortages, broader supply chain dislocations, and damage to Middle Eastern energy infrastructure. As the disruption persists, markets are once again turning toward North American energy exports as a potential source of relief. This mirrors the role U.S. crude and LNG played following Russia’s 2022 invasion of Ukraine, when Europe rapidly replaced Russian energy supplies with imports from the United States and other Atlantic Basin producers. This dynamic highlights the growing strategic importance of North American energy infrastructure, particularly the midstream networks that move oil and natural gas from production basins to global markets.
Midstream Infrastructure Sits at the Center of the Export System
Master Limited Partnerships (MLPs) and midstream corporations have been the direct beneficiaries of a global energy trade that has increasingly shifted power away from OPEC+ and toward the United States. They led the U.S. to become the world’s largest oil producer in 2018 and the world’s largest LNG exporter in 2022.28,29 In more recent times, they have promoted the nation’s ability to rapidly capture market share across both global oil production and LNG export capacity, which is estimated to double by the end of the decade.30 We continue to achieve energy production records in the post-COVID era, with output for both crude oil & natural gas reaching all-time highs again in 2025, translating into record throughputs for North American midstream infrastructure.31
At the same time, OPEC’s share of global oil production has diminished over the past decade, ceding market share to the U.S. and other western producers.32 In LNG, Qatari expansion plans, which were set to rival U.S. growth, have now been thrown into question amidst Iranian attacks on its Ras Laffan LNG export facility.33
As global markets search for reliable sources of energy supply outside geopolitically sensitive regions, incremental demand for North American oil and gas must move through this infrastructure. In practice, this means higher volumes flowing through pipelines and export terminals, which can support throughput-driven revenue growth for midstream operators. The U.S. hit record energy production volumes in 2025 when crude oil prices averaged between $60-$70 per barrel and natural gas prices averaged $3.52 per MMBtu.34,35 Should energy prices move materially higher in 2026, we think this could result in higher throughputs for midstream names even if the conflict resolves.
A way to access this segment of the market is through ETFs focused on North American midstream infrastructure. The Global X MLP ETF (MLPA) provides exposure to U.S.-listed MLPs that own and operate the infrastructure supporting North American energy exports, including pipelines, processing facilities, storage assets, and export terminals that move hydrocarbons from production basins to domestic and international markets. Meanwhile, the Global X MLP & Energy Infrastructure ETF (MLPX) widens this exposure to include midstream corporations, MLPs, and General Partners of MLPs.. As demand for U.S. oil and natural gas increases, these midstream networks may play a critical role in transporting incremental supply worldwide.
Disruptions Highlight the Strategic Role of North American LNG
Beyond the immediate price impact, the disruption to Gulf exports could trigger a broader reassessment of the global energy supply chain supply chains. Qatar has historically been viewed as one of the most reliable LNG suppliers, but the shutdown of its Ras Laffan export hub following the Strait closure has raised questions about the vulnerability of supply concentrated in geopolitically sensitive regions.
U.S. LNG cargoes also offer structural advantages relative to many global competitors. Unlike traditional LNG contracts tied to rigid destination clauses, many U.S. export contracts are sold on a “free on board” (FOB) basis, transferring ownership at the export terminal and allowing buyers to redirect cargoes to the higher-priced markets.36 This flexibility has made U.S. LNG particularly valuable during periods of market stress, enabling cargoes to flow rapidly toward regions facing supply shortages. The latest disruption in the Middle East further reinforces North America’s reputation as a relatively stable and reliable energy supplier.
In contrast to regions facing geopolitical risk, North America offers abundant hydrocarbon resources, a deep capital market, and a mature midstream network capable of scaling exports. The United States has already emerged as the world’s largest LNG exporter, with export capacity projected to expand significantly later this decade. Several major LNG importers – including Taiwan, Bangladesh, and China – have already signaled interest in securing additional U.S. supply following the outbreak of the conflict.37
Investors seeking exposure to the U.S. natural gas value chain may consider vehicles such as the Global X U.S. Natural Gas ETF (LNGX), which provides targeted exposure to U.S. domiciled companies involved in the production, transportation, and export of natural gas. The fund includes firms operating liquefaction facilities, natural gas pipelines, and upstream producers supplying feedgas to export terminals. As global buyers increasingly turn to North America for reliable energy supply, this shift in demand could drive additional volumes through North American export infrastructure, benefiting both LNG exporters and the midstream networks responsible for delivering hydrocarbons to the coast.
Adding Energy Exposure in Your Portfolio
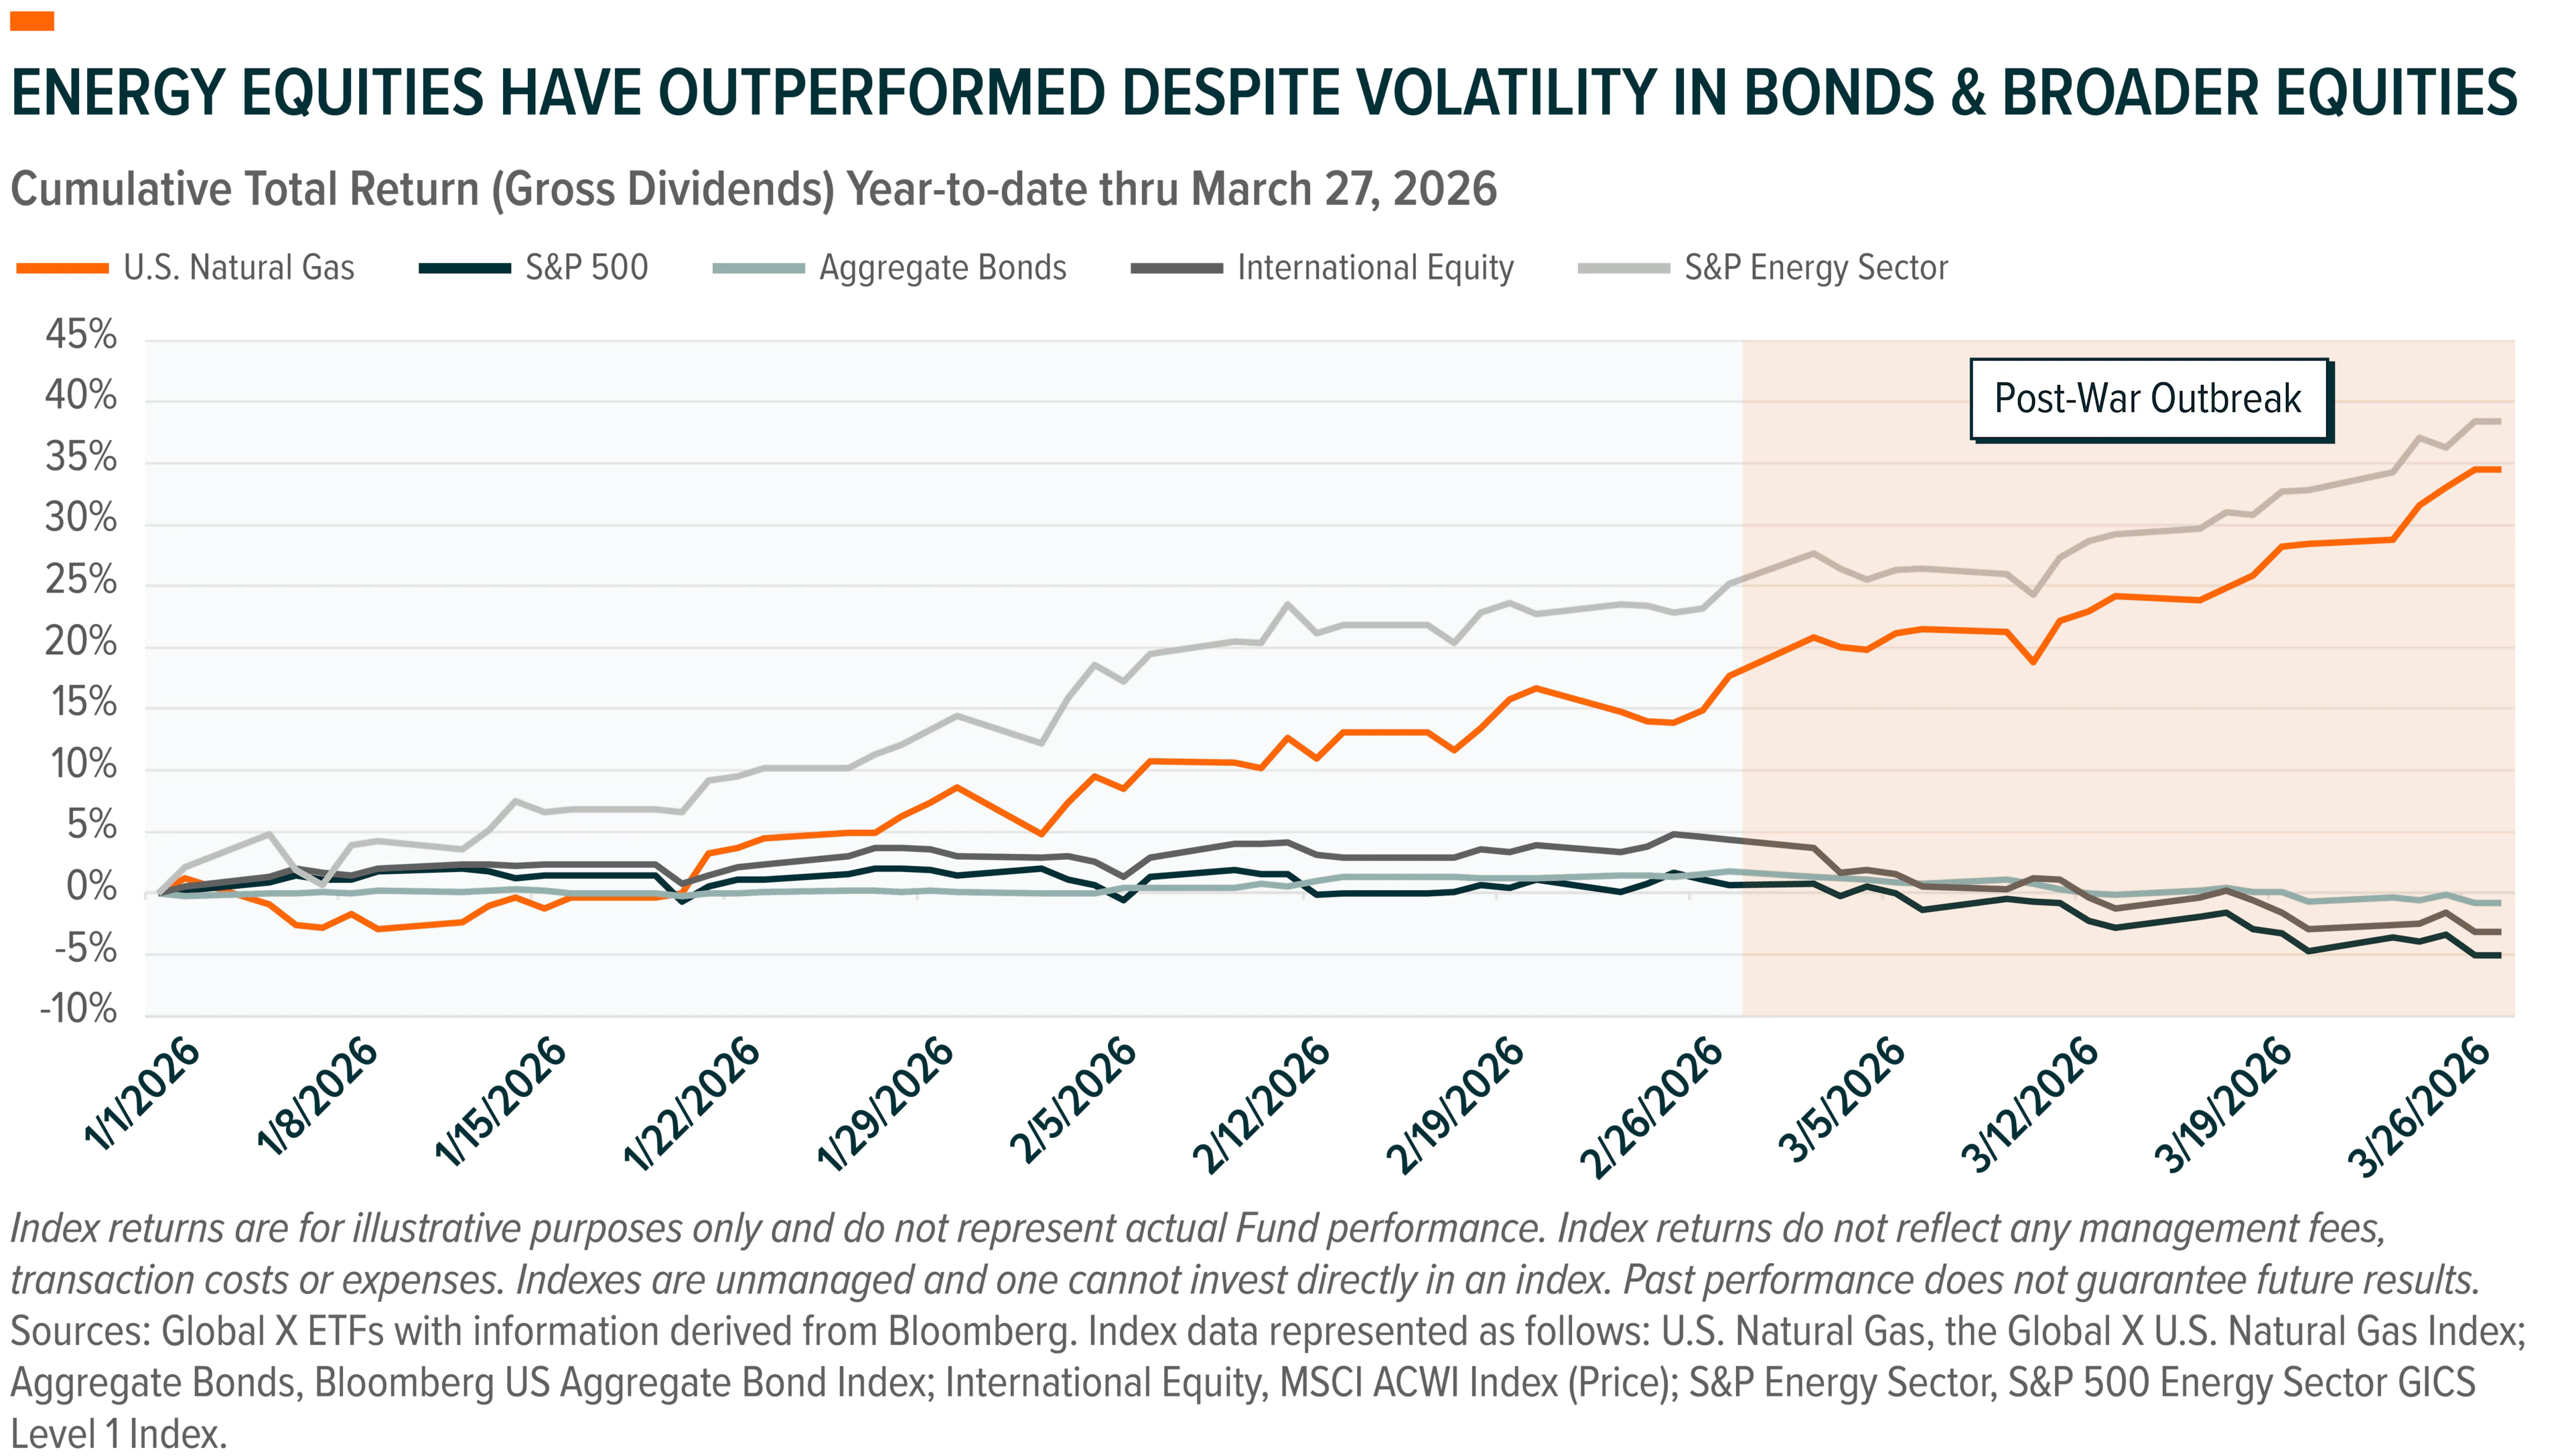
It’s intuitive to assume that the geopolitical risk premiums that have arisen as a function of war may normalize eventually. That said, the impact the current conflict has on global energy markets could be long lasting. An extended disruption for the energy trade has already prompted concerns over potential stagflation, with both equities and bonds selling off during the first two weeks of the war. This rising correlation between stocks and bonds weakens the traditional diversification impact of a conventional 60% equity/40% fixed income portfolio.38
Energy equities have already performed well this year amid a broader sector rotation toward capital-intensive asset heavy stocks. We believe some of the rotation may have been priced into markets in the months leading up to the war as energy prices rose.39 However, since the outbreak of the war, energy equities, as well as U.S. natural gas names, have outperformed both bonds and broader equities, potentially reflecting rising expectations for a tighter supply environment.40
Market Implications
Conclusion
Regardless of how or when the conflict in the Middle East is ultimately resolved, the closure of the Strait of Hormuz may promote a shift in global energy market values from cost efficiency to supply-chain security. By directly impairing the flow of oil and LNG, the conflict exposes how vulnerable global energy trade remains to concentrated chokepoints.
Even if conditions stabilize, buyers may seek to diversify supply toward more reliable regions like North America, which is supported by abundant resources and an established export infrastructure. For investors, this reinforces the budding importance of midstream infrastructure and LNG exporters, as energy exposure evolves from a cyclical trade into a more structural portfolio consideration.
Related ETFs
MLPX – Global X MLP & Energy Infrastructure ETF
LNGX – Global X U.S. Natural Gas ETF
Click the fund name above to view current performance and holdings. Holdings are subject to change. Current and future holdings are subject to risk.