

Indian equities rebounded sharply in the second quarter, as easing Middle East tensions and falling energy prices reversed the first quarter's key headwind.
Market Review
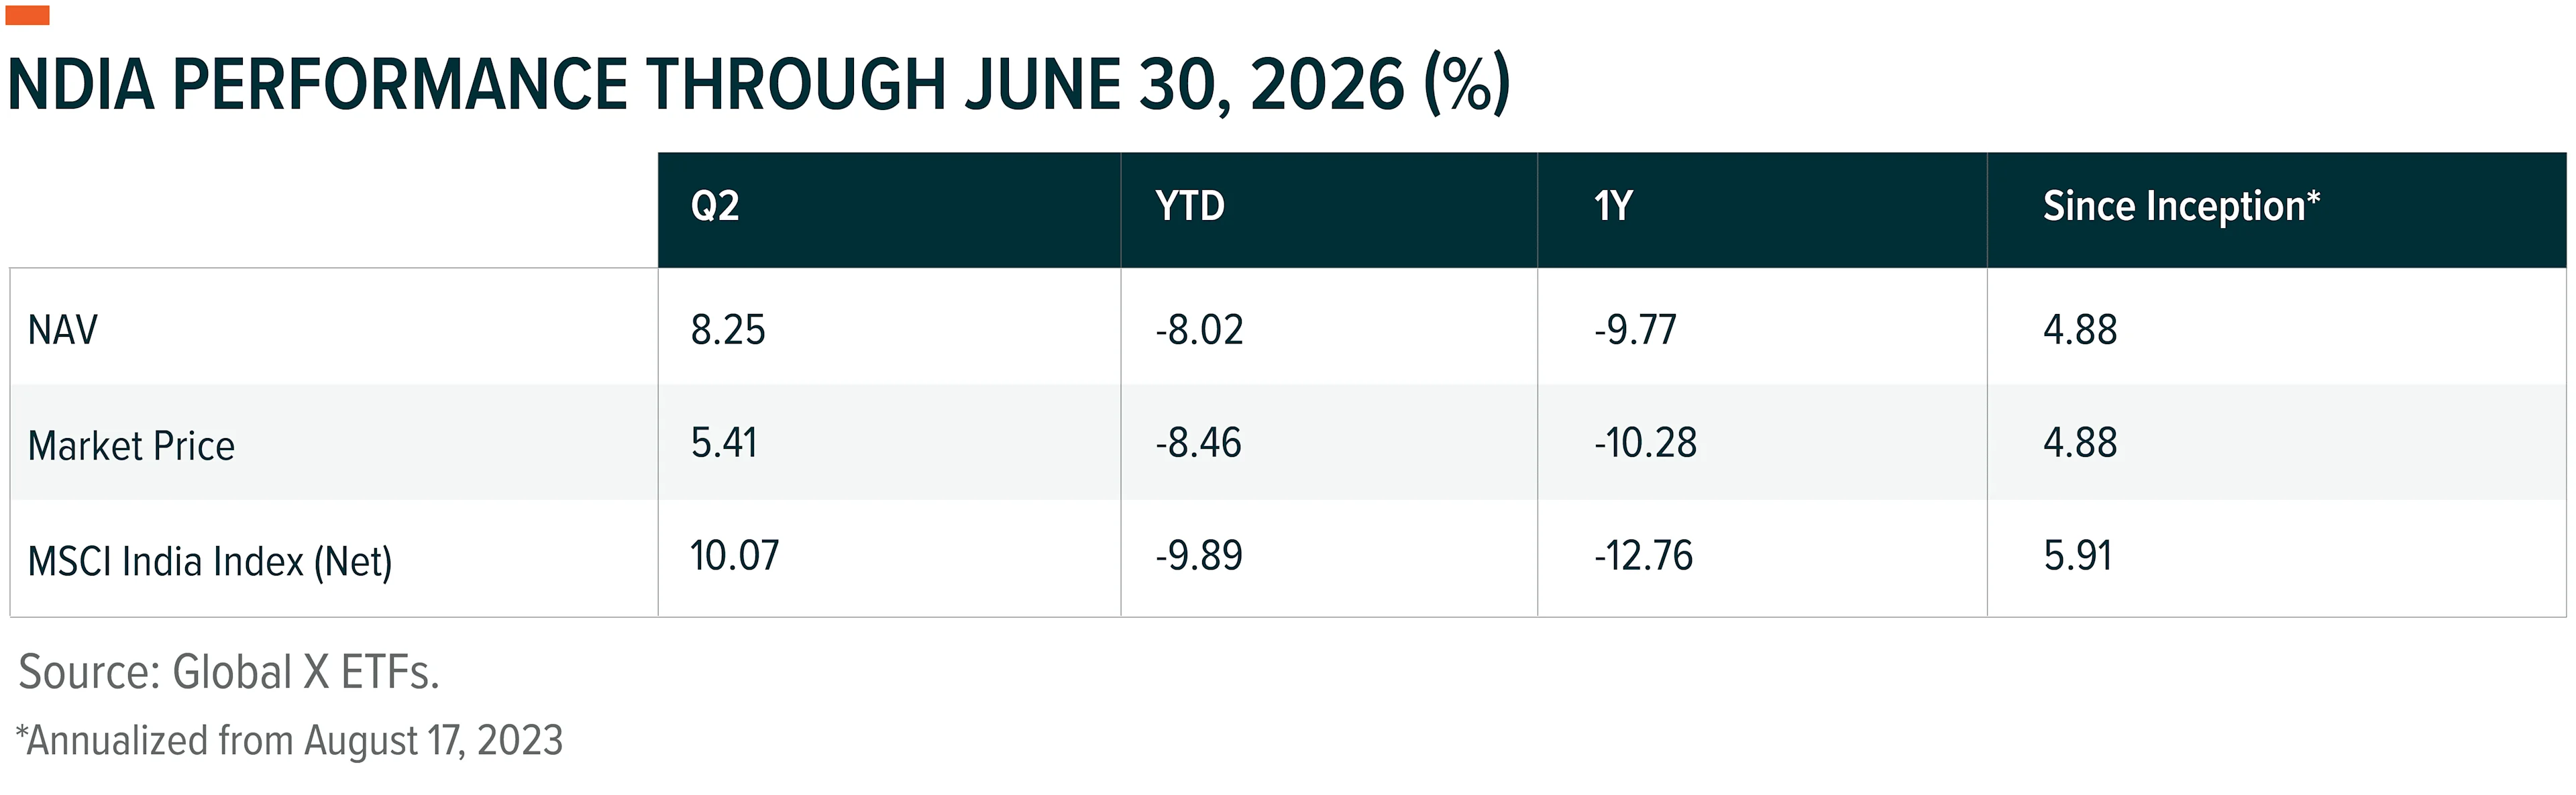
Indian equities recovered in the second quarter after a difficult start to the year. The MSCI India Index (Net) returned 10.07%, reversing much of the first quarter's -18.13% decline, as the geopolitical shock that had driven oil prices sharply higher began to fade.1 A pause in the Iran-Israel conflict and progress toward a U.S.-Iran understanding pulled crude oil sharply lower through the back half of the quarter, easing pressure on India's import bill and the rupee.2
The rally was narrow. Financials led decisively, with the Nifty Bank and Nifty Private Bank indices each rising more than 6% in June alone, while the Nifty IT index fell -9.56% over the same month as index heavyweights such as TCS, Infosys, and Wipro were pressured by weak global tech spending signals and a higher-for-longer U.S. interest rate outlook.3 The Reserve Bank of India (RBI) held its repo rate at 5.25% for a third straight meeting in June, trimming its fiscal year (FY) 2027 growth forecast to 6.6% and raising its inflation projection to 5.1%, citing West Asia tensions, energy prices, and monsoon uncertainty.4 Domestic demand indicators stayed firm: gross GST (goods and services tax) collections for June rose 13.9% year-over-year, aided by continued fiscal support from the 2025 GST rationalization and income-tax relief.5
Fund Performance & Attribution
NDIA returned 8.25% (NAV) in the second quarter versus 10.07% for its benchmark, the MSCI India Index (Net), a relative shortfall of 1.82 percentage points.6 On a market price basis, the fund returned 5.41%, a difference explained by timing. While the Fund’s NAV is calculated using its holdings’ prices as of 4:00 PM Eastern Time, many of the holdings themselves cease trading at the end of their local (India) market’s close. As a result, the NAV did not take into account market movements throughout the U.S. trading day on March 31st after Indian markets closed, while the market return does incorporate this activity. Year to date, the fund has outperformed its benchmark, returning -8.02% (NAV) against -9.89%, putting NDIA ahead by 1.87 percentage points for the year.7
From a sector perspective, Real Estate, Consumer Staples, and Energy contributed the most to relative performance, while Information Technology, Utilities, and Industrials detracted the most.
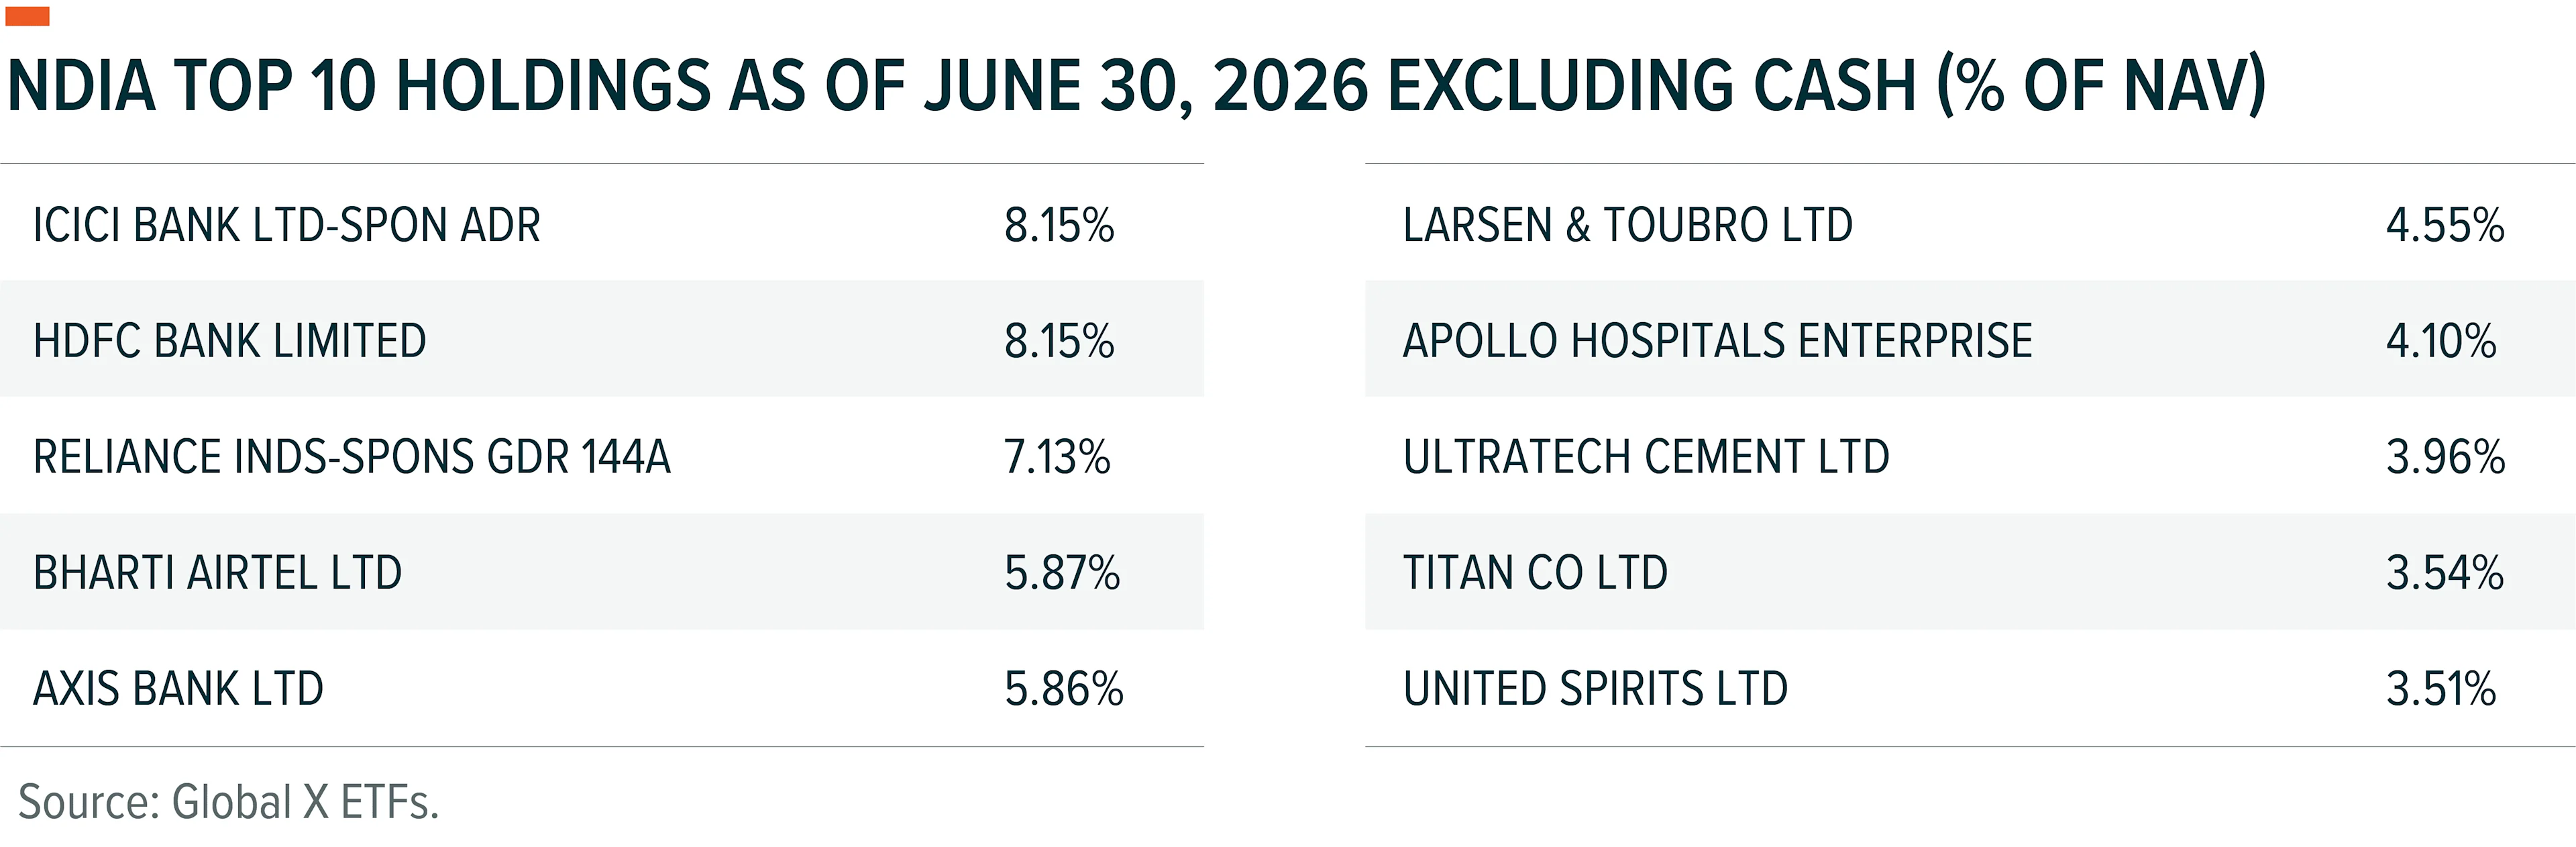
At the stock level, overweight positions in Prestige Estates Projects, Apollo Hospitals Enterprise, and Axis Bank were the largest contributors. Bajaj Finance, the Infosys ADR, and Hindustan Aeronautics were the largest detractors, the latter reflecting a new position established during the quarter that underperformed shortly after being added.
We added Hindustan Aeronautics and Solar Industries India during the quarter, funded in part by sales of General Insurance Corp of India and Timken Co.
The performance data quoted represents past performance. Past performance does not guarantee future results. The investment return and principal value of an investment will fluctuate so that an investor's shares, when sold or redeemed, may be worth more or less than their original cost and current performance may be lower or higher than the performance quoted. Performance current to the most recent quarter- and month-end is available at NDIA – Global X India Active ETF. Expense Ratio: 0.75%.
Holdings subject to change
Outlook
The second quarter's reversal reinforces our first-quarter view: India's near-term performance remains unusually sensitive to the price of imported crude oil, given that the country sources roughly 90% of its oil from abroad.8 With energy prices having eased and the RBI signaling continued caution rather than tightening, we believe the immediate macro headwind has moderated, though the central bank's own upgraded inflation forecast and trimmed growth outlook suggest it sees limited room to ease further in the near term.9
The structural case is unchanged. GST 2.0 and income-tax relief continue to support consumption, and June's GST collections point to resilient underlying demand.10 Valuations remain below long-term averages following the correction earlier this year, and we believe India's demographic and manufacturing-diversification tailwinds remain intact over a multi-year horizon.11 The market’s rotation into financials and out of technology in the second quarter is a reminder that leadership within the market can shift quickly; we believe active management remains critical to navigating that dispersion. The strategy focuses on identifying companies with durable competitive advantages, strong management teams, and the ability to compound returns above their cost of capital.
Why this Fund
As of July 13, 2026, the MSCI India Index (Net) traded roughly one standard deviation below its historical price/earnings ratio (P/E) at ~18.6x.12 This presents an opportunity to gain exposure to one of the fastest growing economies in the world with multiple potential growth catalysts driven by attractive demographics, a market friendly government, supply chain diversification, and a fast-growing middle class. The Global X India Active ETF (NDIA) was the first active India ETF listed in the United States and comes with a client friendly structure that offers bottom-up active management with a competitive fee, along with the liquidity and transparency of the ETF structure. The fund’s portfolio managers are also supported by a 14 person on the ground analyst team in Mumbai at Global X’s affiliate, Mirae Asset.
Related ETF
NDIA – Global X India Active ETF
Click the fund name above to view current performance and holdings. Holdings are subject to change. Current and future holdings are subject to risk.
