On October 29, 2025, we listed the Global X U.S. Natural Gas ETF (LNGX) on the New York Stock Exchange ARCA. LNGX delivers targeted exposure to the domestic natural gas supply chain, spanning across upstream production from America’s prolific basins and midstream services, which include processing, transportation, and exports. The fund seeks to offer exposure to the structural growth themes that exist across the U.S. natural gas industry.
U.S. natural gas production represents the backbone of global energy supply, with strong tailwinds underpinning the sector’s recent expansion. Natural gas remains the largest source of U.S. energy production and it has retained this title in every year since 2011.1 At the same time, the U.S. has transitioned from being a net energy importer to the world’s largest energy exporter in just under a decade, with natural gas exports being a key contributor to that growth.2 These changing dynamics present the U.S. with a significant opportunity when considering expectations around power consumption, AI leadership, and energy security.
Our analysis suggests that natural gas may be optimally positioned to capitalize on these budding tailwinds in the near term. Furthermore, we believe the U.S. natural gas complex harbors unique characteristics that distinguish it from global competitors, including favorable export terms, permissive policy tailwinds, and advantageous costs of production. These factors have allowed the U.S. to lead the pipeline in global liquefaction capacity additions thru 2030,3 and we believe our targeted approach to investing in the U.S. natural gas supply chain presents a compelling vehicle for capturing these structural tailwinds.
Key Takeaways
The United States is the global leader in natural gas production exports, home to some of the world’s most prolific gas basins where supply has been unlocked by energy infrastructure expansion and the shale revolution.
Liquefied natural gas (LNG) exports and rising power consumption fuel the urgency for greater U.S. natural gas output. Production and infrastructure will need to grow hand-in-hand to meet rising demand.
The Global X U.S. Natural Gas ETF provides pure-play exposure to the domestic natural gas and natural gas liquid value chain, targeting upstream and midstream names within the U.S. with high exposure to natural gas.
The U.S. Has a Major Opportunity in Natural Gas
Natural gas is an odorless hydrocarbon natural resource that is extracted directly through natural gas drilling. It’s also a by-product of oil drilling (“associated natural gas production”). Natural gas primarily consists of methane, but it also consists of ethane, butane, and propane (collectively, natural gas liquids, or “NGLs”), which are often separated during processing. It’s used in a variety of residential and commercial applications, which include industrial uses, power generation, heating, cooking, and even transportation. More recently, natural gas has gained importance in power generation, as electricity demand continues to rise.
The recent uptick in power demand has led both utilities and AI hyperscalers to seek scalable and reliable solutions for meeting expected demand growth. As a reliable source of baseload power, natural gas has been favored by data center operators for its ability to operate all hours of the day, a critical quality for powering essential tech infrastructure. Natural gas plants also encompass familiar designs that are relatively quick to deploy. This has led to an uptick in orders for gas turbines, with order backlogs that span years.4
As of August 2025, there are nearly 75 gigawatts (GW) of new gas plant projects in the U.S. that dot the roadmap out to 2030.5 This is a function of surging worldwide demand for natural gas that is expected to rise to new heights in the coming decade. Current forecasts call for total U.S. natural gas consumption to rise by as much as 25 billion cubic feet per day (Bcf/d) by 2030,6 representing nearly a 27% increase from 90.3 bcf/d in 2024. Key drivers of demand growth include growing exports, rising power consumption, and budding energy themes like electrification and AI data center expansions.
Data centers and energy exports have been meaningfully influential drivers of demand. At present, nearly 40% of data center power load is being fueled by natural gas.7 Should gas plant deployments persist, and natural gas gain greater share in AI power demand, Bloomberg projects gas power consumption from AI and data centers could rise to as much as 6.8 bcf/d by 2030, which could boost total U.S. gas-powered consumption by nearly 14%.8 The growth rates are even more stark when reviewing the roadmap for U.S. water-bound natural gas export capacity (“liquefaction capacity”), which is set to more than double to ~29 bcf/d by 2030.9
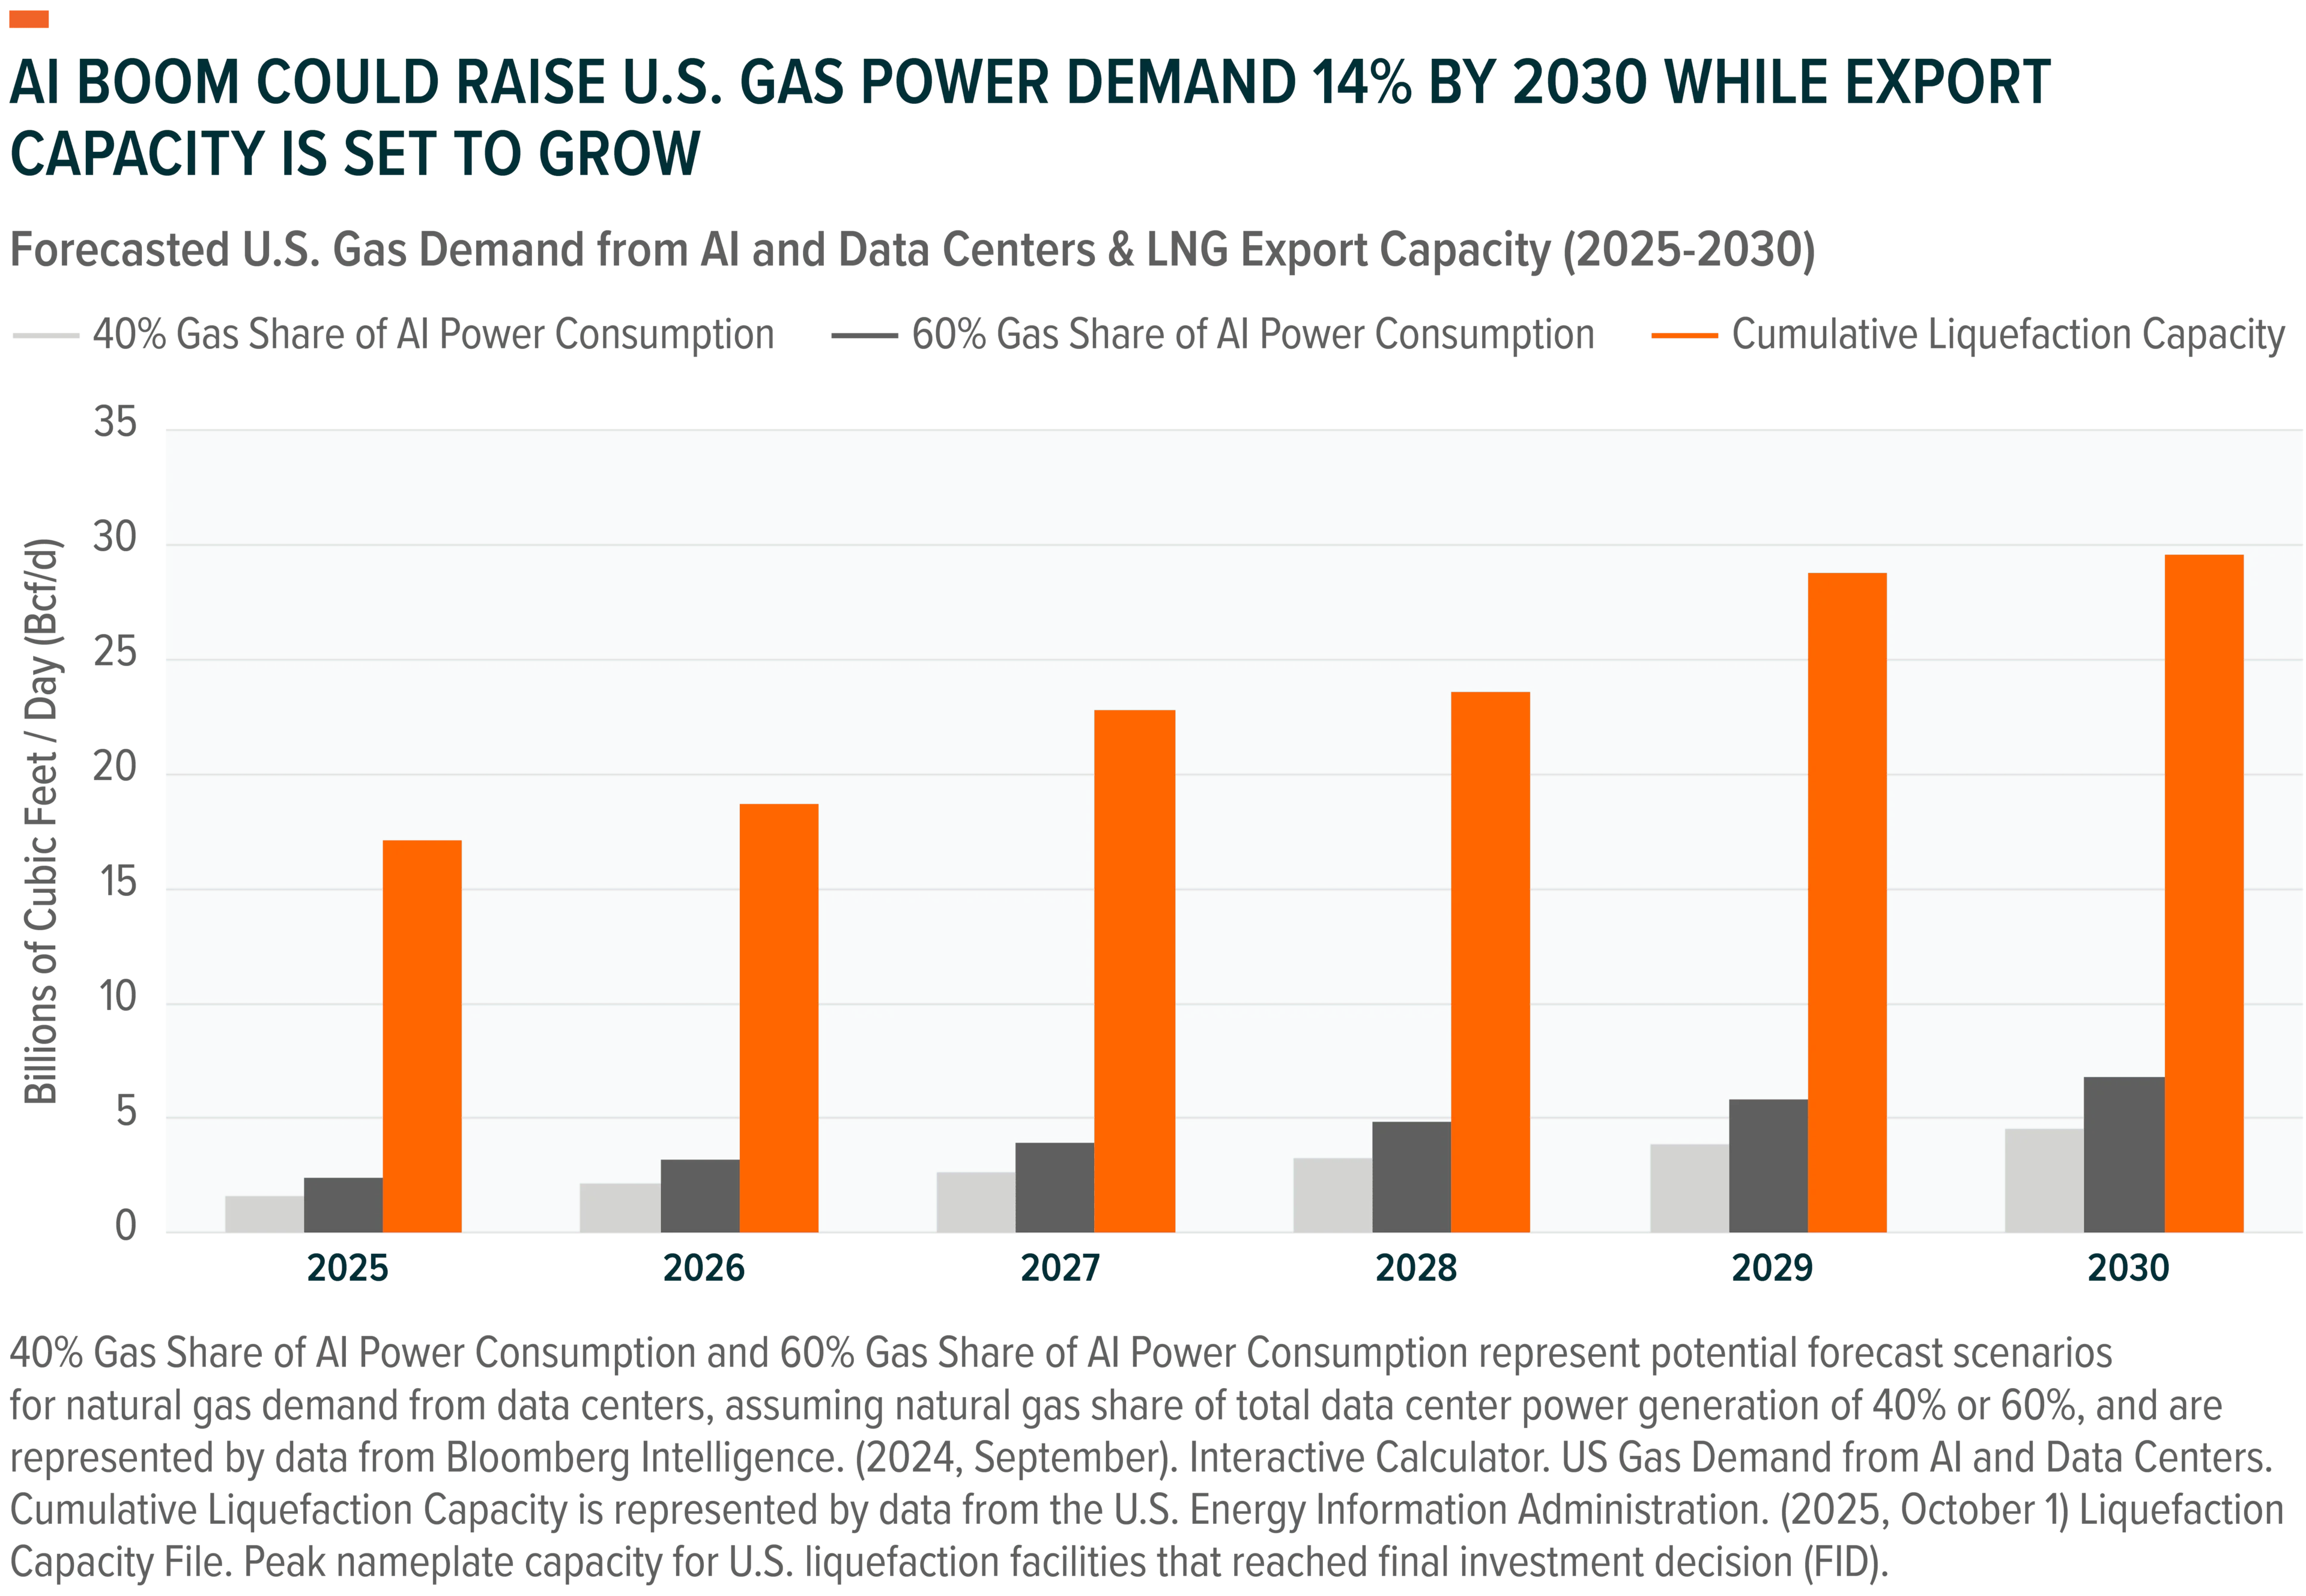
Growth in Exports Raises the Bar for Natural Gas Production
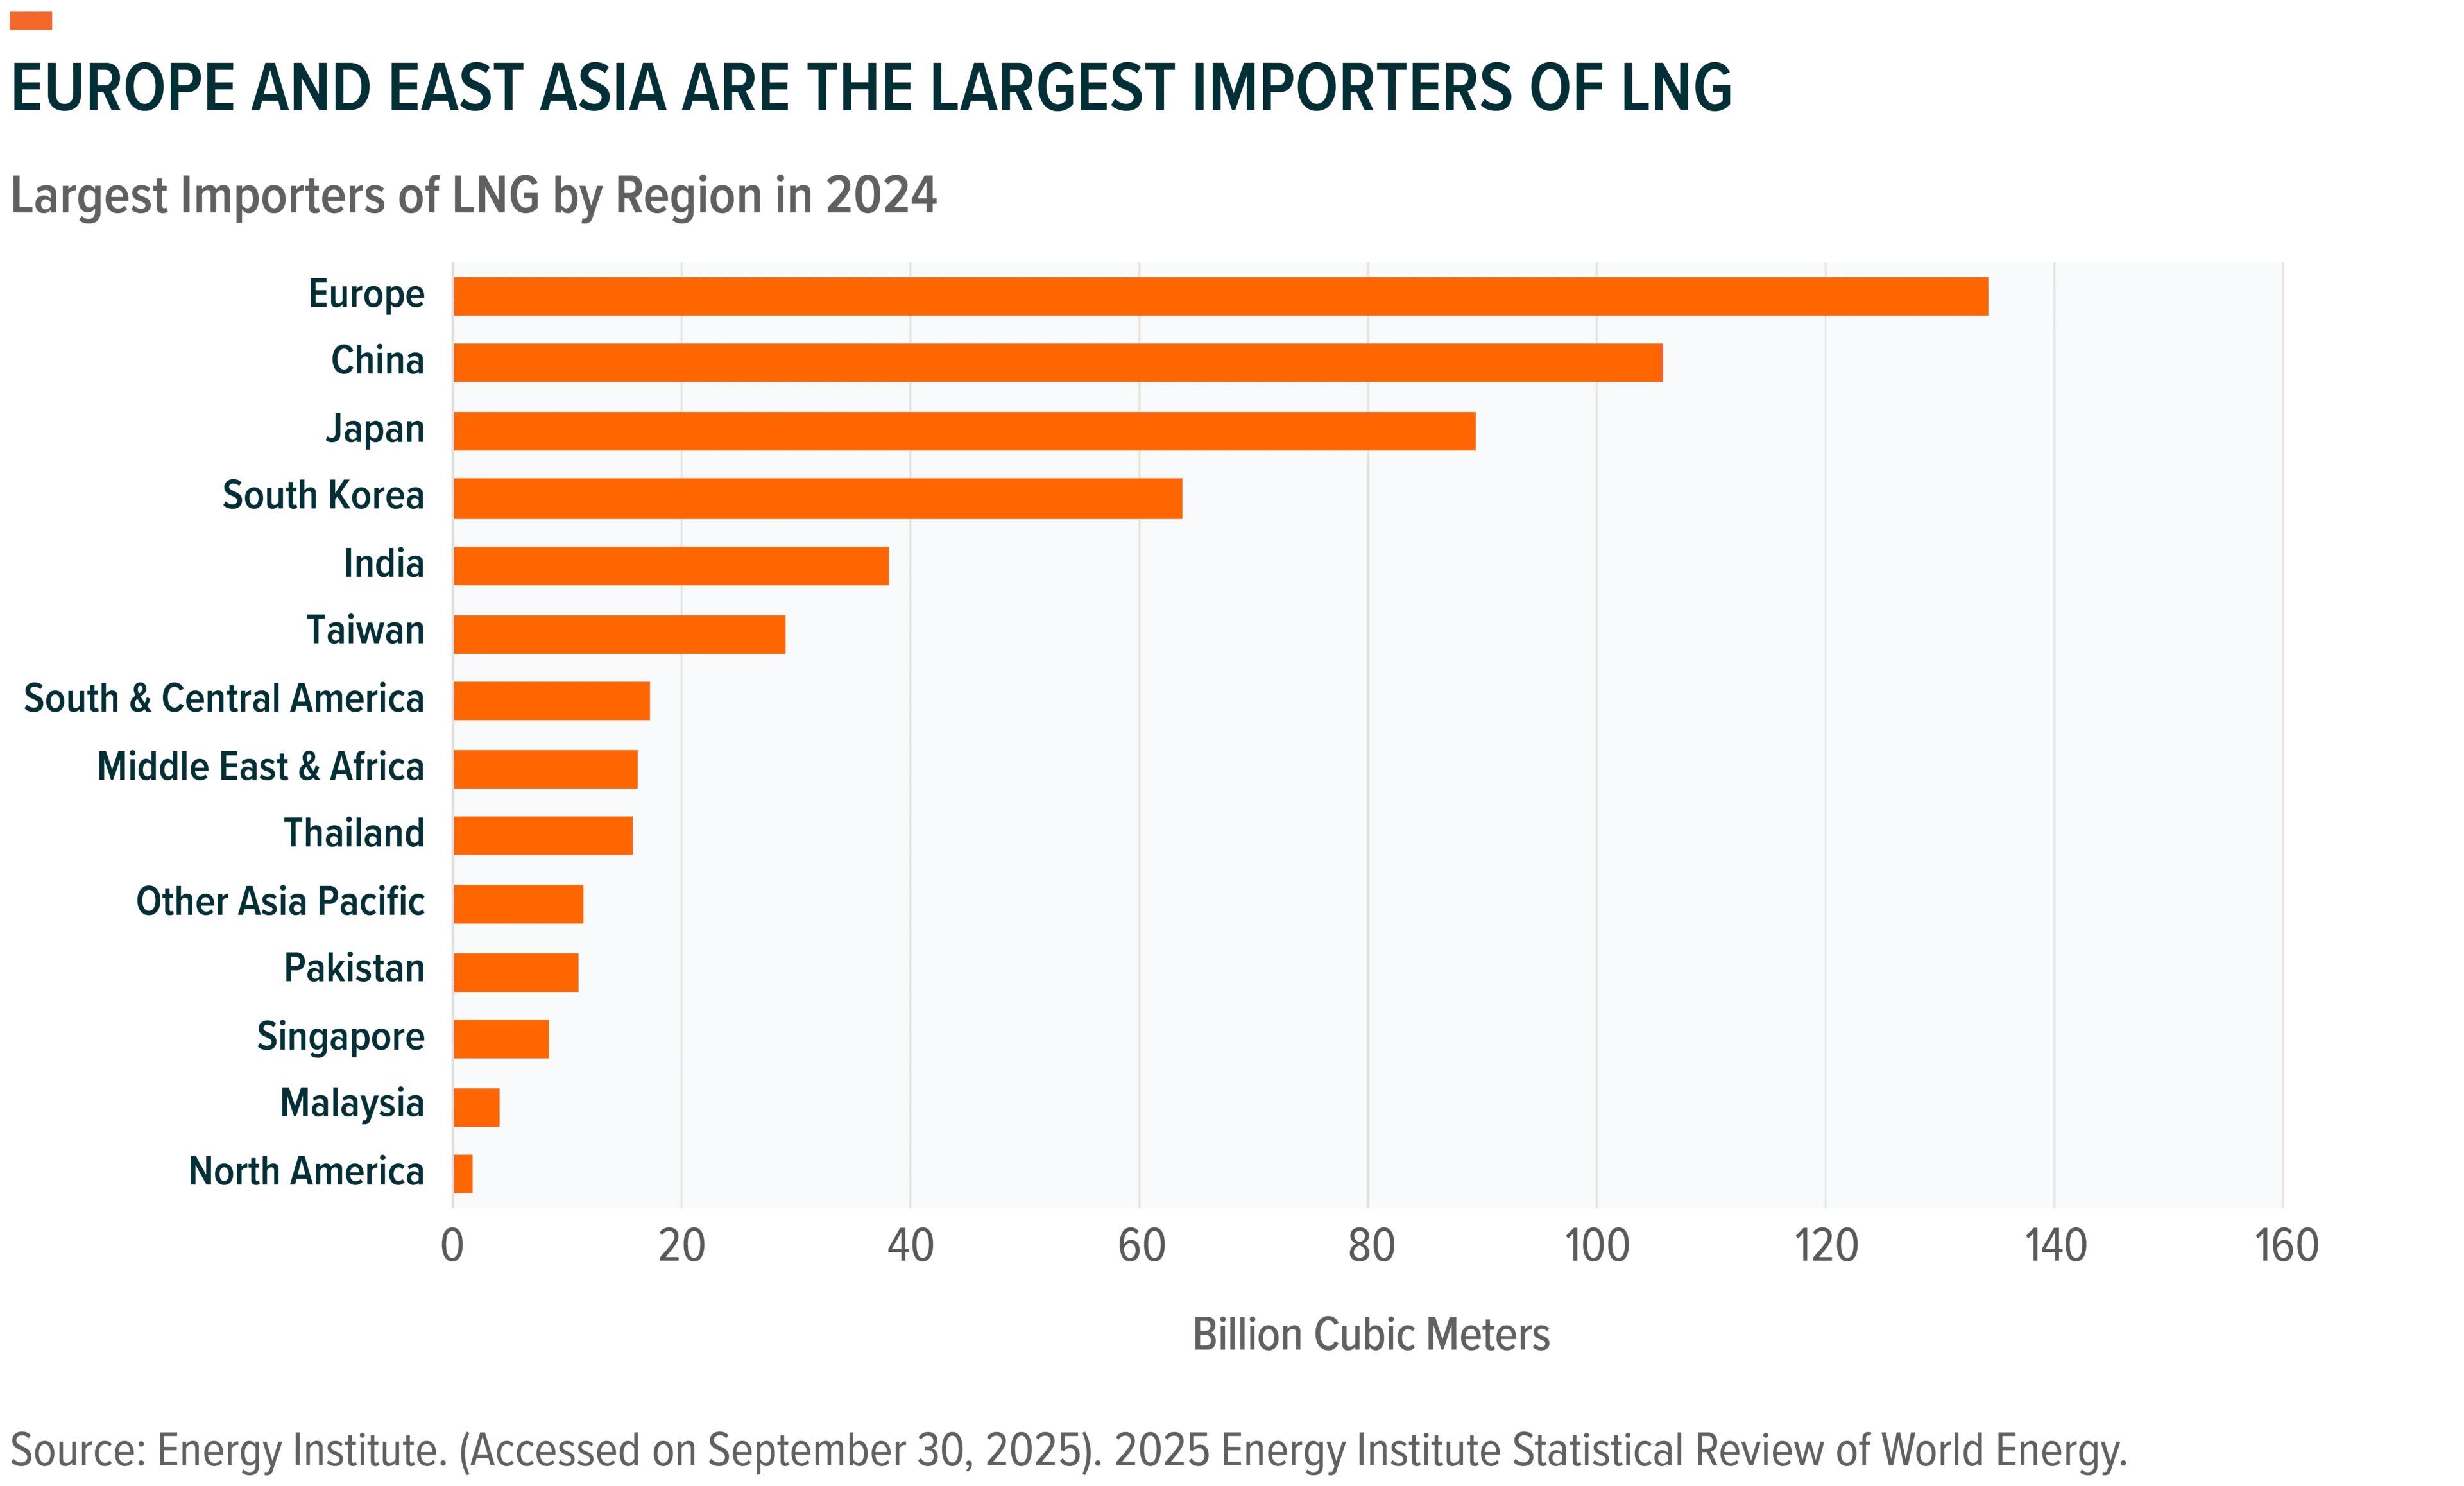
Global gas demand rose by 78 billion cubic meters in 2024 and is expected to see similar growth in 2025.10 Asia is the key driver of global demand growth, driven by rising consumption in China and India. India alone is set to increase its LNG imports four-fold by 2030 while China continues to see its power needs grow.11 We believe such trends are poised to persist over the coming decade, as global themes like electrification and AI growth migrate from developed to developing markets. We believe natural gas will be key to meeting the rise in consumption.
Case in point, natural gas exports represent the lion’s share of demand growth within the U.S. and have exerted a powerful demand-pull pressure on U.S. gas production. At the forefront of this trend are U.S. liquefied natural gas (LNG) exports, which are currently slated to grow 10% per year through the end of the decade.12 LNG consists of methane, super-chilled to its liquid form at -260-degree Fahrenheit, compressed by a factor of 600 times.13 While natural gas has historically been difficult to transport for technical and geographic reasons, LNG allows liquefied natural gas to be loaded onto specialized ships for transport and is the key link that make the intercontinental gas trade possible.14
As the dominant source of LNG supply, the U.S. exhibits significant clout in global gas markets, which have taken on increasingly geopolitical characteristics in recent years. Europe, for instance, has sought to wean itself off Russian gas imports in the aftermath of the 2022 conflict in Ukraine. Between 2021 and 2024, the EU saw pipeline gas (generally from Russian supply) as a share of imports decline from 70% to 50%, while the share of LNG imports doubled from 20% to 40%. The U.S. has been the biggest benefactor of this shift, thanks to its proximity and status as a politically stable export market. We’ve continued to see this trend proliferate, with U.S. exports to the EU rising to ~$20 billion in 2024, supplying 55% of all EU LNG imports.15 More recently, global trade partners have increasingly explored U.S. energy exports as a tool for reducing trade deficits. This was evident in trade deals signed with nations like Japan16 and Korea.17 Along these lines, the EU has committed to importing $750 billion worth of U.S. energy exports in exchange for lower levies on its exports in the coming years. We believe the bulk of such commitments are likely to be met via natural gas exports.18
The Opportunity in Upstream Production
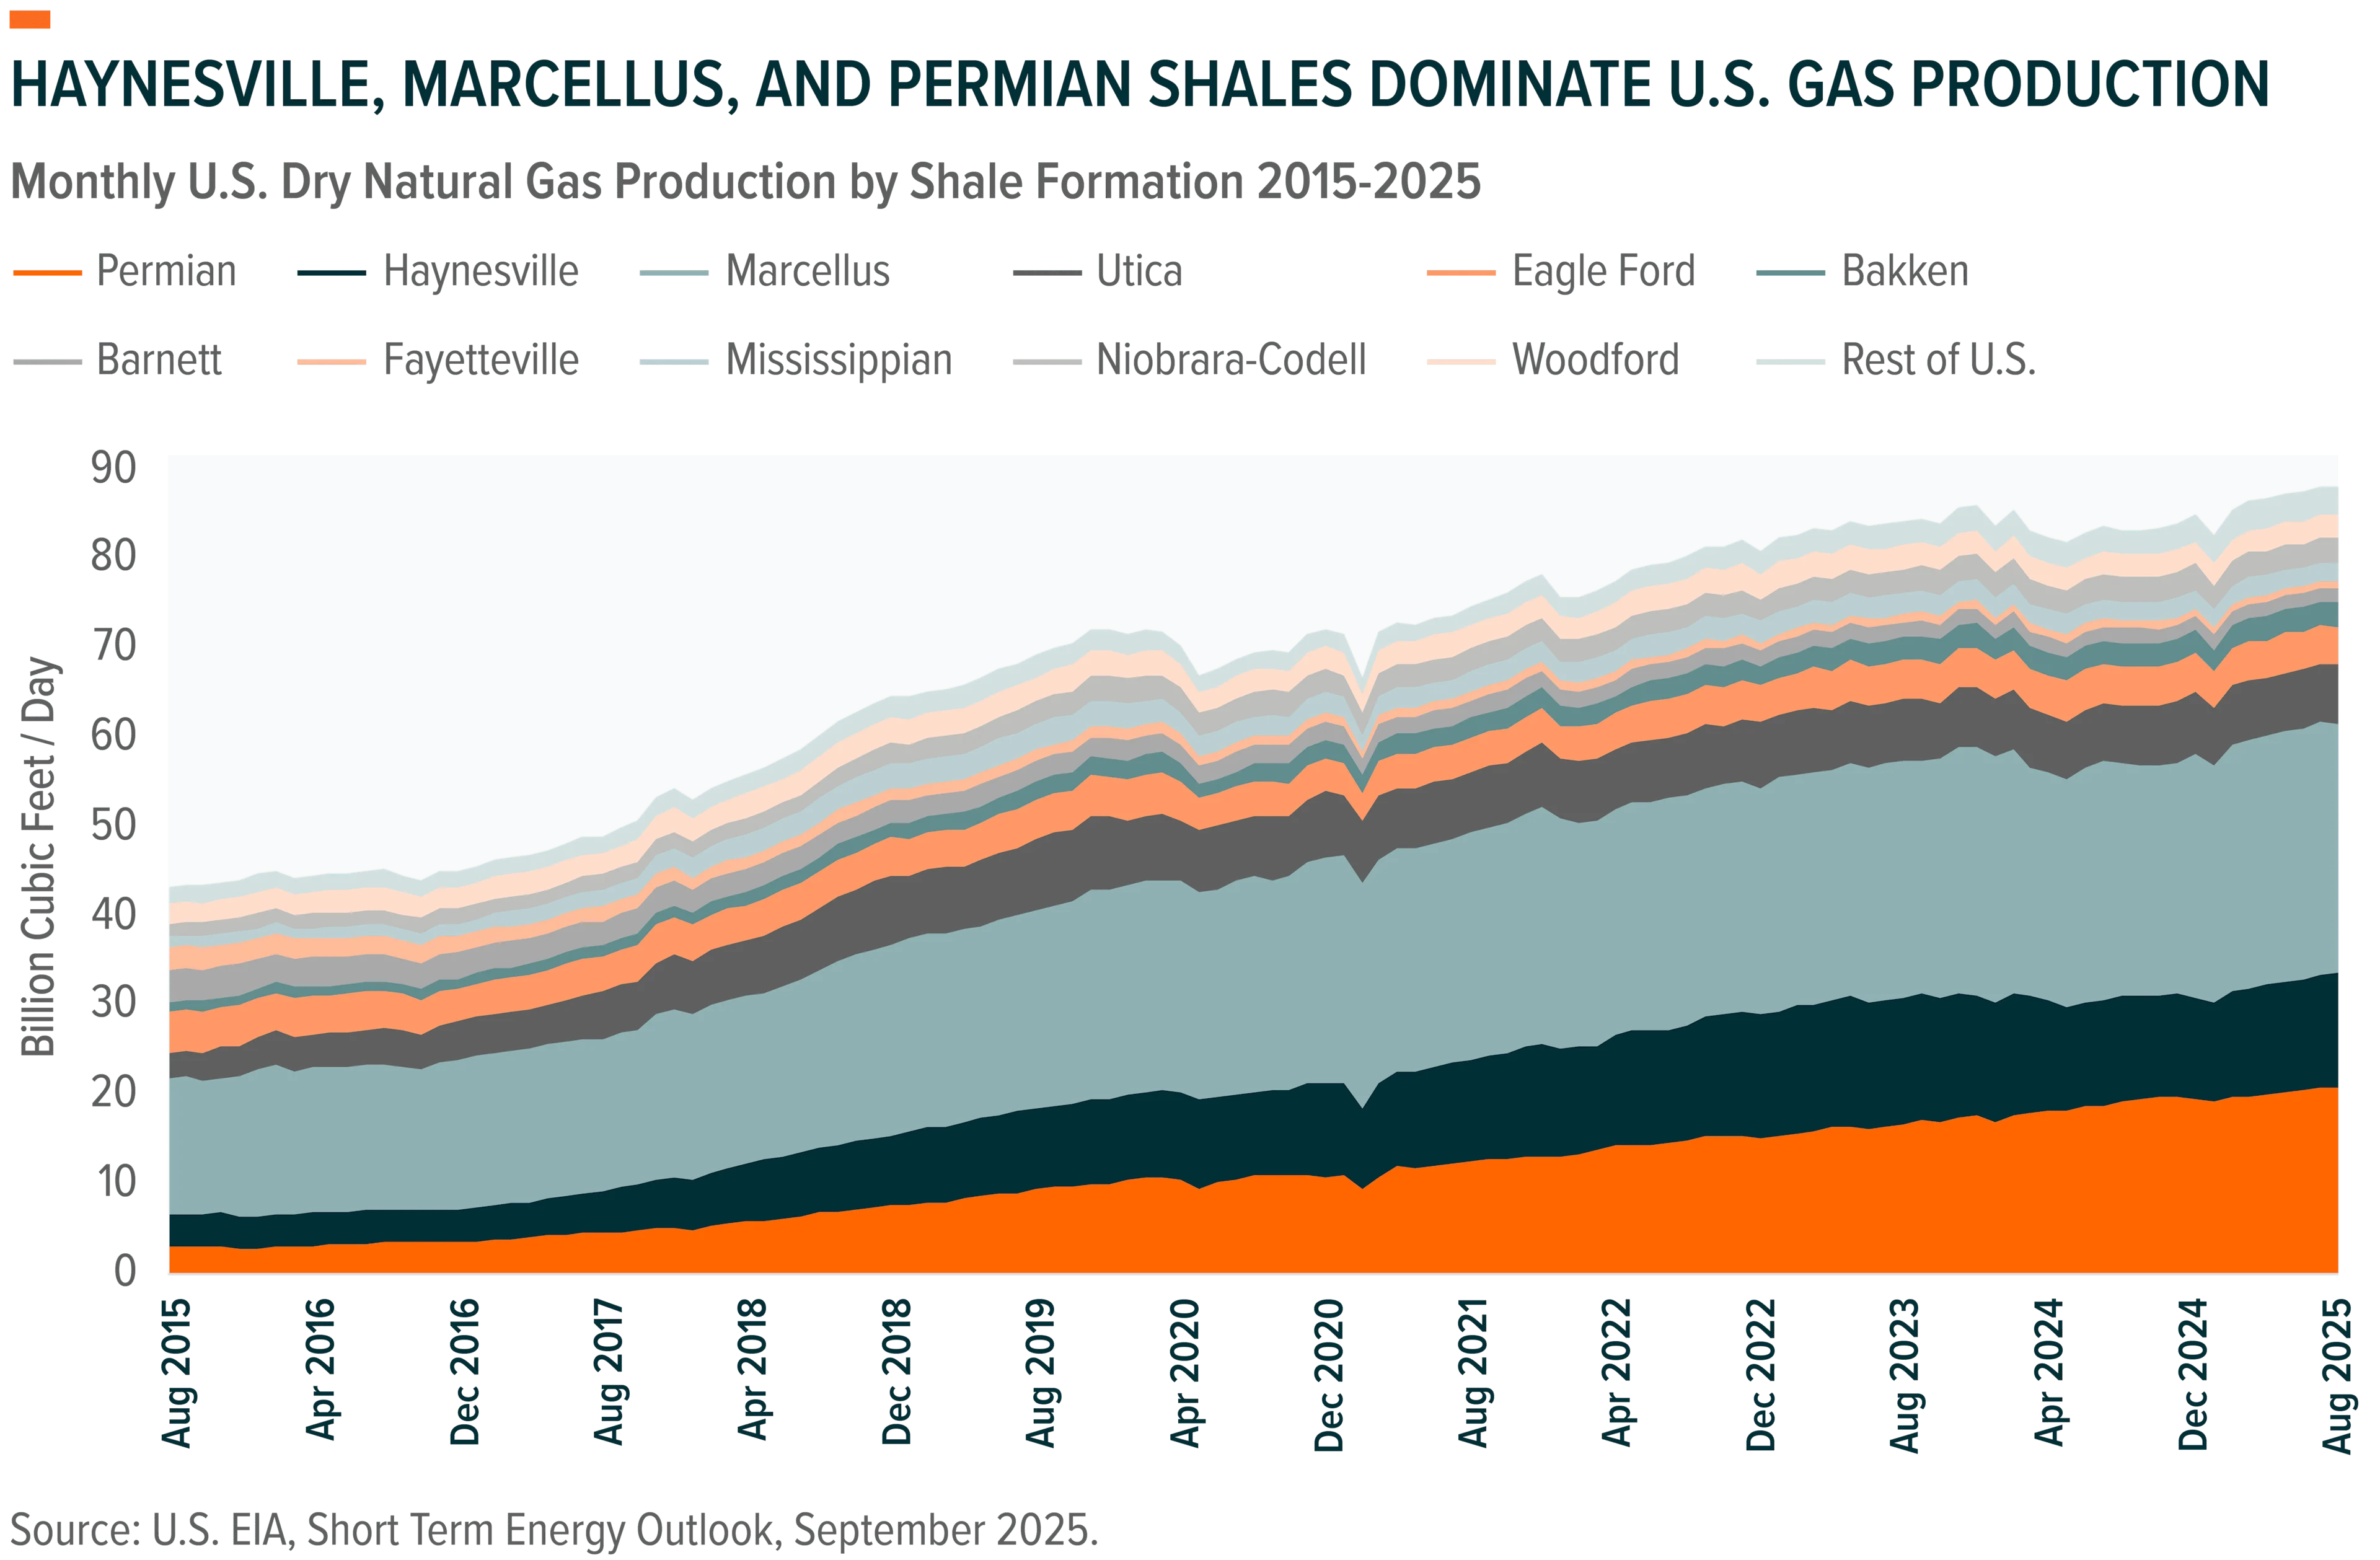
U.S. natural gas production benefits from an abundance of domestic supply, rising demand growth, and a network of natural gas pipelines that enable efficient offtake to demand centers. The United States is home to some of the most prolific shale gas basins in the world, including the Haynesville, Marcellus, and Permian Shales; such shale basins account for nearly 69% of the gas production within the United States, and produced as much as 103.2 bcf/d gas in 2024, more than enough to feed domestic demand.19
The Haynesville Shale in Northwest Louisiana benefits from export demand, given its proximity and midstream connections to the gulf coast. Demand for LNG is expected to drive production growth in Haynesville, following terminal expansions at the Golden Pass and Plaquemines LNG facilities in 2025, which could add as much as 5 bcf/d of incremental capacity by late 2026.20 The Marcellus Shale in Western Pennsylvania is located close to demand sources in the Northeast and is well positioned to supply gas to Northern Virginia, the proclaimed “data center capital of the world.” PJM, the region’s main power utility, expects winter-peak power demand in the region to rise from 136 GW in 2024 to over 200 GW by the end of the 2030s, fueled by data center expansions.21
Upstream drilling activity is typically price driven, and natural gas producers could benefit should prices increase from rising demand growth. Natural gas prices averaged just $2.21 per million British Thermal Units (mmBtu) in 2024, following a period of high production from associated natural gas (a by-product of oil drilling) and relatively flat demand growth.22 In 2025, natural gas prices are expected to rise again from $3.00 in September 2025 to $4.10 in 2026, thanks to the deployment of LNG export capacity and surprise demand growth linked to AI data center expansions.23
Higher natural gas prices tend to benefit producers, thanks to their ability to raise output, and a period of steadily rising commodity prices could boost upstream valuations. The U.S Energy Information Administration (EIA) projects dry gas production will rise to a record 107.4 bcf/d in 2026 from 103.2 bcf/d in 2024.24 The majority of production growth is expected to come from the Haynesville and Marcellus Shales, which are expected to soar by 41% and 9% respectively, as well as the Permian basin where gas production is expected to rise 21% by 2027, according to projections from Morgan Stanley.25 In our view, this upward price trajectory could be persistent, given the LNG capacity growth that underpin it; this could bring U.S. natural gas prices structurally closer to international price benchmarks as LNG demand overtake domestic household consumption.26
The Midstream Opportunity for U.S. Natural Gas
While the upstream opportunity is rooted in raising production, the opportunity in U.S. midstream is in infrastructure expansion. Midstream refers to the segment of the supply chain that operates energy transmission facilities that connect our shale basins to end-users (homes, businesses, and export markets). It also encompasses the processing, storage, and compression services that prepare it for end markets, which includes the liquefaction process that converts raw natural gas into LNG. Consequently, midstream energy infrastructure is essential to growing upstream production, because it allows for the unloading of gas that has been produced.
The Shale Revolution unlocked vast reserves of natural gas, but until recently, infrastructure constraints kept gas production landlocked, leading to regional supply gluts and the capping of natural gas prices within the U.S. (Unlike crude oil, natural gas is not easily transported and must be pressurized or liquified to move in large quantities across vast distances.) This has historically led to wide price disparities in global gas prices, and this is evidenced in the wide price differentials between U.S. gas benchmark prices and international trading hubs in Europe and Asia.
The tide turned in 2016, when Cheniere Energy’s first shipment from its Sabine Pass terminal departed for foreign shores.27 Since then, millions of tonnes of new capacity have come online as legacy import terminals were converted for export purposes, and new liquefaction trains were constructed to grow export capacity (liquefaction trains are the units that process and liquefy natural gas for export). This is what transformed the United States into the world’s largest gas supplier over the past decade,28 a monumental pivot for the global energy trade. Today, the U.S. is able to capitalize on its ample supply as the world’s largest LNG exporter, while Europe and Asia remain “price-takers,” reliant on imports and compelled to compete for limited LNG cargos.29
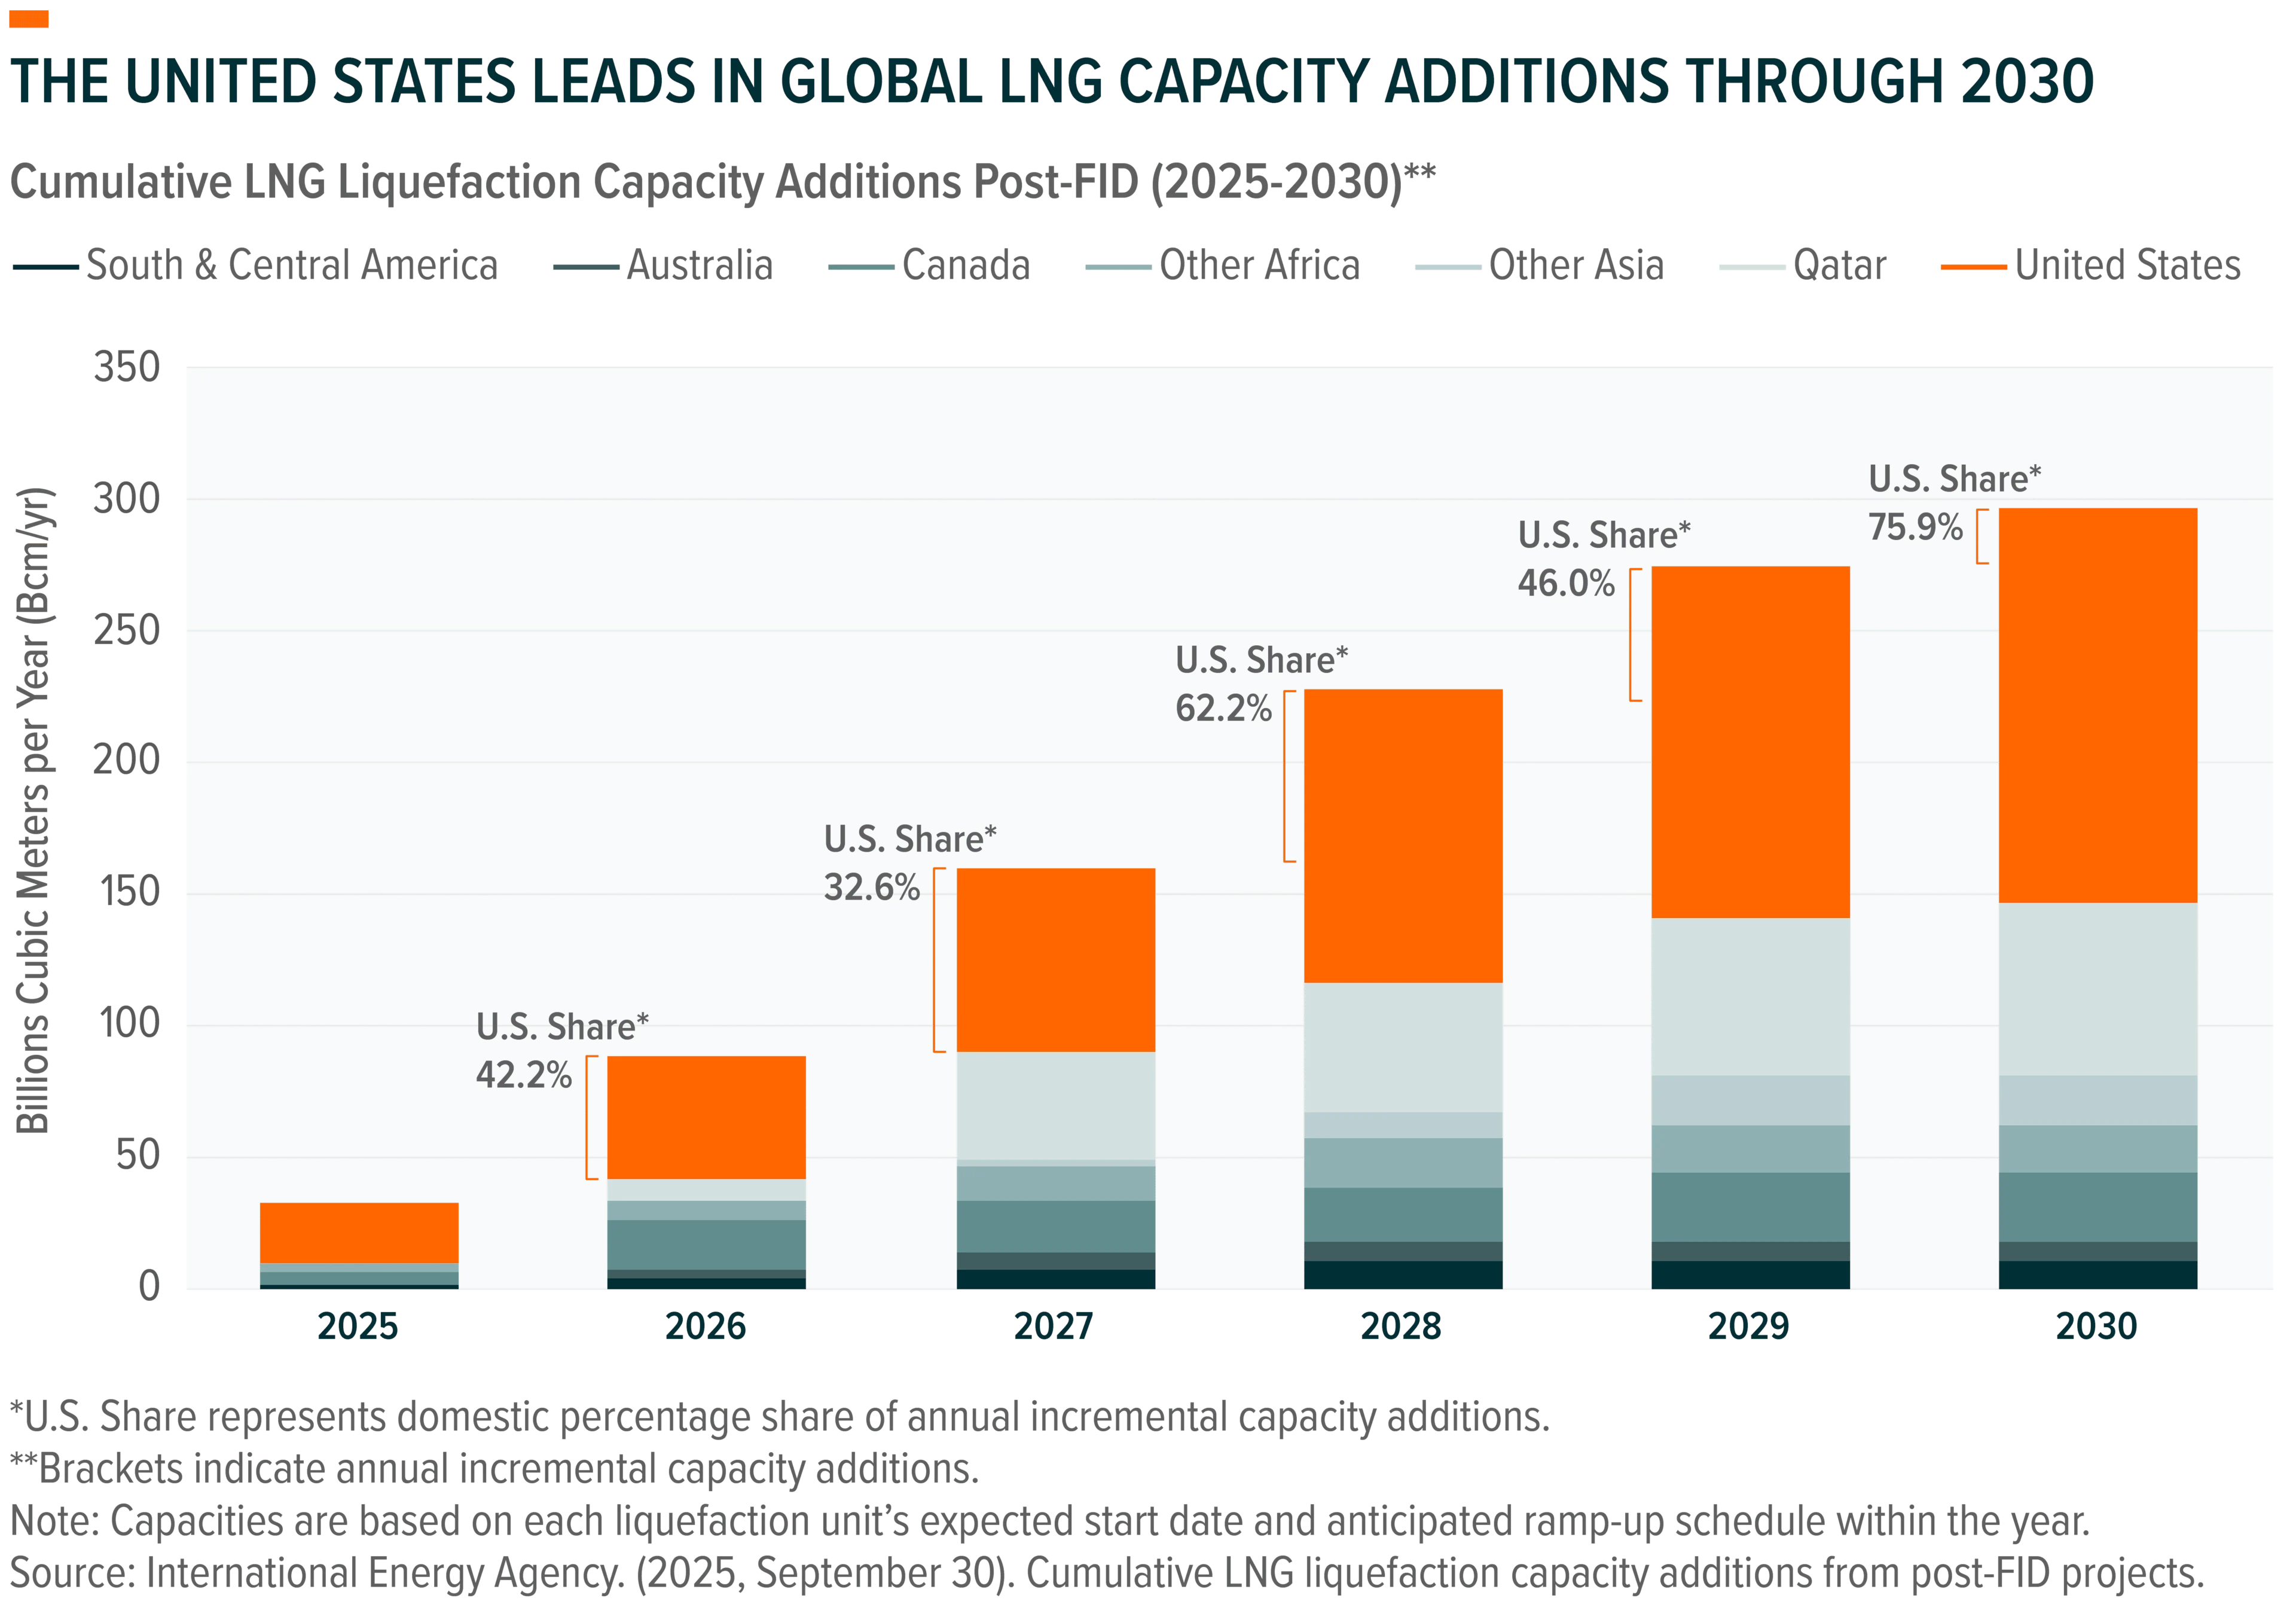
The United States is projected to lead global LNG capacity additions in nearly every year through 2030, accounting for ~48.3% of all liquefaction capacity additions beyond the Final Investment Decision (FID),30 the stage at which firms officially commit to project development. These expansions align with the United States’ supportive energy policy, which lifted the previous administration’s pause on permitting and declared a national energy emergency to accelerate approvals for pending energy infrastructure projects.31 This policy shift has already facilitated the approvals for several major LNG projects in 2025, including Sempra Energy’s Port Arthur Phase 2,32 Commonwealth LNG,33 Golden Pass LNG,34 and a 13% capacity expansion at Venture Global’s Plaquemines LNG.35
Looking ahead, the continued expansion of LNG export capacity could more closely integrate U.S. natural gas supplies with global markets, providing strong incentives and a clear roadmap for domestic producers to raise output. In our view, this creates an opportunity across the U.S. natural gas value chain where, as midstream export infrastructure expands, upstream production can scale and both segments stand to benefit from the world’s growing demand for LNG.
LNGX: Focuses on the U.S. Natural Gas Supply Chain
The Global X U.S. Natural Gas ETF (LNGX) is an index-based passive ETF that invests in U.S. listed and domiciled upstream and midstream companies that derive at least 50% of their total proved reserves (for upstream) or revenues (for midstream) from natural gas and natural gas liquids (NGLs), based on the definitions below.
The Global X U.S. Natural Gas Index, which LNGX tracks, employs a modified free-float market cap-weighted approach, which prioritizes upstream producers that hold significant natural gas reserves as a proportion of their proved reserves and includes midstream firms that attribute the majority of their revenues to natural gas and NGLs.
We believe LNGX’s value chain approach grants exposure to natural gas producers, transporters, and exporters, that allow investors to express a view on the structural growth themes underpinning expansion in this space. Its pure-play focus offers targeted natural gas exposure while limiting corresponding exposure to oil and refined petroleum businesses. Further, its domestic orientation attempts to isolate the tailwinds driving the U.S. natural gas industry amidst the global “winner-take-all” backdrop.
Conclusion
The U.S. natural gas industry has witnessed a surge in demand driven by a call for LNG by allies overseas and a sudden jump in power consumption which demands multiples of the growth in power generation we’ve seen over previous decades. Such trends present opportunities for all segments of the natural gas supply chain, from our resource-rich shale basins to the industrializing export terminals on our shores, opportunities which we believe are characteristics of America’s exceptional resource base. The Global X U.S. Natural Gas ETF (LNGX) targets these trends by tracking an index of domestic firms with strong ties to the U.S. natural gas industry, while avoiding potentially dilutive exposure in overseas names.
Related ETFs
LNGX – Global X U.S. Natural Gas ETF
Click the fund name above to view current performance and holdings. Holdings are subject to change. Current and future holdings are subject to risk.