Product ResearchCovered CallEquity Income Strategies
The Case for a Systematic Options Rolling Plan
R
Rohan Reddy
May 11, 20236 min read
SEI Investments Distribution Co. (1 Freedom Valley Drive, Oaks, PA, 19456) is the distributor for the Global X Funds.
Check the background of SIDCO and Global X's Registered Representatives on FINRA's BrokerCheck.
Get the latest news and updates from our team.
Robert J. Scrudato
Rohan Reddy
The Global X Income Outlook for Q3 2023 can be viewed here. This report seeks to provide macro-level data and insights across several income-oriented asset classes and strategies.
Last quarter we discussed our thoughts on the potential for a reversal in monetary policy. Since then, the Federal Reserve (Fed) recently announced a pause in interest rate hikes during their June 2023 meeting with the potential for future rate hikes in 2023 should economic conditions and their own data analyses appear prudent to do so.1 Equity markets have experienced positive sentiment but narrow leadership with big tech names is raising concerns about market breadth. We believe call option writing on major equity index exposures for investors can both supplement income and mitigate some of the downside market concerns via the premiums received from call option selling.
US equity markets were resilient in the first half of 2023, primarily led by a few key leaders. This is leaving some investors at a potential crossroads as to where markets will progress from here.
Investors seeking to limit potential market volatility while being offered the chance to obtain a level of upside participation may find that writing equity index call options on a certain percentage of a long portfolio’s assets while holding the securities within that index, sometimes known as a covered call & growth strategy, may look appealing from a total return potential standpoint.
Even as equity markets have trended higher, investors have still sought fully covered, buywrite strategies as a useful strategy due to the potential premiums received.
While we do believe we’re at the tail end of the rate tightening cycle, the economic aftermath is still being felt. Per a recent June report, the Institute for Supply Chain Management (ISM) Manufacturing index recorded its eight consecutive month of contraction.2 Of the five sub-indexes used to calculate Purchasing Manager’s Index (PMI), all of them were in contractionary territory too. However, Real (inflation-adjusted) Gross Domestic Product (GDP) increased with its most recent estimate of 2% outpacing the Philadelphia Fed’s surveyed, Q1 2023 median forecast of just 0.6%.3,4 As we head into Q2 2023 earnings season, the number of S&P 500 companies issuing positive earnings guidance is at its highest level of 45 companies since Q3 of 2021 (56 companies) and potentially signifies the chance of a soft landing.5
Peaking interest rates and recent breakthroughs within artificial intelligence technology were key catalysts for U.S. equity market performance in the first half of the year with S&P 500 total returns of 16.89% and 39.35% for the Nasdaq 100 index.6 Driven by large multi-national firms, the top 10 largest constituents within the S&P 500 (SPX) and Nasdaq 100 (NDX) drove 73% and 80% of YTD returns, respectively.7 Depicting a similar story, quarterly return spreads between these traditionally, market-cap weighted indices to their equal-weighted index counterparts have been at their highest levels over the last decade. This has driven a level of concerns as to the sustainability of equity market outperformance for the rest of 2023.
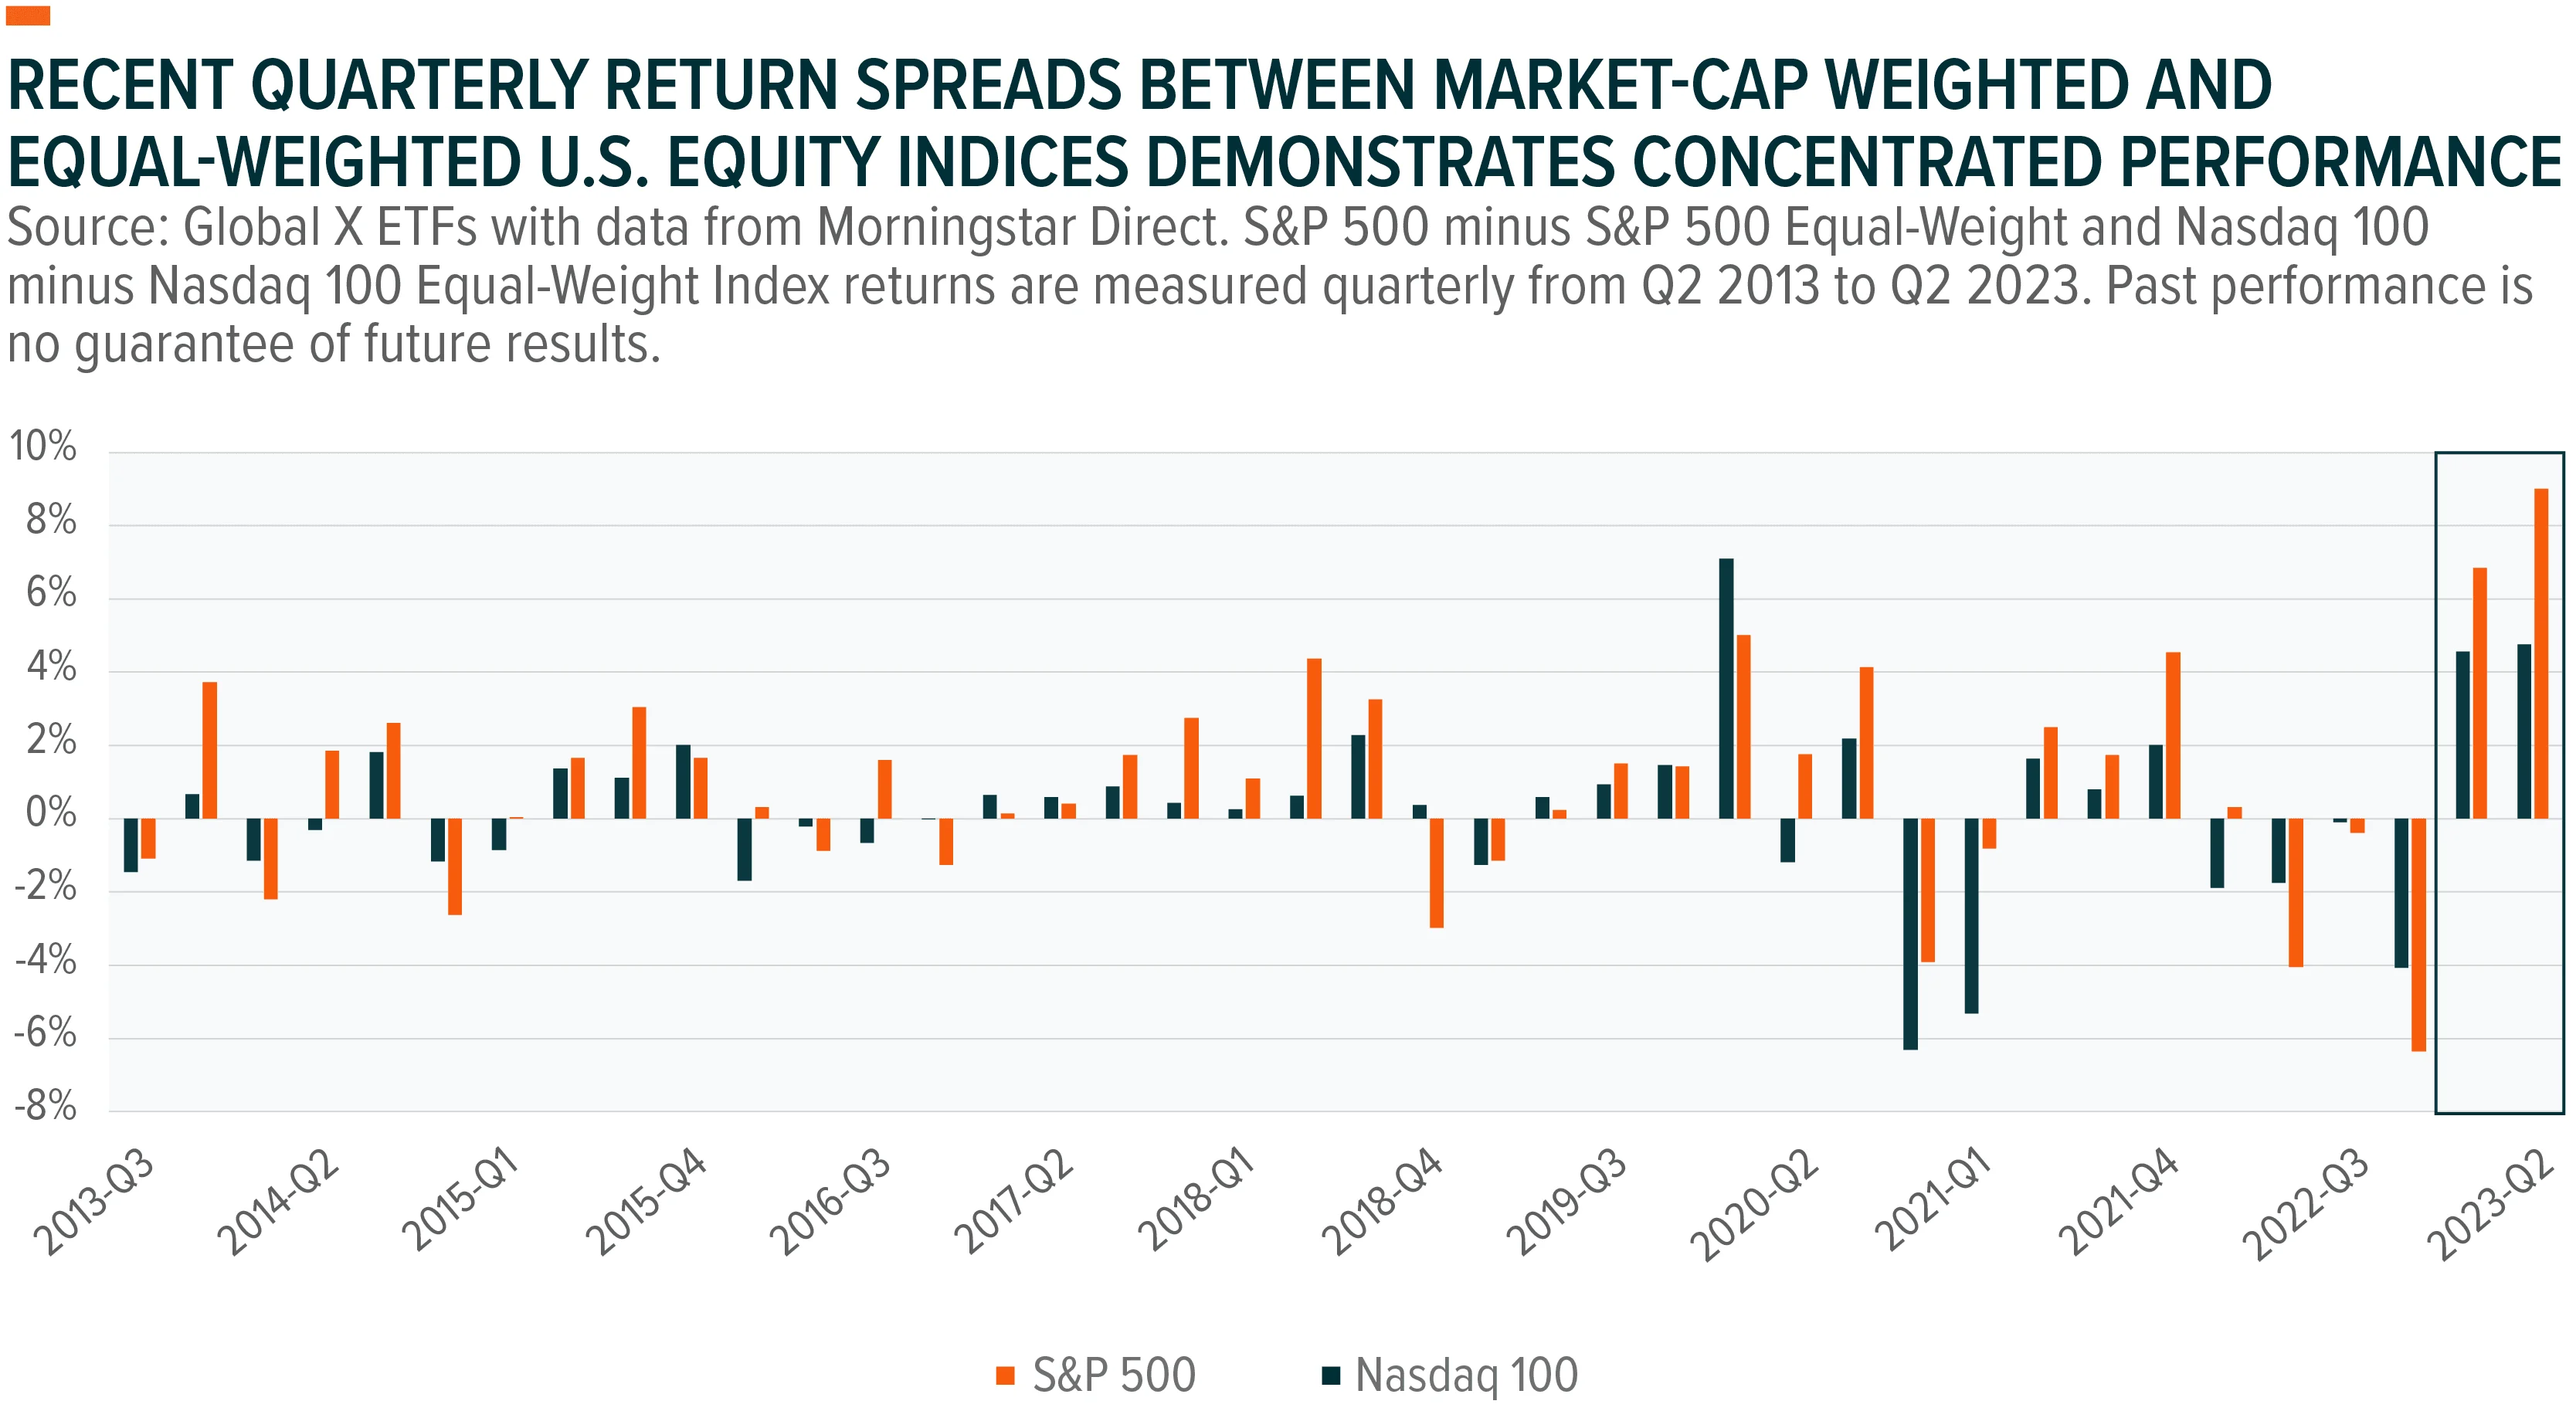
Going into the second half of 2023, investors may want to take a more balanced approach to equity income portfolios as uncertainties rise. Companies that distribute high dividends or have proven dividend growth over a pre-determined, trailing timeframe appear attractive but also tilt away from growth-style equity sectors such as technology, a key sector that has driven year-to-date returns.

One alternative may be a buywrite strategy that seeks to write call options on half of a portfolio it already maintains long exposure to, also known as a covered call & growth strategy. The primary intention of such a strategy is to provide both option premium distributions and hedging properties while simultaneously offering upside potential on specified reference asset or index. For example, Global X’s flagship covered call & growth strategies, QYLG and XYLG, write “at-the-money” (ATM) covered calls on 50% of their respective portfolio’s assets while leaving the remaining 50% of the portfolio uncovered. Therefore, these strategies have the potential to achieve half of the upside of well-known equity indices, the Nasdaq 100 (for QYLG) and the S&P 500 (for XYLG) with attractive distribution rate potential while maintaining a level of exposure to sectors that are typically not found within high dividend screening strategies.
If broader U.S. equity markets continue to trend upward, strategies like these would be expected to maintain 50% of their reference index upside plus any collected premiums from their call writing strategy. QYLG and XYLG have also demonstrated lower levels of downside volatility, a measurement of tail risk, than their reference indices and may be able to provide a level of risk management should equity markets reverse course from what we’ve seen over the last 6 months.
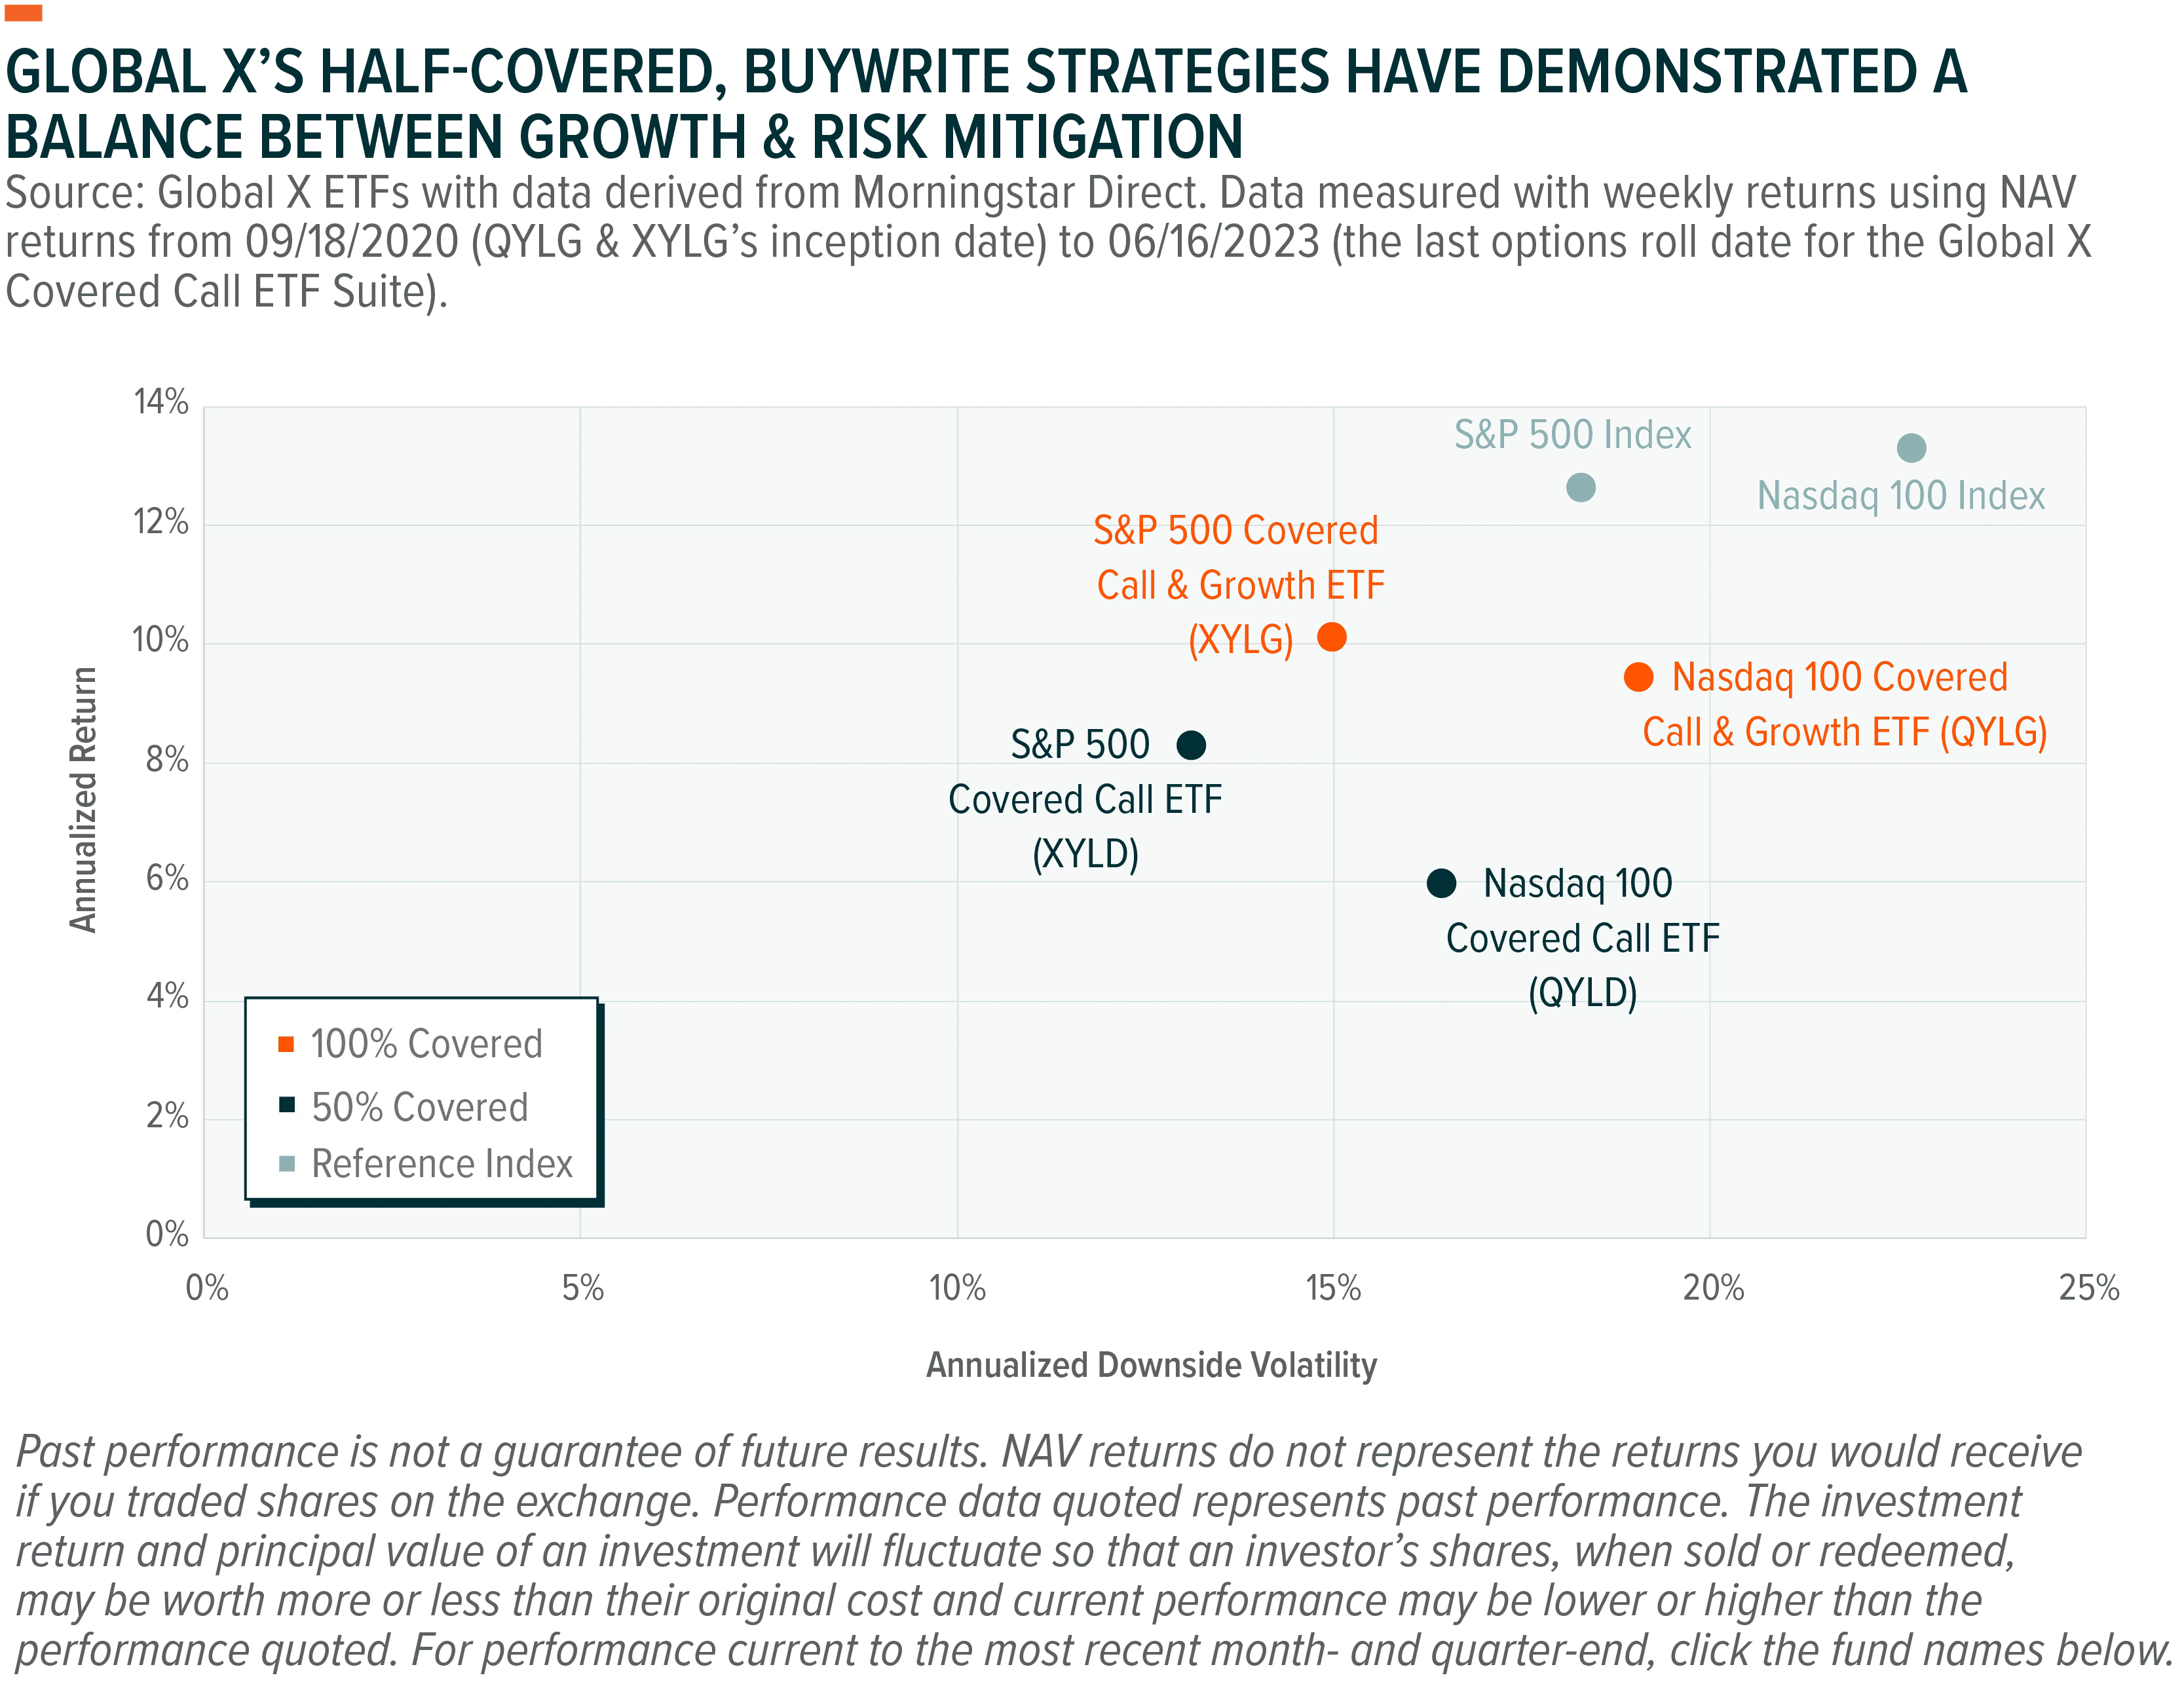
As we covered in our latest covered call commentary, implied volatility, a key determinant of option premiums, has been on a decline this year. While this has resulted in lower premiums received, by writing calls ATM on 100% of their long portfolios, strategies such as QYLD (Nasdaq 100), XYLD (S&P 500), DJIA (Dow Jones Industrial Average), and RYLD (Russell 2000) are able to achieve elevated premium potential relative to a covered call & growth strategy on the same reference indices.
Covered call strategies typically generate a large portion of their returns from sources that are not associated with traditional income-oriented investments such as fixed income securities, whose income is mainly determined by the level of interest rates, and dividend equities, whose income is affected by the financial health of the company issuing the stock. On the other hand, option premiums have historically been largely explained by the underlying asset’s level of implied volatility.
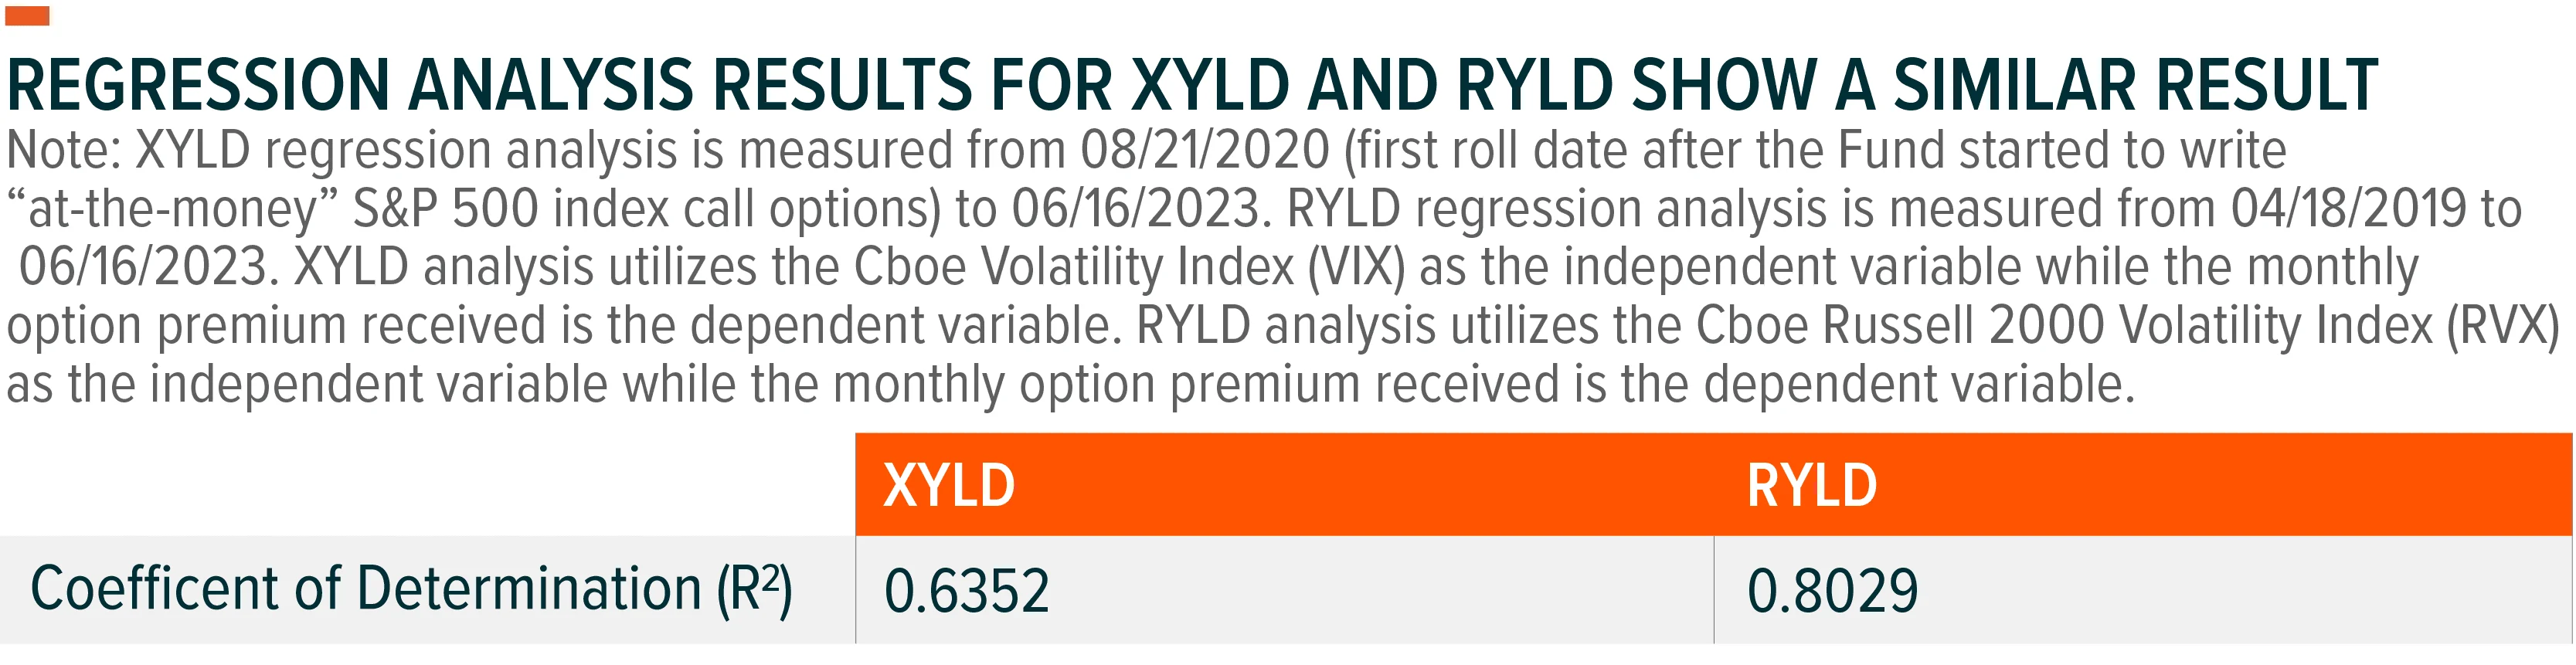
Utilizing a linear regression analysis, a statistical model used to explain the relationship between two variables, we can see this connection between QYLD’s premiums and Nasdaq 100 implied volatility from the computed coefficient of determination (R2). This predictive power of an index’s implied volatility is visualized further by the line of “best fit”, modeled from the equation stated within the graph.

We found significant R2 for XYLD (0.6352) and RYLD (0.8029) when conducting similar regression analyses, demonstrating implied volatility’s importance in options pricing across 3 different indices. This dynamic generally occurs since implied volatility itself is a forward looking metric calculated based on the marketplace’s demand for options. Therefore, as this demand increases, so should option premiums.
Buywrite fund flow momentum has been strong with net flows of $16.45B year-to-date. We believe this is primarily due to premium return potential, but risk reduction potential too.8 Writing more call options on a larger percentage of a long portfolio’s assets can increase risk reduction potential, all else equal, since more premiums are expected to be received to offset downside losses. This may make a buywrite strategy that covers 100% of its net assets with covered calls an attractive, complementary strategy to traditional asset allocations as U.S. equities and fixed income appear to be trading with higher correlations than we have seen over the last two decades.

The first half of this year has left some investors surprised as consensus estimates placed a 65% probability of a U.S. recession within the next 12 months, in the early onsets of 2023.9 Economists have since revised these forecasts lower as the U.S. unemployment rate under remains under 4%.10 However, concerns have been raised about equity market breadth and if the ensuing rally can continue moving forward. While we agree there is a potential for an economic soft landing, cautious income investors may find that a covered call & growth strategy as a balanced approached to both potential upside and premium returns can potentially mitigate levels of downside risk. Investors prioritizing premium distributions over total return may find that covered call strategies conducting a call writing strategy on 100% of a portfolio’s assets may appear attractive in the current environment as declining volatility may fuel total returns.
Related ETFs
QYLD - Global X Nasdaq 100 Covered Call ETF
XYLD - Global X S&P 500 Covered Call ETF
RYLD – Global X Russell 2000 Covered Call ETF
DJIA – Global X Dow 30 Covered Call ETF
QYLG - Global X Nasdaq 100 Covered Call & Growth ETF
XYLG - Global X S&P 500 Covered Call & Growth ETF
RYLG – Global X Russell 2000 Covered Call & Growth ETF
DYLG – Global X Dow 30 Covered Call & Growth ETF
TYLG – Global X Information Technology Covered Call & Growth ETF
Click the fund name above to view current performance and holdings. Holdings are subject to change. Current and future holdings are subject to risk.
Timiraos, Nick. (2023, June 15). Fed Holds Rates Steady but Expects More Increases. The Wall Street Journal.
Fiore, T. R., CPSM, C.P.M. (2023, July). Manufacturing PMI® at 46%. Institute for Supply Management.
Bureau of Economic Analysis. (2023, June). Gross Domestic Product, Third Estimate, Corporate Profits, Revised Estimate, and GDP by Industry, First Quarter 2023.
Federal Reserve Bank of Philadelphia. (2023, February). Survey of Professional Forecasters, First Quarter 2023.
Butters, John. FactSet Research Systems Inc. (2023, July 7). Earnings Insight: Q2 2023. FactSet Insight.
Global X ETFs with data from Morningstar Direct. Return data is measured from 01/01/2023 to 06/30/2023 and accessed on July 5th, 2023 from Global X’s Morningstar Direct License.
Ibid.
Global X ETFs with data from Morningstar Direct. Fund classifications are based on U.S. registered ETFs and are maintained by Global X ETFs. Data was as of 06/30/2023 and accessed on July 5th, 2023 from Global X’s Morningstar Direct License.
Hatzius, J., Mericle, D., & Phillips, A. (2023, January 20). Why the US Can Avoid a Recession in 2023. Goldman Sachs.
U.S. Bureau of Labor Statistics, Unemployment Rate [UNRATE], retrieved from FRED, Federal Reserve Bank of St. Louis. Monthly data, measured as of 5/2023.
Options can be effective tools for investors, but they can also be complex. The ETF structure may be able to simplify the process.
Options can be effective tools for investors, but they can also be complex. The ETF structure may be able to simplify the process.
Our covered call funds seek to offer alternate sources of income, with different risk/return characteristics. Here, we discuss recent developments.
Our covered call funds seek to offer alternate sources of income, with different risk/return characteristics. Here, we discuss recent developments.