


Product ResearchOptionsEquity Income Strategies
Introducing the Russell 2000 Covered Call ETF (RYLD)
R
Rohan Reddy
Apr 22, 20193 min read
Get the latest news and updates from our team.
Copyright © 2026 Global X. All rights reserved.
SEI Investments Distribution Co. (1 Freedom Valley Drive, Oaks, PA, 19456) is the distributor for the Global X Funds.
Check the background of SIDCO and Global X's Registered Representatives on FINRA's BrokerCheck.
Global X Research
Rohan Reddy
The Russell 2000 Index (RTY) is facing turbulent market conditions in 2022 relative to prior years as financing needs increase, credit spreads widen, and expectations for US economic growth begin subsiding. With inflationary pressures continuing to persist, the Federal Reserve is now well underway in its rate hiking regime, creating headwinds for equity valuations, including small cap companies like those in the Russell 2000. Few strategies thrive in volatile markets like the one witnessed in the first half of 2022, but covered call strategies on the Russell 2000 have proven to be resilient and well-positioned. Expectations for elevated volatility could potentially keep premiums at higher levels received from writing covered calls, relative to historical averages. In this piece, we address how covered call strategies focused on the Russell 2000 could help investors navigate a challenging market environment.
The Russell 2000 has not disappointed this past decade, due to the benefits of a strong domestic economy low interest rates, and conducive financing conditions.
The Russell 2000 is sensitive to cyclicality, and higher inflation can cause the RTY to come under pressure when interest rates rise.
Covered call strategies on the Russell 2000 can help investors generate potential income and monetize volatility in turbulent markets.
The Russell 2000 Index has performed well over the last decade due to the benefits of domestic revenue exposure, a strong dollar, US economic growth, and cheap financing conditions. The index, comprised of 2000 small-cap stocks in the US, has outperformed high growth indices such as the Nasdaq (NDX) year-to-date as of August 15, 2022 by over 650 basis points (bps).1
The outperformance of the Russell 2000 can be attributed to the index’s strong overweight towards value-oriented constituents, helping to alleviate some of the pain felt by sectors with high price multiples such as Information Technology and Communication Services. From start of the year of 2022 to August 4, 2022, the Russell 2000 returned -15.09%, while the Nasdaq returned -18.44%.2
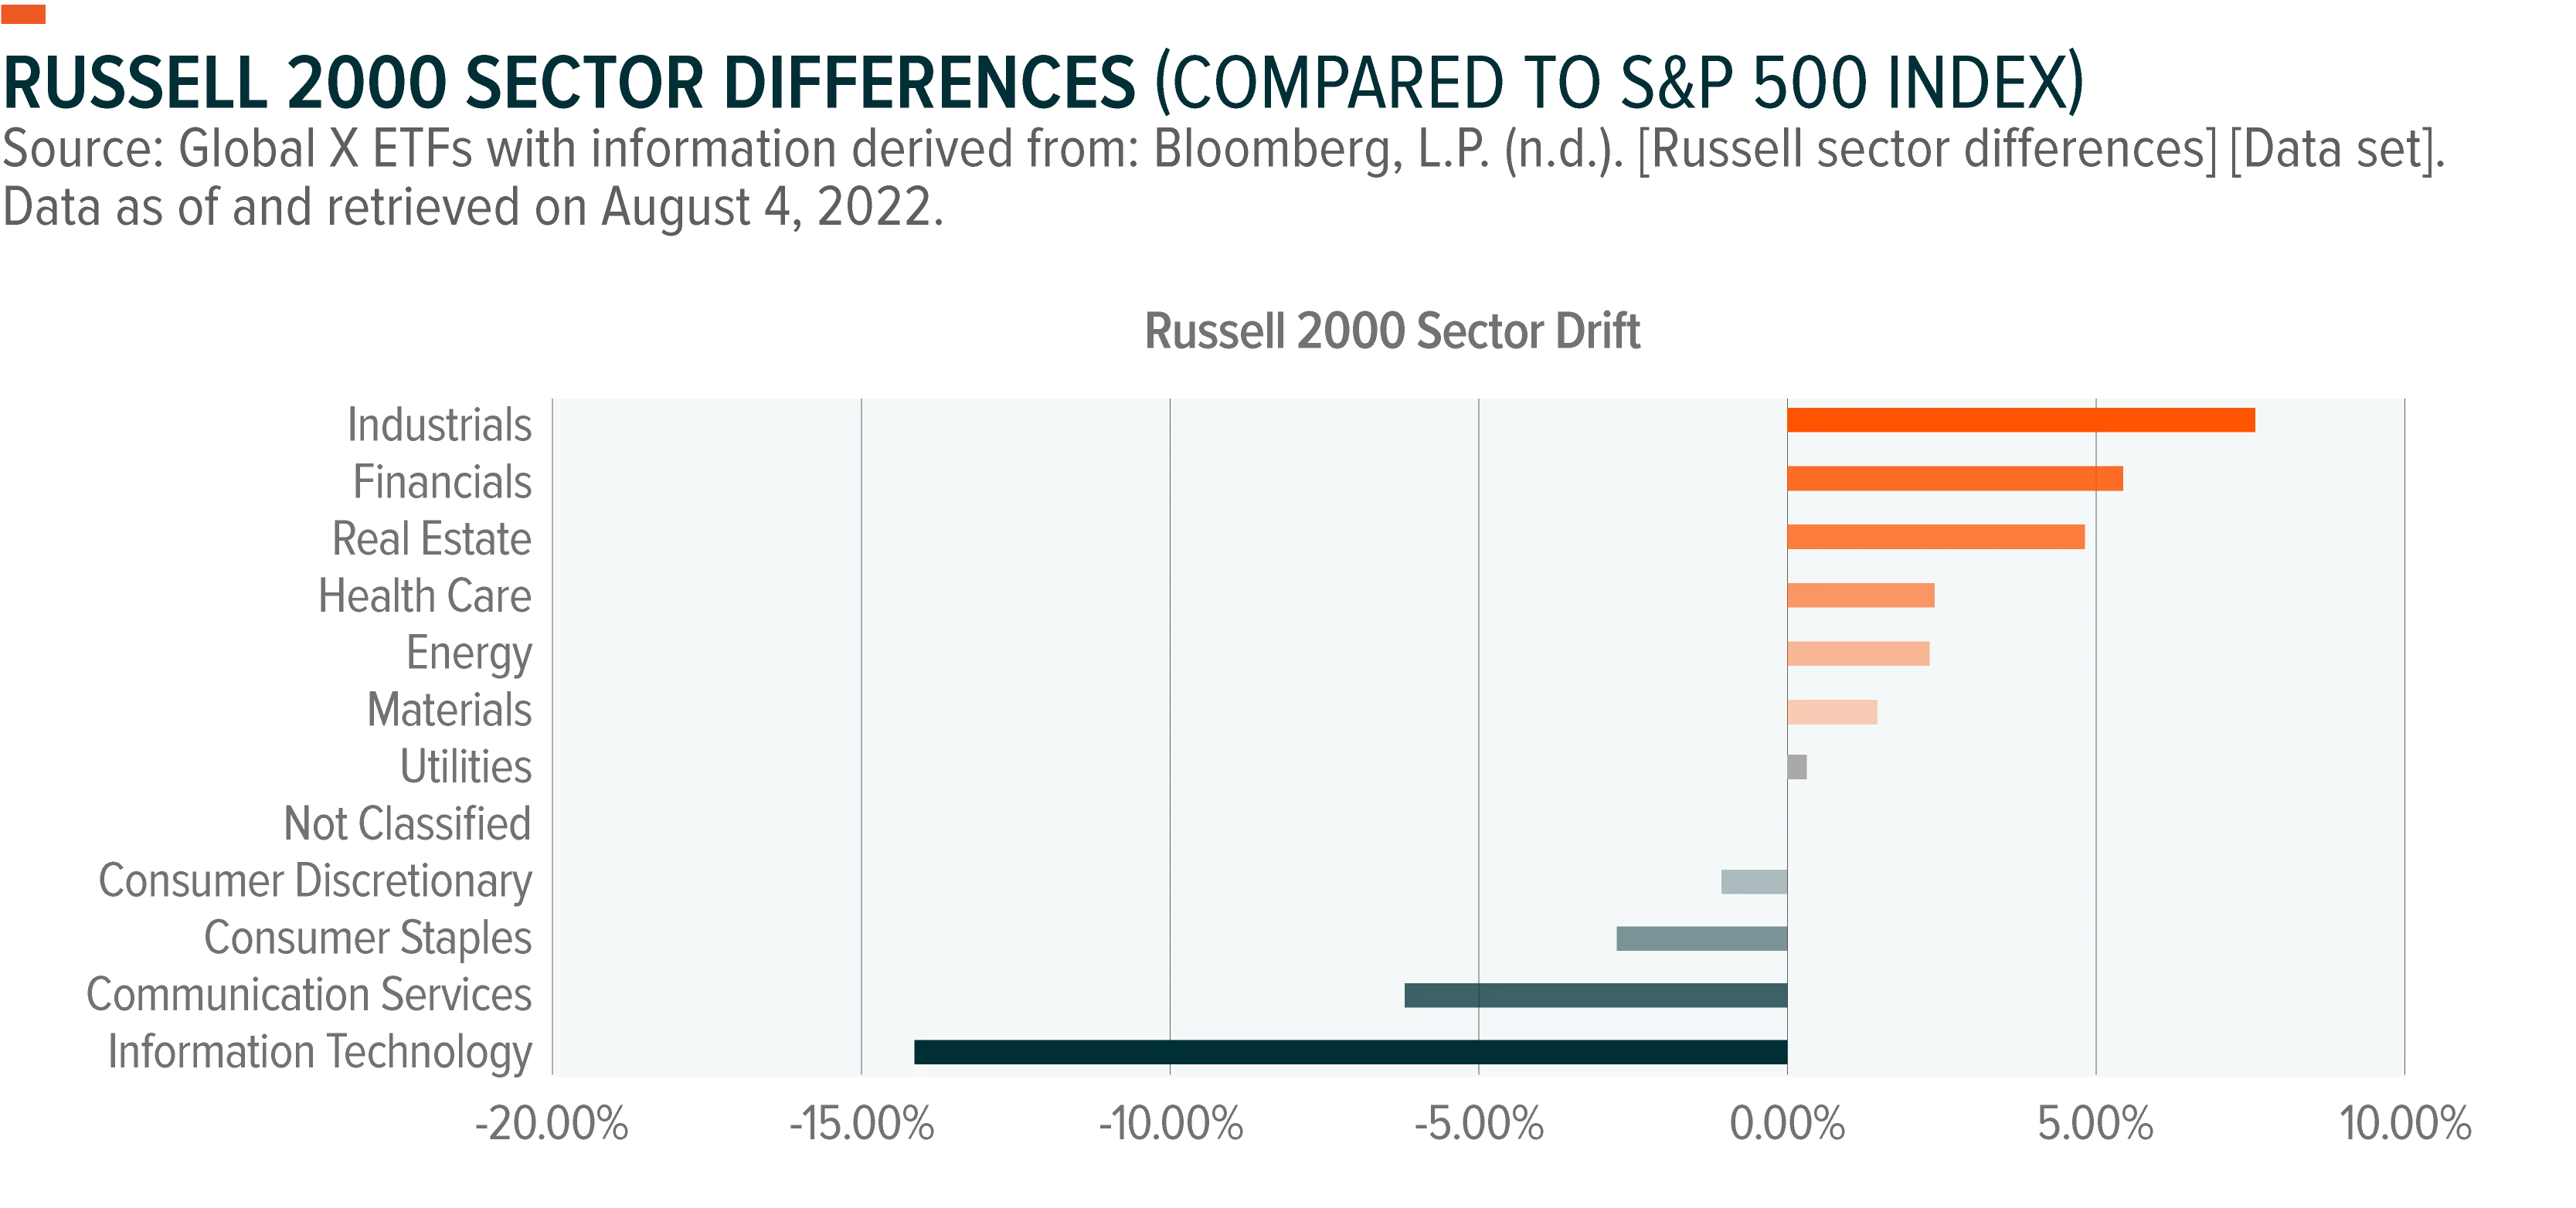
After a period of strong fiscal and monetary stimulus, economic growth has accelerated, accompanied by inflation uncertainty. The MSCI USA Value’s return is -6.68% as of August 10, 2022, compared to MSCI USA Growth of -17.85%.3 Part of the reason for this change has been for the Federal Reserve raising interest rates that have coincided into the re-opening economy. After a period of strong fiscal and monetary stimulus, coupled with accelerating economic growth in the first half of 2022, inflation headwinds have been rising.
From the chart below, we can see that rising rates tends to have a lower impact on returns for value compared to growth. The most recent CPI print of 8.3% in August 2022 for headline inflation was below analysts’ expectations causing growth to rebound compared to value. 4
The Russell 2000 achieves a higher weight towards value compared to the major US broad indices, the pure small cap exposure has increased the overall volatility. This can be attributed to the fact that small cap companies are usually sensitive to rising rates for two main reasons. The first, being small cap companies tend to be considered a riskier investment leading to higher borrowing cost compared to the large cap counterpart. Second, many small cap companies are still in the early growth phase causing a higher need for debt and/or equity financing as they may not be producing sustainable cash flows, leading to a reinforced loop. Like small caps, Growth companies, such as information technology strategies, are often sensitive to interest rates as their valuations are based heavily on expected future cash flows. Higher rates reduce the present value of those distant cash flows. While both segments have been negatively impacted, the valuation unwind associated with growth have been more pronounced compared to small caps, which have valuations that are more heavily based on near-term cash flows.
The revenues generated from the Russell 2000 are more closely tied to U.S. consumption, as such giving investors more correlated exposure towards the U.S. domestic economy. For example, companies in the Russell 2000 have revenues that mostly come from the US with a small percentage coming from international.
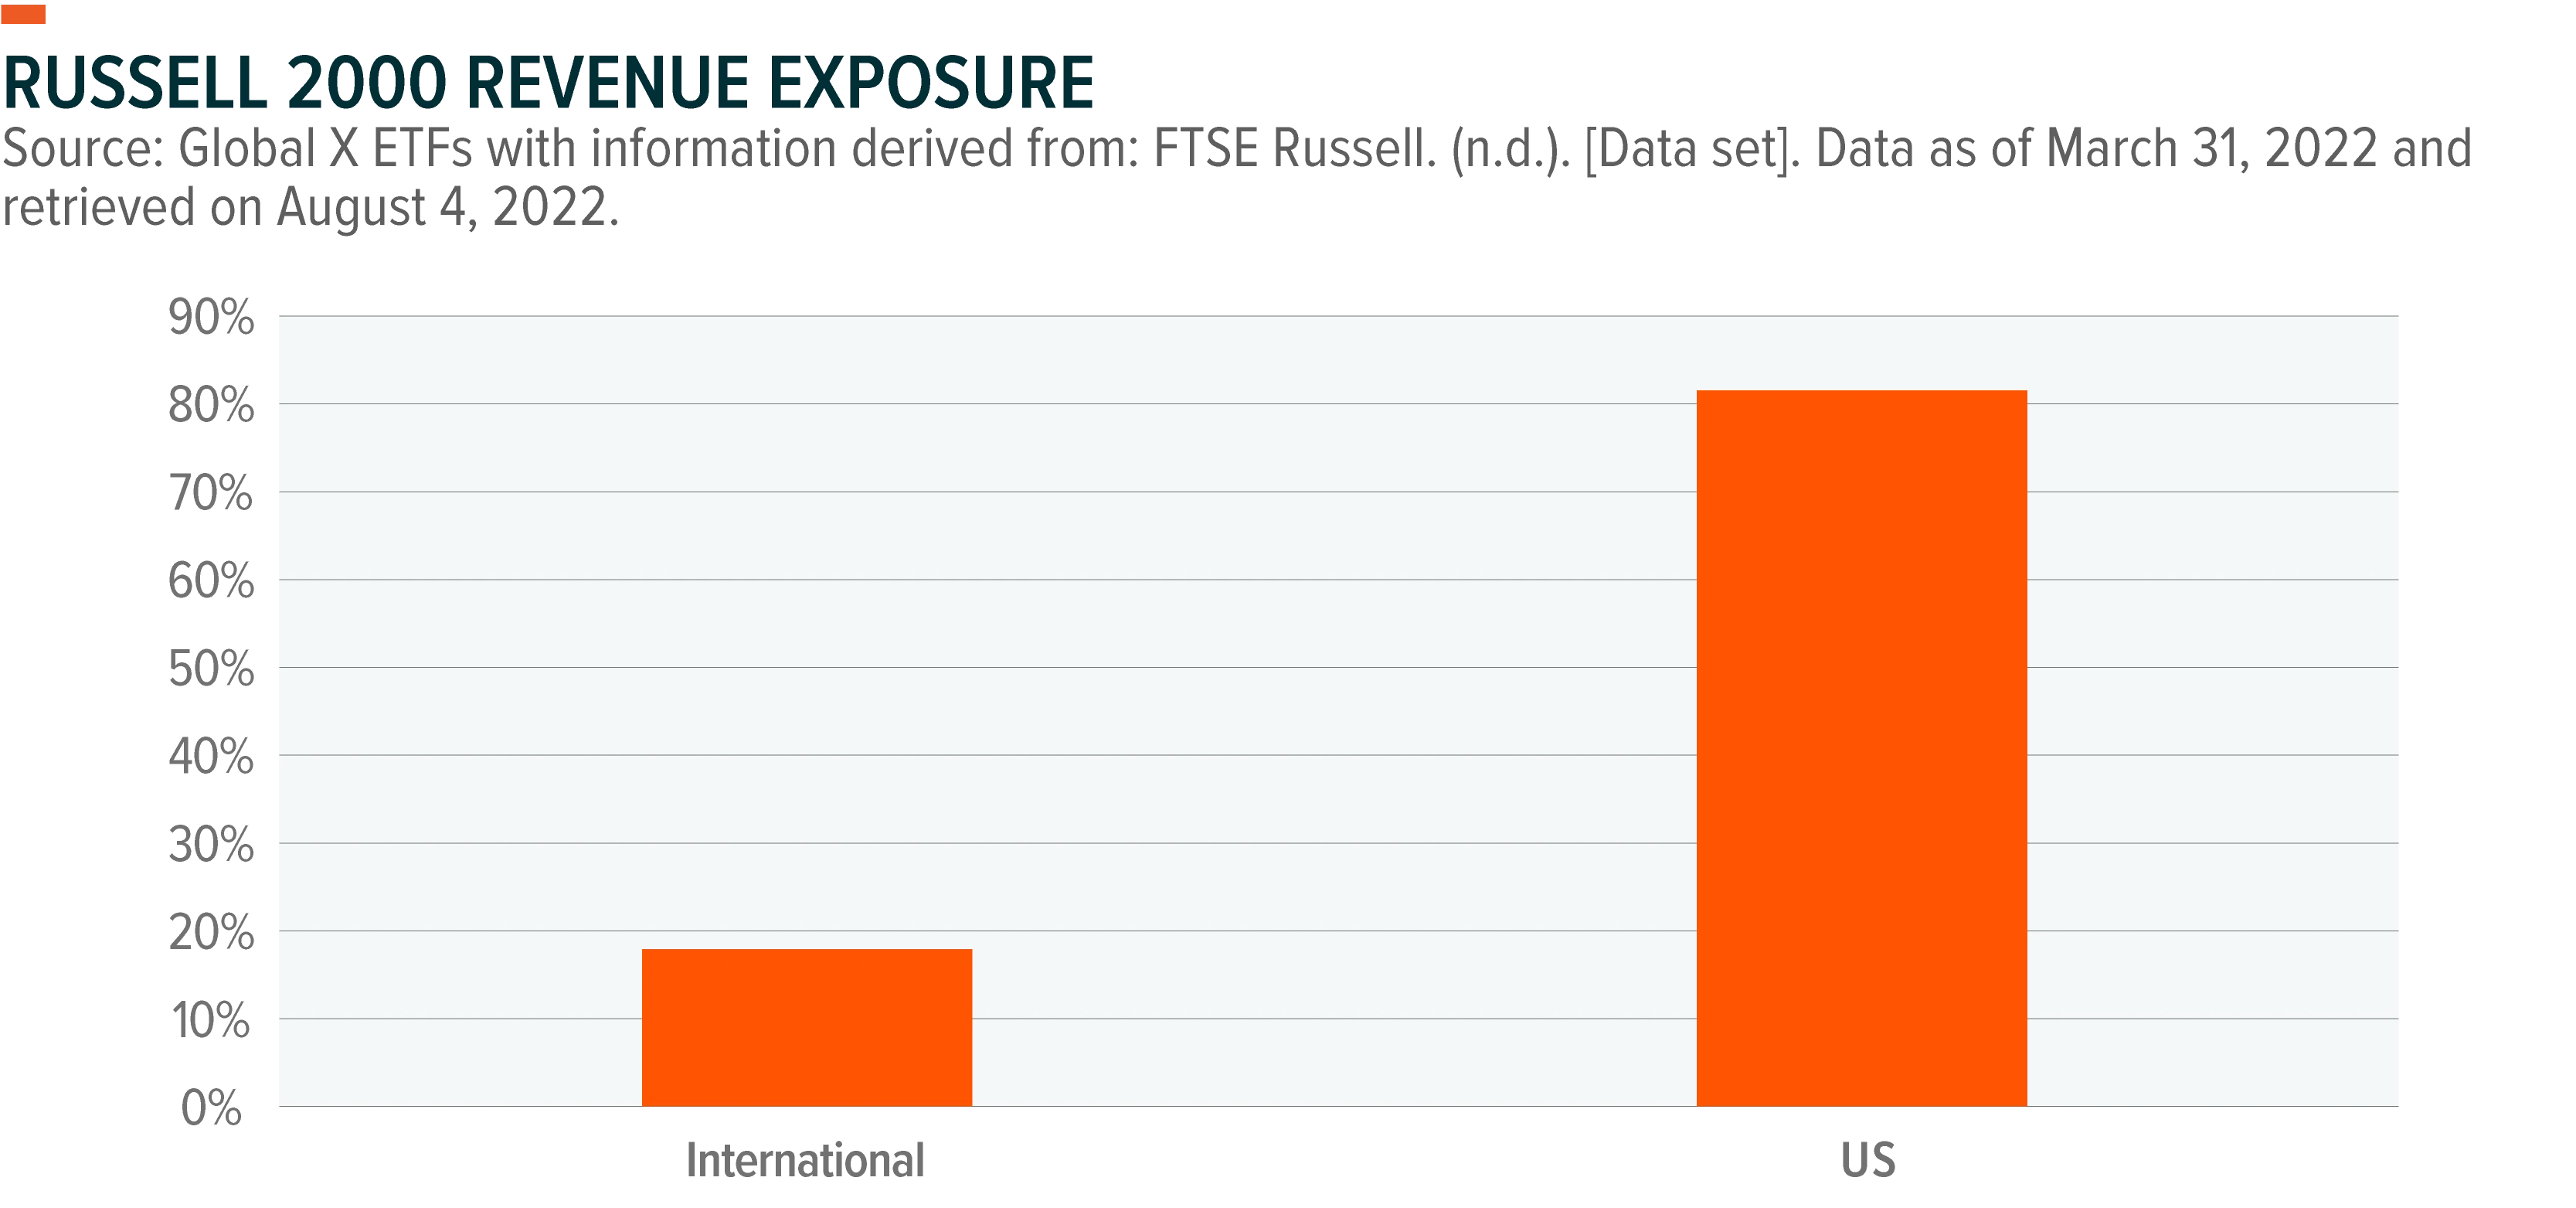
When looking to compare the Russell 2000 and the Russell 1000 indexes, the distinguishing difference between the two is the market cap. The Russell 1000 has an average market cap of $587.5 billion which includes about 1,000 of the largest US equities and represents 93% of the US market. This is in comparison to an average market cap of $3.6 billion in the Russell 2000 which is composed of the 2,000 smallest US equities (FTSE Russell).5
There are many risks that are present in both the US and the global economy as high inflation has affected real income levels of customers which ripples into real economic growth. The fear of lower economic growth has led to increased volatility for the index as interest rates trend upwards.
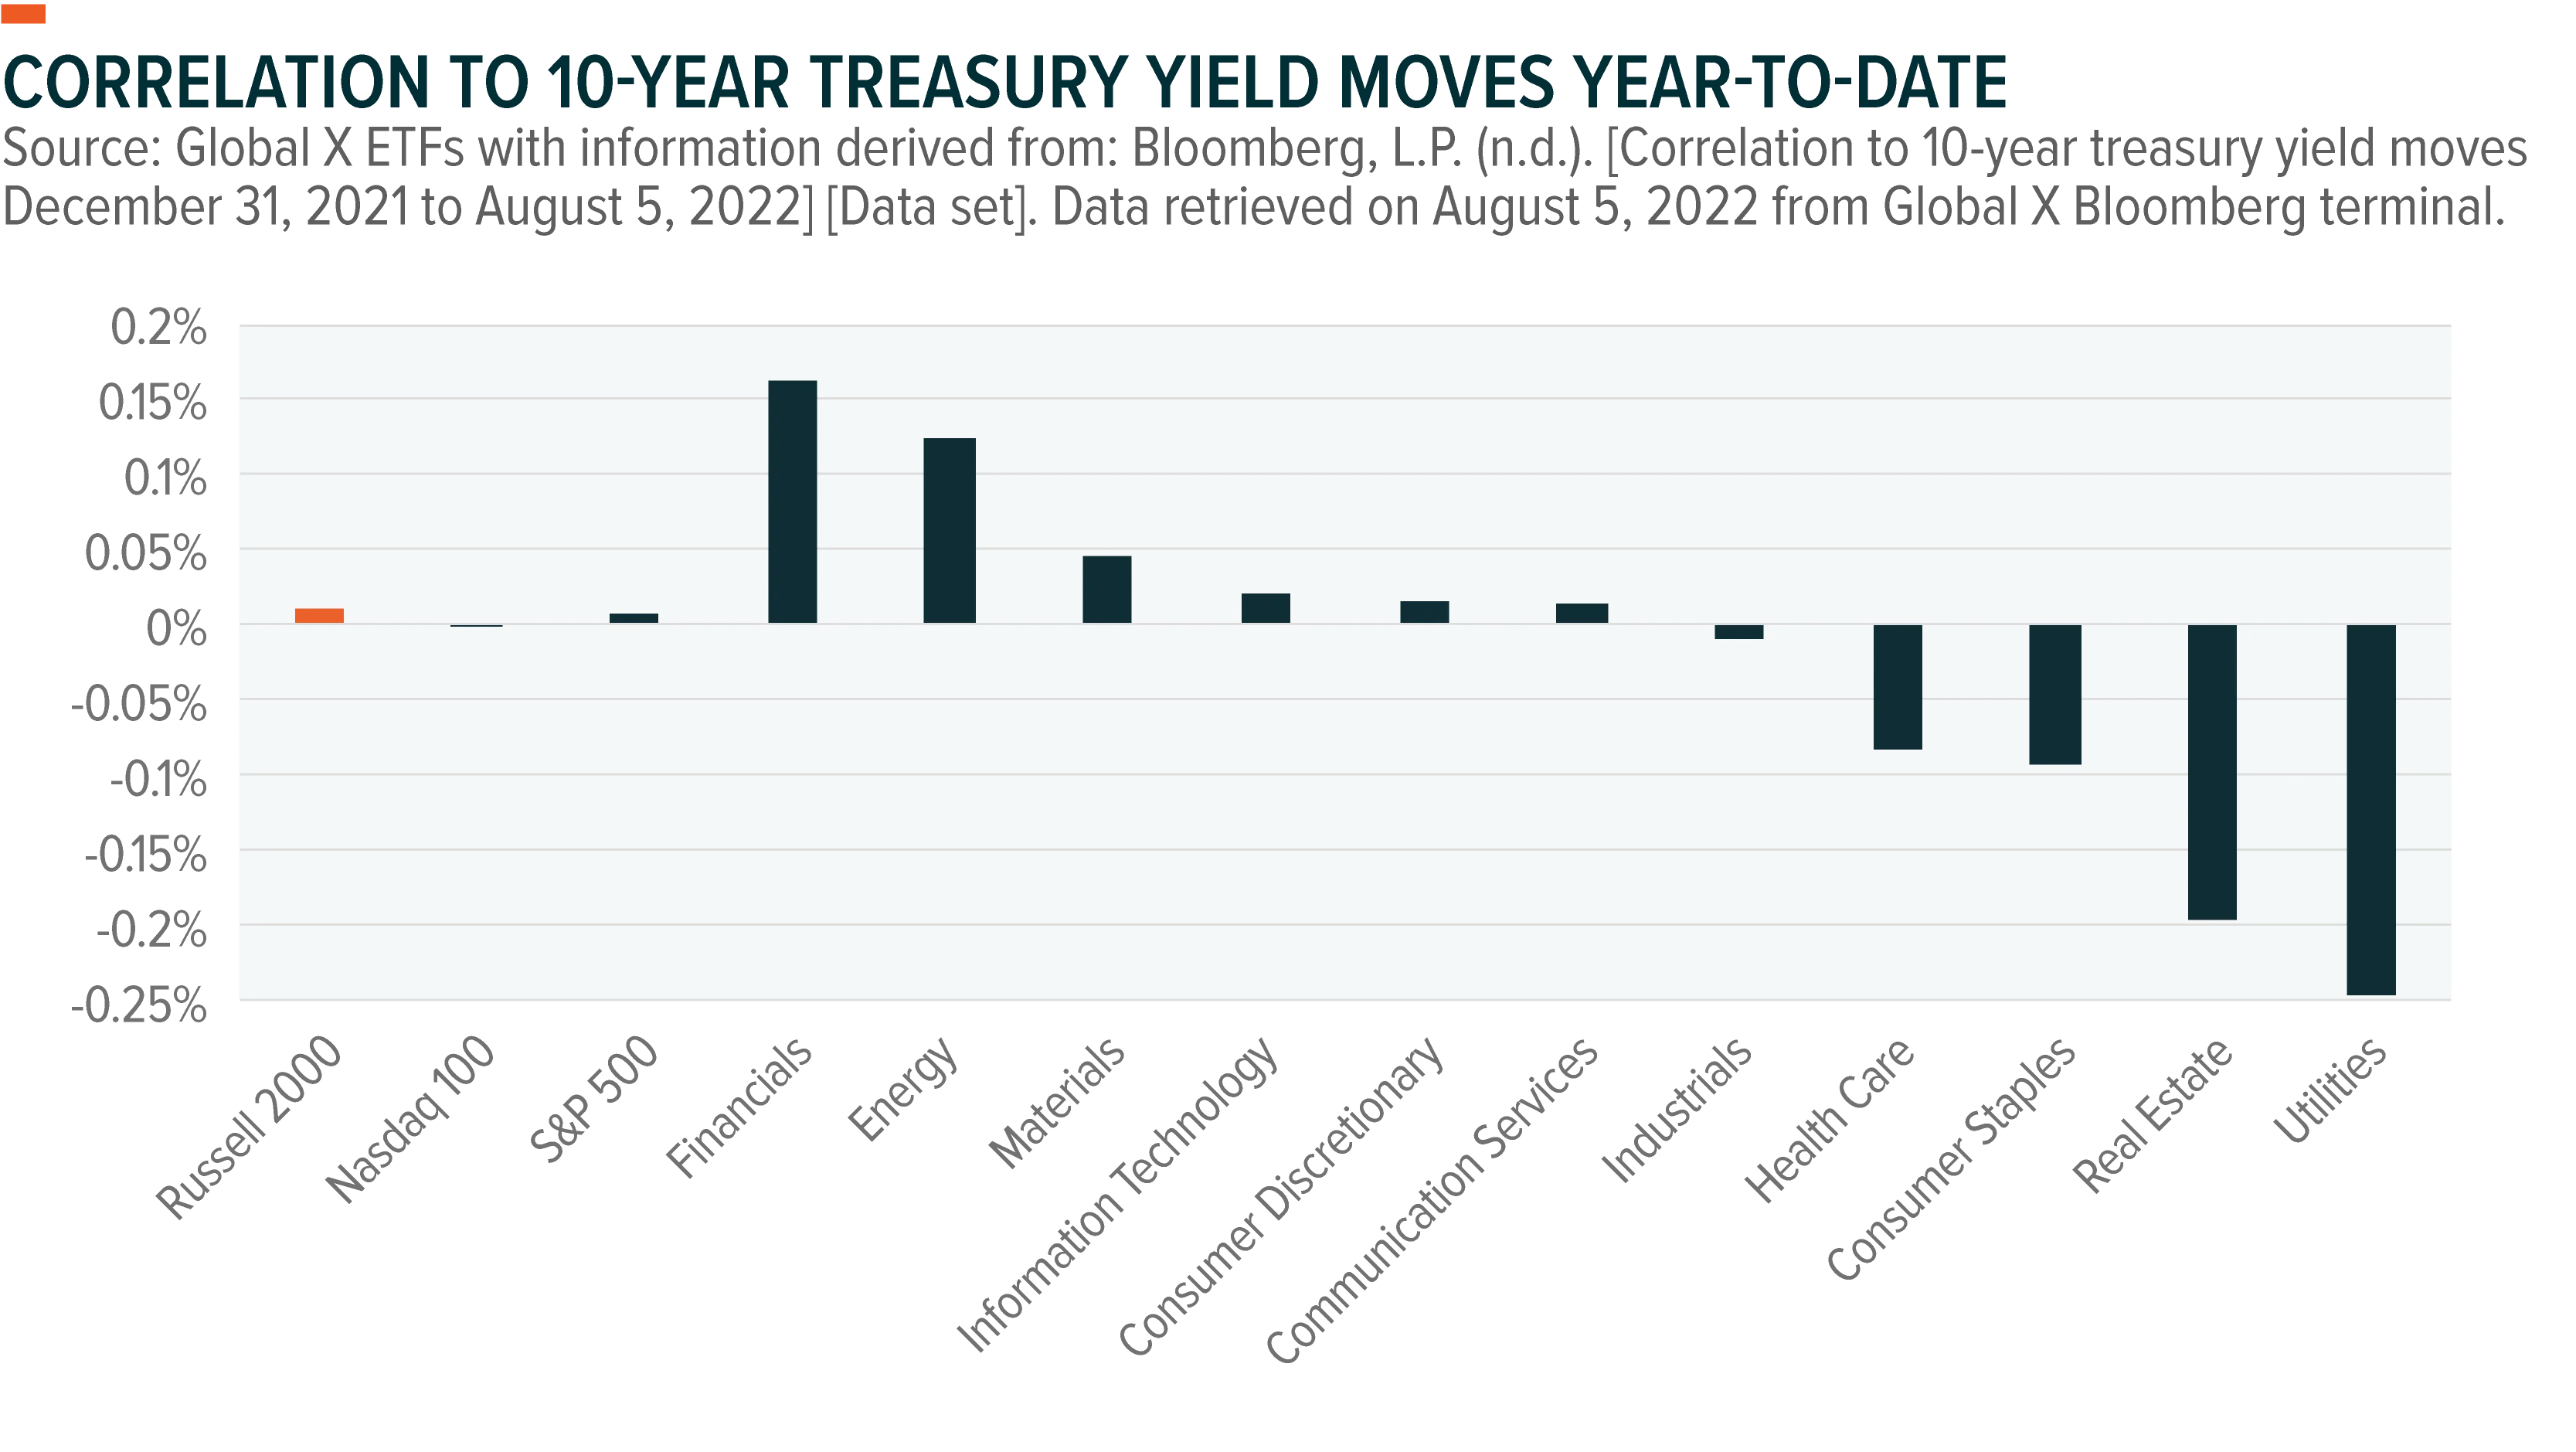
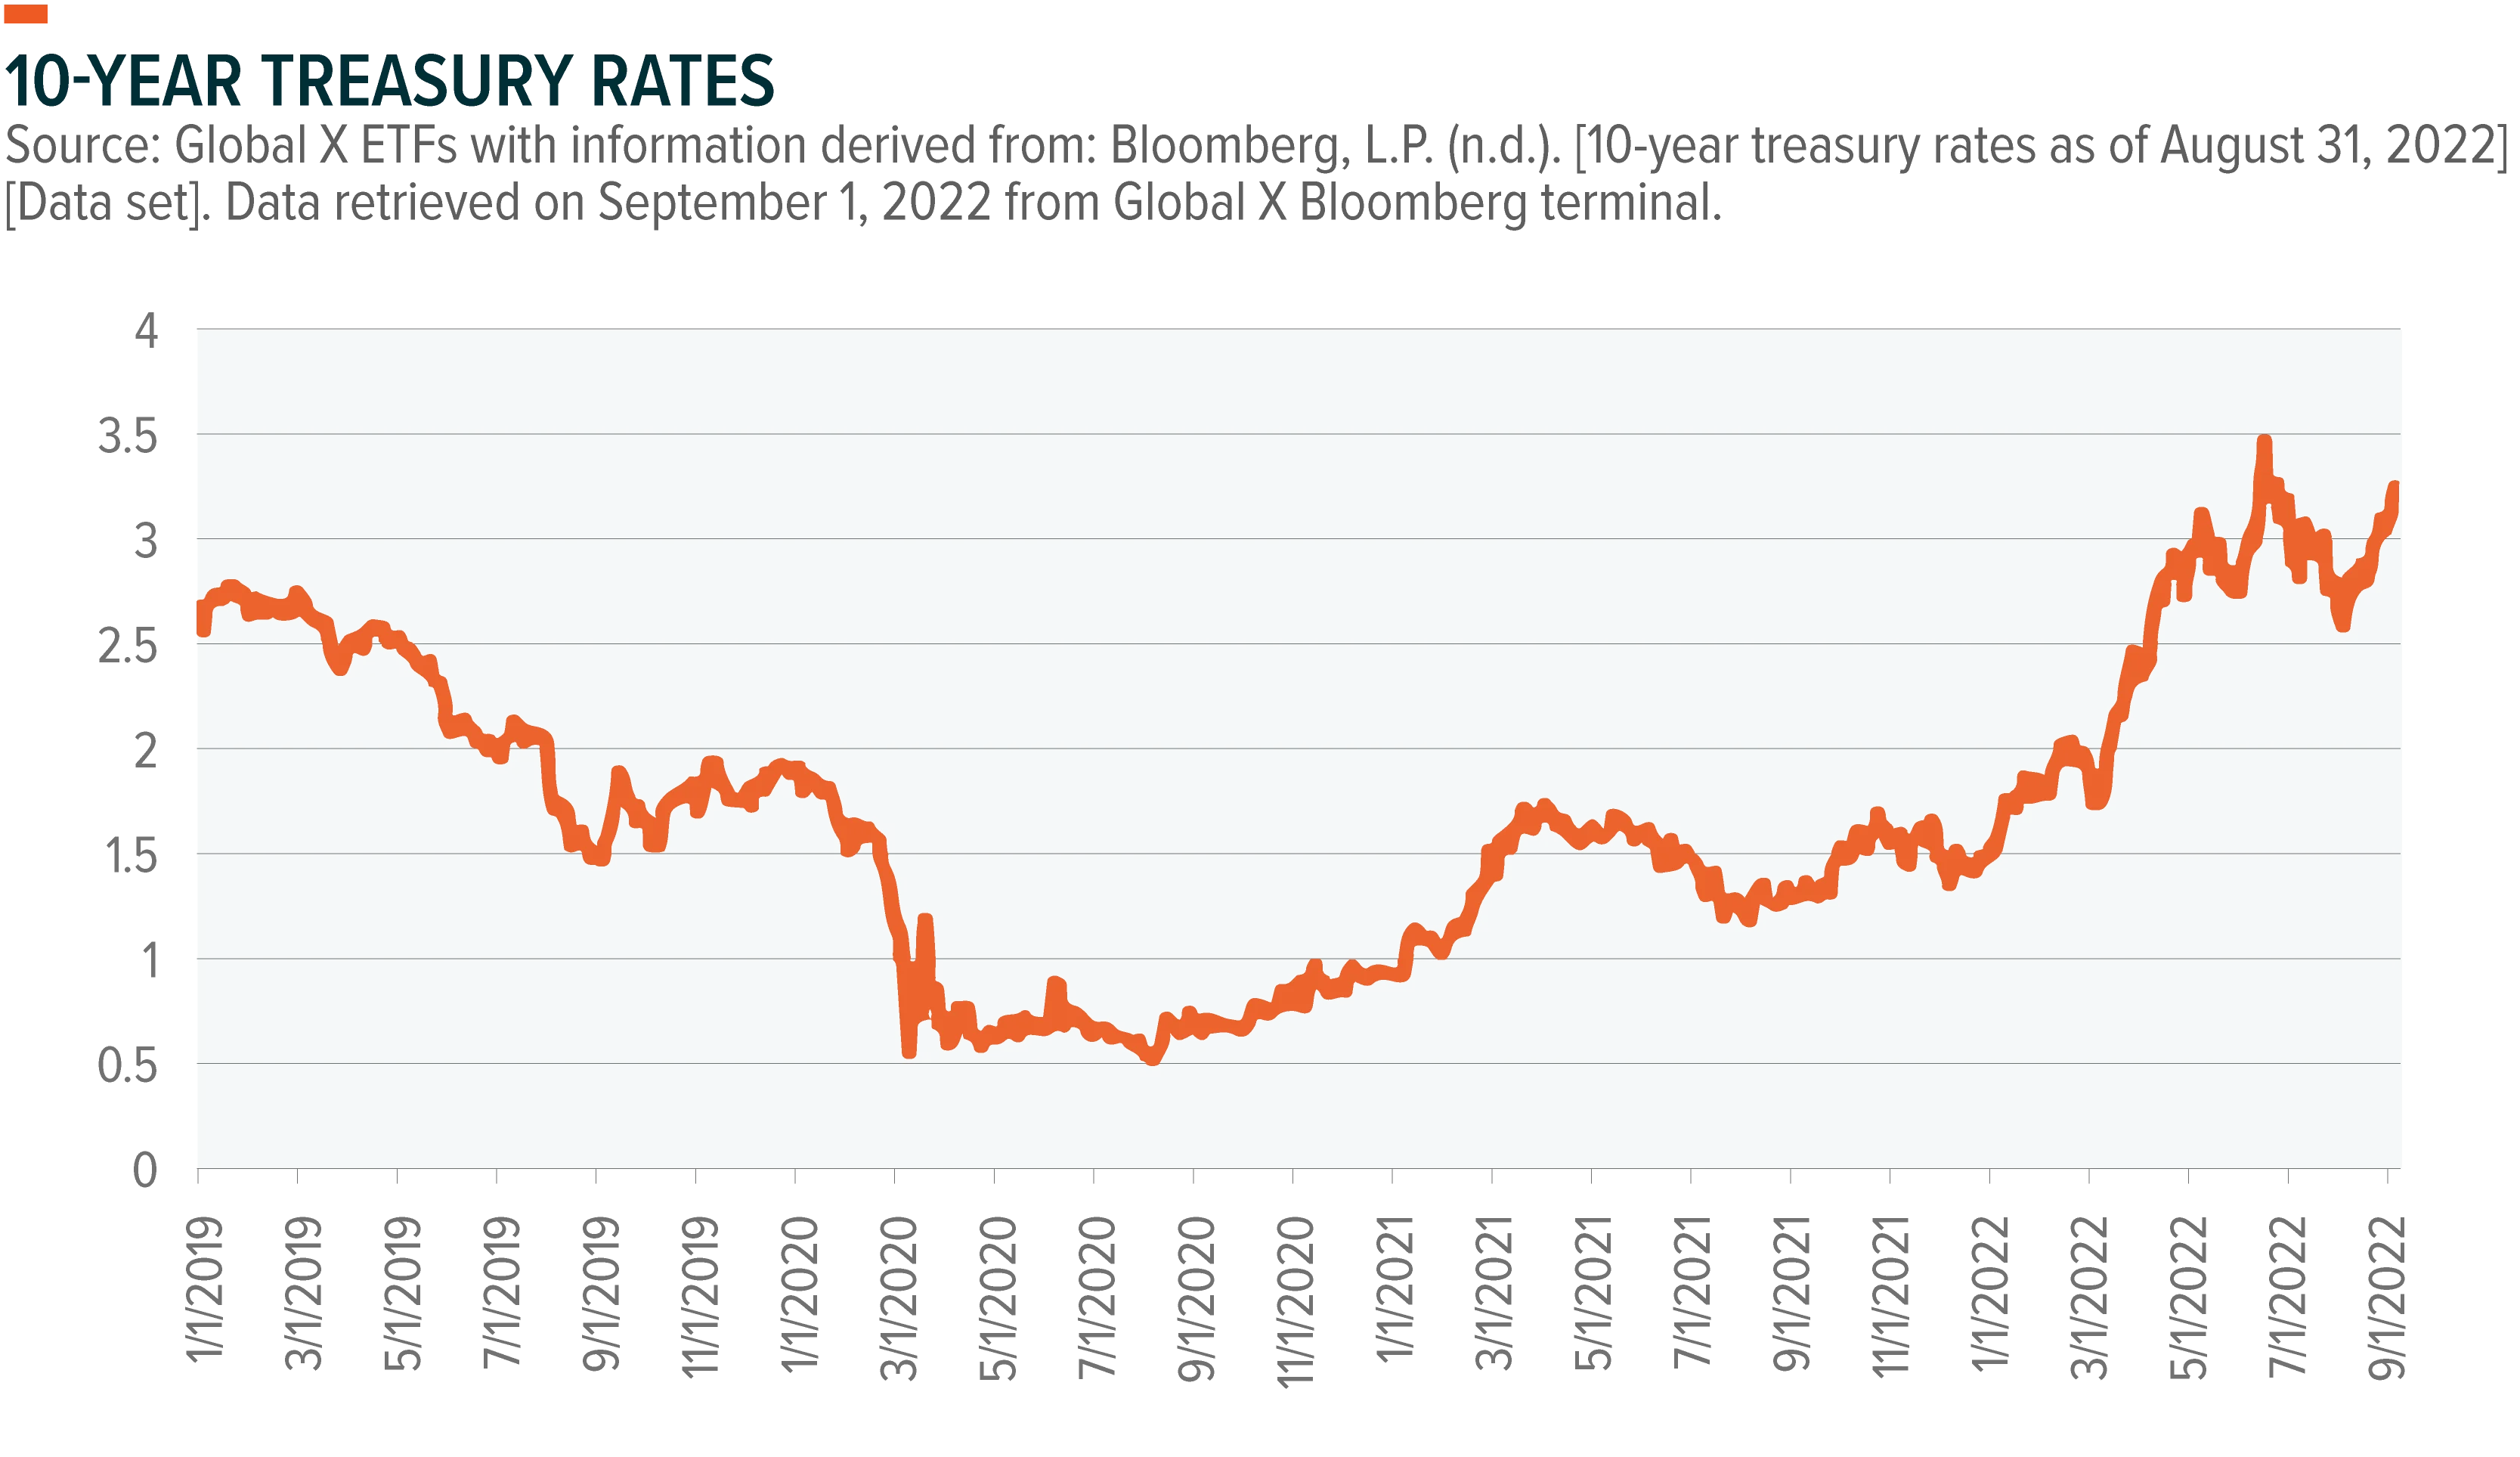
Investors expect that as economic conditions normalize, rates will continue to increase. Interest rate volatility has also increased as investors are uncertain about the Federal Reserve’s interest rate path. The 10-year treasury yields have moved from 1.74% at the end of 1Q21 to 2.67% as of August 4, 2022.6 Rising rates makes it more expensive for companies to get financing which can cause turbulence for small cap companies as bond investors tend to add a “small cap risk premium” towards Russell 2000 companies that are unprofitable as higher rates increase financing costs.
With rising interest rates presenting headwinds for the Russell 2000, one way to potentially enhance returns is to generate income from a covered call strategy. This involves purchasing the stocks in the Russell 2000 Index and subsequently writing call options on the index. Covered call strategies limit upside participation but can generate income through collecting premiums received from option writing. In volatile markets, option premiums tend to rise and therefore, covered call strategies tend to perform better in choppy or sideways markets rather than in major bull or bear markets.
From the chart below, we can see that Russell 2000 has produced higher levels of volatility compared to the Nasdaq 100 and S&P 500. As the future US economic data becomes more uncertain amid lower earnings growth, higher inflation, and unexpected geopolitical tension arising, a strategy like employing covered calls on the Russell 2000 can offer a buffer from the premiums collected during these periods.
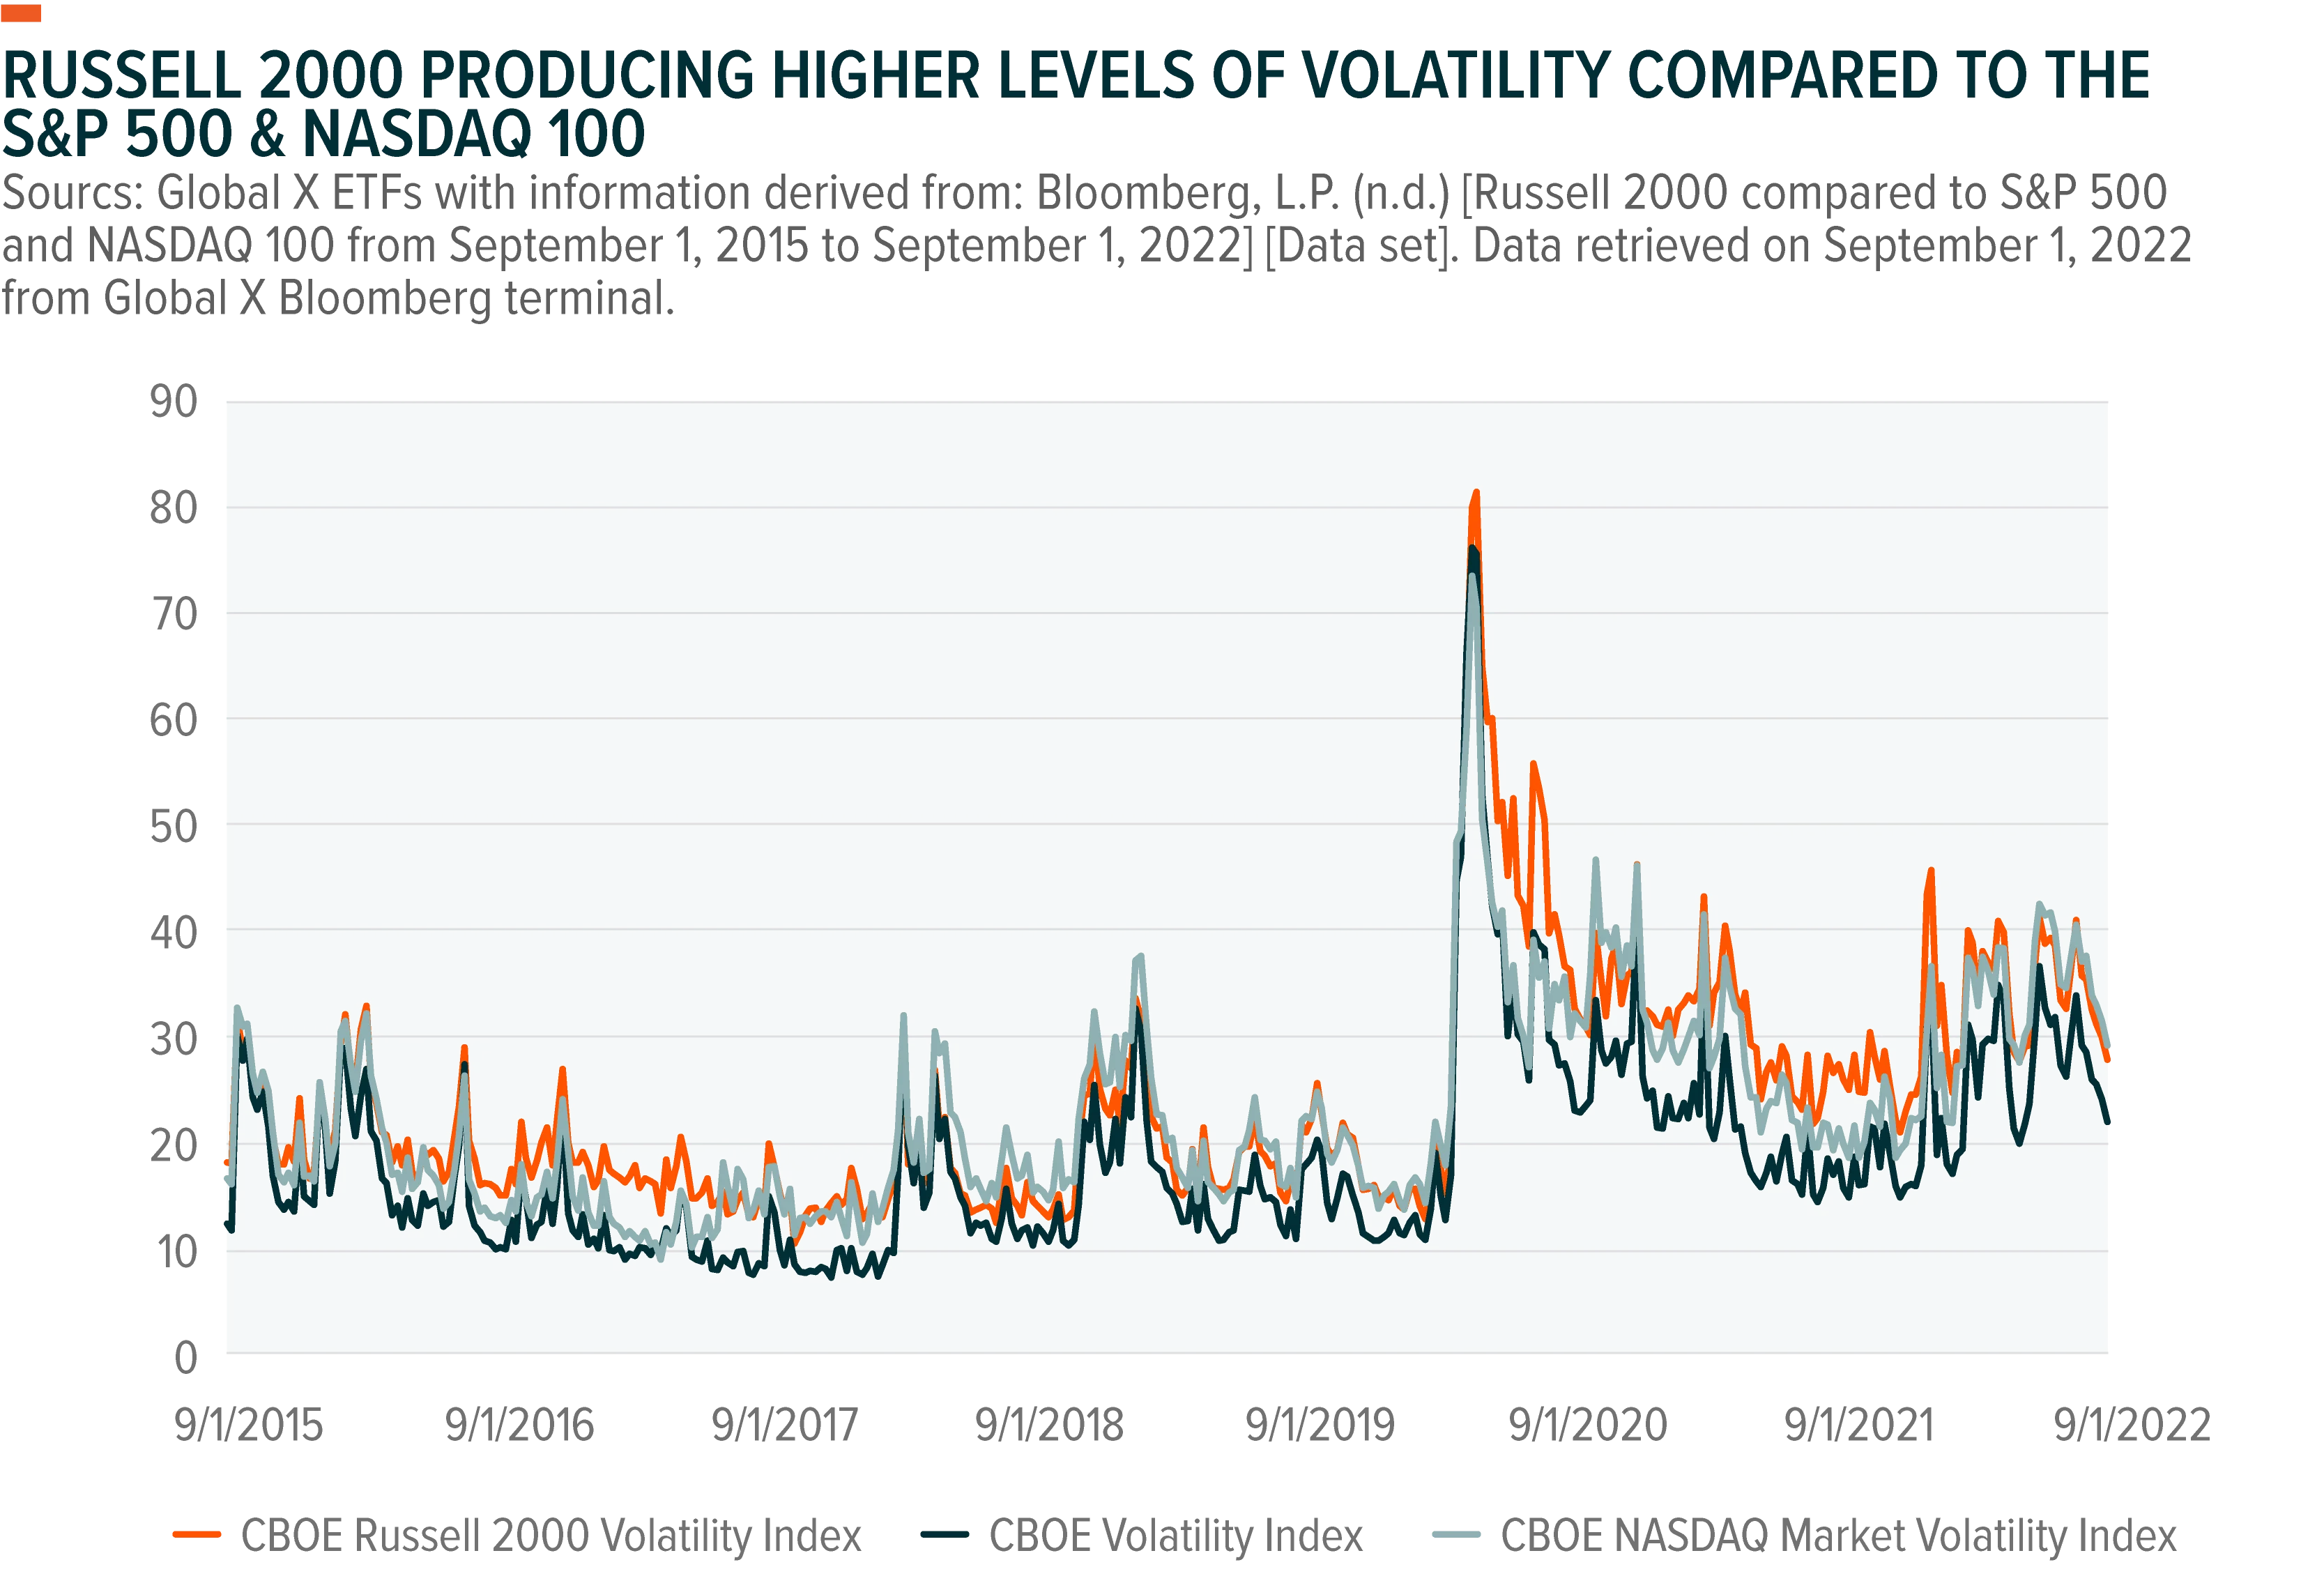
The premiums received are positively correlated to implied volatility. Thus, as implied volatility on the index increases, generally so does the price of the option leg.
The futures market is currently pricing a shift in monetary policy, shown by the Fed futures market betting on the Fed cutting rates in early 2023. While a long-term shift in policy could produce increased revenue for cyclical and sensitive sectors within the Russell 2000, in the short-term, historically small cap risk premiums traditionally accelerate as the cost of borrowing for small caps increases compared to larger companies.
Using a covered call strategy can help give a premium buffer for an investor while achieving income potential as groups such as fixed income investors see elevated reinvestment risk when rates fall, and principal risk as rates rise.
While covered call strategies can be implemented on a variety of indexes or underlying assets, selling calls on the Russell 2000 offers a couple of distinctive features. First, historically the RUT has consistently exhibited higher volatility than the S&P 500, which can fuel greater premiums from selling options.
Currently, broad market implied volatility levels remain higher than they were prior to the pandemic. This means that option premiums are higher than they are usually, thus providing greater income potential to investors.
For the Russell 2000 compared to the S&P 500, the Russell 2000 has a wider band of returns compared to the S&P. These wider return distributions leads to the larger volatility, which ultimately allows for RYLD to potentially receive higher premiums for the options it writes than XYLD. Investors face challenges in managing their investments: how to generate enough income amid a low interest rate environment, while mitigating the risks of rising rates or major market selloffs.
Secondly, another distinctive feature of the Russell 2000 covered call strategy is to potentially help diversify an income-oriented portfolio. The RUT (Russell 2000 Index) has diverse small cap exposure; thus, its performance can differ from traditional dividend focused fund that may have a large cap and/or mid cap tilt. Using covered calls allows investors to mitigate downside risk by monetizing volatility, thus offering a source of inverse exposure to volatility, something that traditional equity and fixed income markets do not.
Despite strong returns over the last decade, the Russell 2000 is at a bit of a crossroads. As yields have continued to rise, value stocks have seen outperformance. While small caps have some of the higher rates of growth among stocks, they are also more volatile which poses a greater risk to investors. While the Russell 2000 has underperformed the Nasdaq 100 and S&P 500 over longer periods, the RUT has produced higher levels of volatility. Covered call strategies such as RYLD can take advantage of this volatility which has led to higher premiums and yield compared to QYLD and XYLD.
Covered call strategies such as RYLD could be valuable in an uncertain environment. Higher volatility tends to increase the options premiums received from selling calls, which can potentially enhance returns even in a trendless market. While some investors may suggest purchasing put options to mitigate downside risk, put option premiums have become more expensive to purchase now because of higher volatility. In addition, the income from value-based covered call strategies can help diversify an income portfolio away from traditional sources like dividend paying stocks or fixed income. A Russell 2000 covered call strategy may be an alternative way for investors to generate potential income and remain invested in the equity markets.
Related ETFs
RYLD – Global X Russell 2000 Covered Call ETF
QYLD- Global X Nasdaq 100 Covered Call ETF
XYLD- Global X S&P 500 Covered Call ETF
Click the fund name above to view current holdings. Holdings are subject to change. Current and future holdings are subject to risk.
Bloomberg L.P. (n.d.) [Russell 2000 and Nasdaq 100 return data as of August 15, 2022] [Data set]. Retrieved on August 10, 2022 from Global X Bloomberg terminal.
Ibid.
Bloomberg L.P. (n.d.) [MSCI USA Value and MSCI USA Growth historical prices from January 1, 2022 to July 31, 2022] [Data set]. Retrieved on August 10, 2022 from Global X Bloomberg terminal. Bloomberg.
Mutikani, L. (2022, September 13). Stubbornly high rents, food prices boost U.S. inflation in August. Reuters. https://www.reuters.com/markets/us/monthly-us-consumer-prices-unexpectedly-rise-august-core-inflation-picks-up-2022-09-13/
Yoshimoto, C. (2022, April 29). Revenues without borders: Tracking US companies’ cashflows. FTSE Russell. https://www.ftserussell.com/blogs/revenues-without-borders-tracking-us-companies-cashflows
Bloomberg, L.P. (n.d.) [10-year treasury rates as of August 31, 2022] [Data set]. Data retrieved on September 1, 2022 from Global X Bloomberg terminal.
Given its competitive yield, RYLD may be attractive to investors seeking current income while reducing exposure to long duration or credit risk.
Given its competitive yield, RYLD may be attractive to investors seeking current income while reducing exposure to long duration or credit risk.