With market values on the rise in 2023, the Cboe Volatility Index (VIX) has hit multi-year lows several times. Burgeoning demand for artificial intelligence technology and a deceleration of the Federal Reserve’s (Fed) interest rate hikes have supported investor confidence, particularly in the first half. And while the performance of the equity benchmark S&P 500 Index has not quite matched up to that of the tech-heavy Nasdaq 100 Index, S&P 500 valuations remain elevated on a historical basis.1 From here, the outlook for equities is somewhat mixed, with borrowing costs relatively high, the U.S. dollar relatively strong, and recent economic data supporting the case for interest rates to remain higher for longer. In this environment, covered call strategies like the Global X S&P 500 Covered Call ETF (XYLD) may be appropriate for investors looking to reduce volatility associated with their U.S. large cap positions.
Key Takeaways
The Global X S&P 500 Covered Call ETF (XYLD) uses a buy/write strategy in an effort to generate income. By selling call options on the S&P 500 Index, XYLD may produce competitive distributions that can prove accretive to a variety of investor accounts.
Spreading exposures across an array of companies and industries, the diversification potential provided by particular index funds might help improve the risk-adjusted returns associated with a broader portfolio. Covered call funds like XYLD can add a supplemental layer of diversification by writing call options.
Price momentum generated by the S&P 500 in early 2023 has waned in the second half of the year. With multiple economic factors potentially adding downward pressure, alternative measures of asset allocation, like derivatives-based strategies, may be appealing for investors.
Implementing a Covered Call Investment Strategy on the S&P 500
For balanced- and growth-oriented investors, the S&P 500’s diversification and historical performance make allocations there an obvious choice. However, for income-driven investors with a more defensive posture in mind, investment-grade and government bonds with little to no chance of defaulting are typically the preferred avenue. When income investors do pursue positions in equities, large-cap companies that generate strong cash flows and pay a solid dividend are typically the targets for those that prefer not to overconcentrate in specific higher-yielding sectors with interest rate risk. And though index funds that track the S&P 500 could potentially offer these investors an opportunity to diversify their holdings, annualized dividends yielded by the index on the whole over the last decade have only amounted to about 1.8%.2
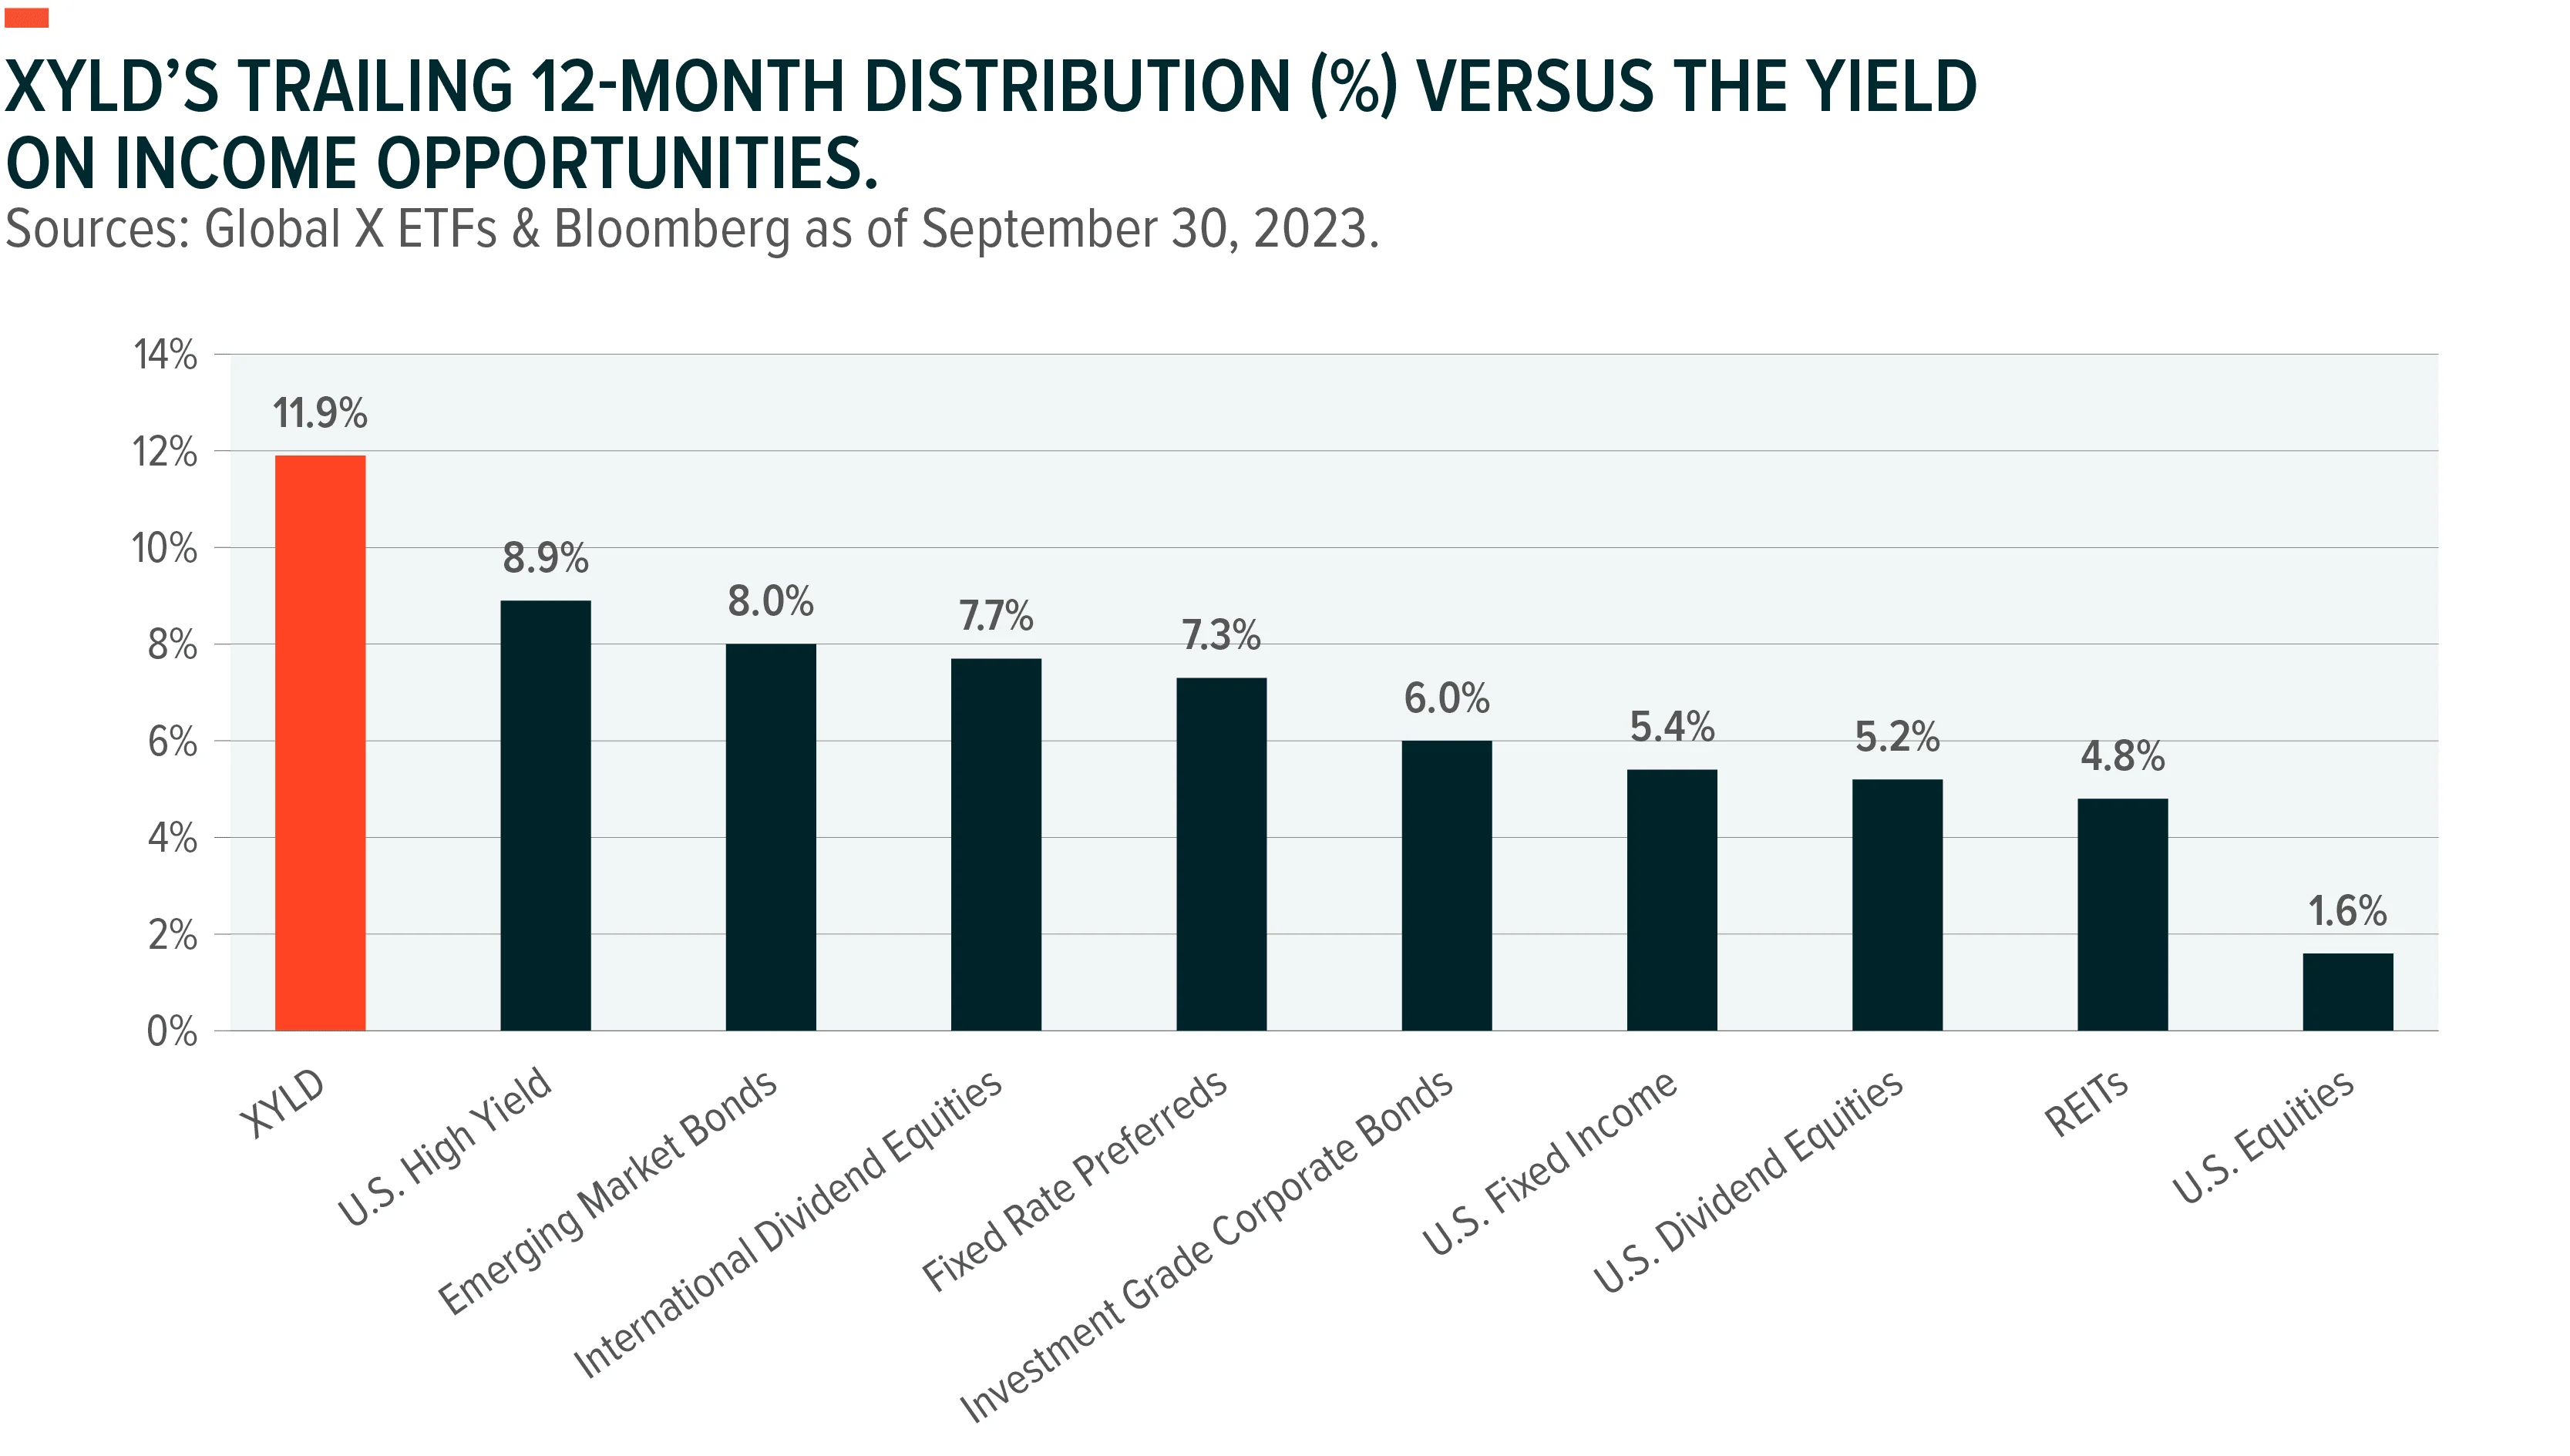
Covered call option strategies, including the Global X S&P 500 Covered Call ETF (XYLD), can represent a vehicle through which income investors can add these atypical exposures that do not necessarily provide a meaningful dividend, but instead seek out option premiums. XYLD purchases all of the stocks that comprise the S&P 500 Index at nearly equivalent weights and writes European-style S&P 500 Index call options against 100% of its holdings on a monthly basis. The fund then distributes the lower of half the premium received for writing the call option or 1% of its net asset value to shareholders shortly after receiving the premium. As of September 30, 2023, the trailing 12-month distribution (%) on XYLD was 11.9%. As the chart below shows, that measure exceeded the yields of major income producing asset classes, including the S&P 500 High-Dividend Index.
Past performance is not a guarantee of future results. Performance data quoted represents past performance. The investment return and principal value of an investment will fluctuate so that an investor’s shares, when sold or redeemed, may be worth more or less than their original cost and current performance may be lower or higher than the performance quoted. For performance data current to the most recent month- or quarter-end or a copy of the Fund prospectus, please visit our site.
U.S. equity asset classes’ yields are their 12 month yields. Fixed Income yields are yield-to-worst. XYLD’s distribution percentage is indicated by its trailing 12-month distributions relative to the fund’s most recent NAV and capital gains over the 12-month period. A portion of the Fund’s distributions is estimated to include a return of capital. For information on the breakdown of the most recent distribution, please the 19a notice.
Asset class representations are as follows: U.S. High Yield, Bloomberg U.S. Corporate High Yield Total Return Index; International Dividend Equities, Dow Jones EPAC Select Dividend Index; Fixed Rate Preferreds, ICE BofA Fixed Rate Preferred Securities Index; Emerging Market Bonds, Bloomberg EM USD Aggregate Total Return Index; Investment Grade Corporate Bonds, Bloomberg U.S. Corporate Total Return Index; U.S. Dividend Equities, S&P 500 High Dividend Total Return Index; REITs, FTSE NAREIT All Equity REITs Total Return Index; U.S. Equities, S&P 500 Total Return Index; U.S. Fixed Income, Bloomberg U.S. Aggregate Bond Index.
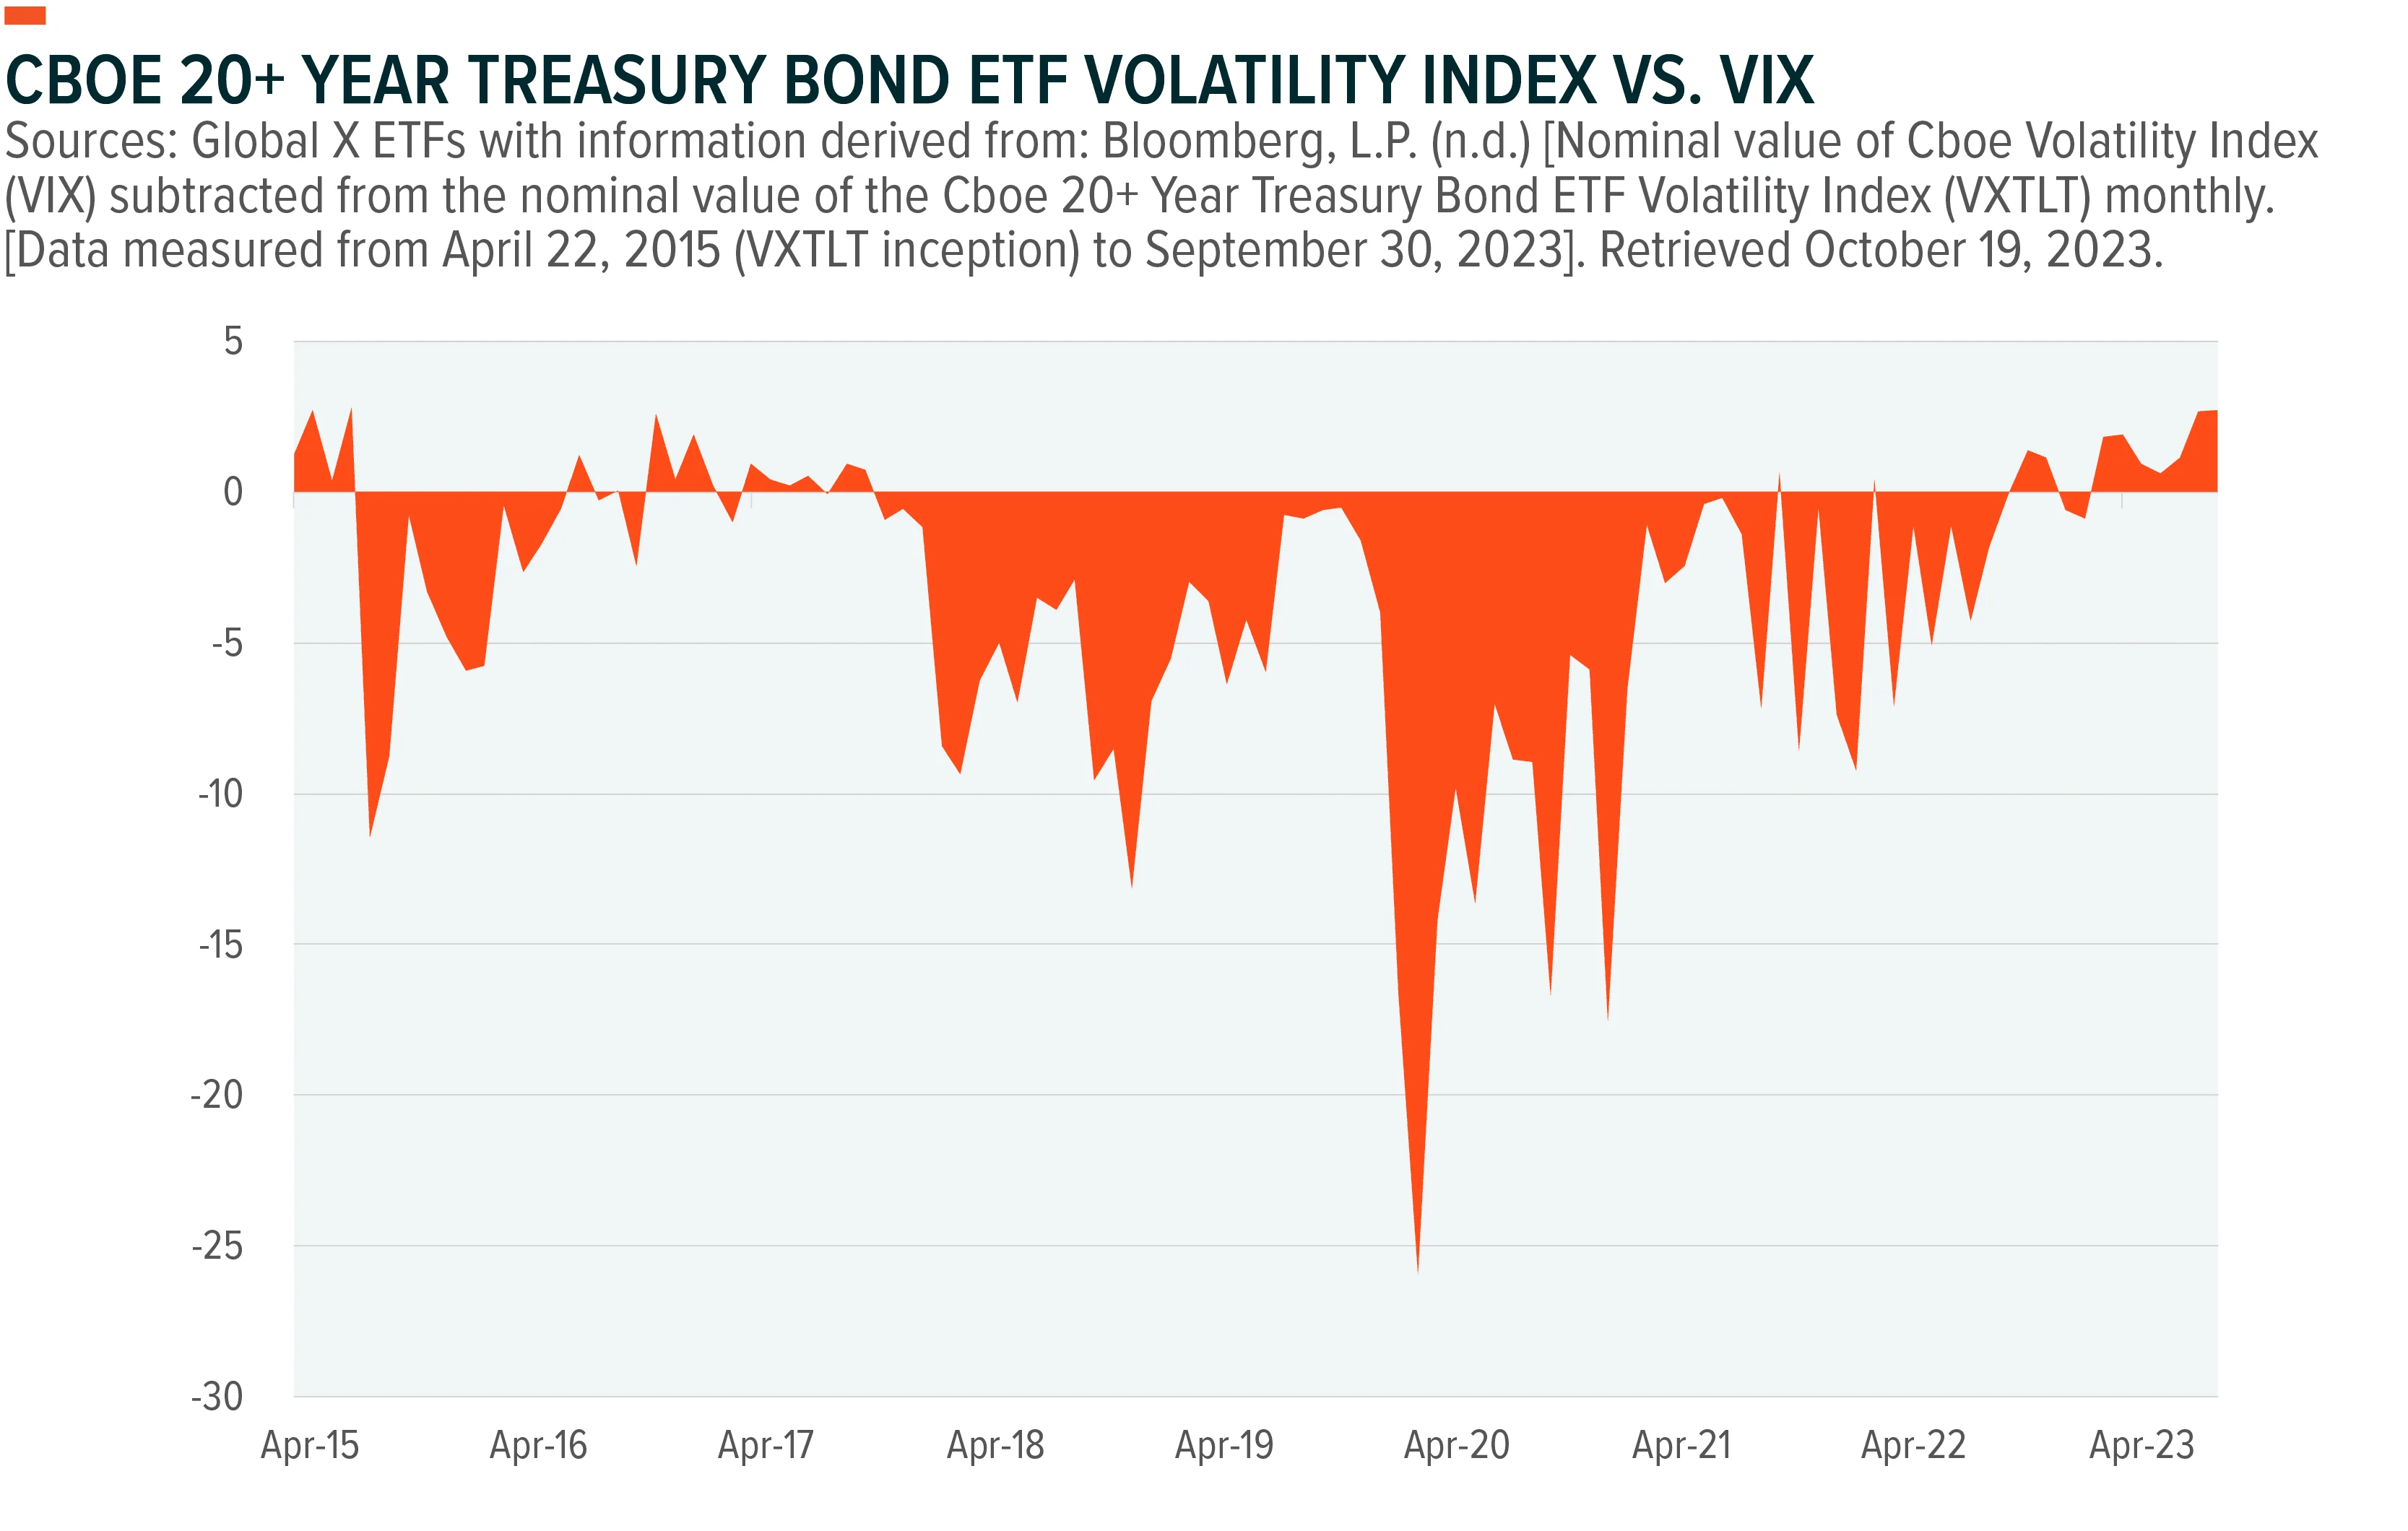
This distribution methodology may make broad equity index exposure more digestible for investors with an income mindset. Additionally, a fund like XYLD can allow income investors to retain a potentially more conservative approach due to the lack of embedded duration risk that fixed income asset classes take on. Lately, equities have even displayed a lesser degree of volatility relative to long-duration treasury securities.
By operating a passive, rules-based investment strategy, XYLD has the potential to drive less return variability relative to the underlying index, compared to an instrument that gives an investment manager a means of control over equity tilts and option characteristics. The use of European-style index options also means that the calls that XYLD writes cannot be exercised prior to expiration, and they are only settled in cash.
XYLD Offers Broad Equity Exposure and Other Forms of Diversification
There’s a reason why the S&P 500 Index has earned such acclaim over the years. At a value of almost $40 trillion, the index’s portfolio of companies covers roughly 80% of all available market capitalization.3 Its methodology, tilting exposures toward companies that possess the highest market caps, makes it one of the strongest indicators of economic health around the world. It also allows it to suit a variety of risk-reward profiles.
The historical performance of the S&P 500 is a credit to the traditional leaders of the index, including companies like the Coca-Cola Company (KO), Exxon Mobil Corporation (XOM), and General Electric Company (GE). More recently, Information Technology (IT) stalwarts like Apple, Inc. (AAPL) and Microsoft Corp. (MSFT) assumed leadership. In Q3 2023, these companies generated billions of dollars in net income, the type of profitability that illustrates why IT now represents the largest share of the S&P 500 pie.
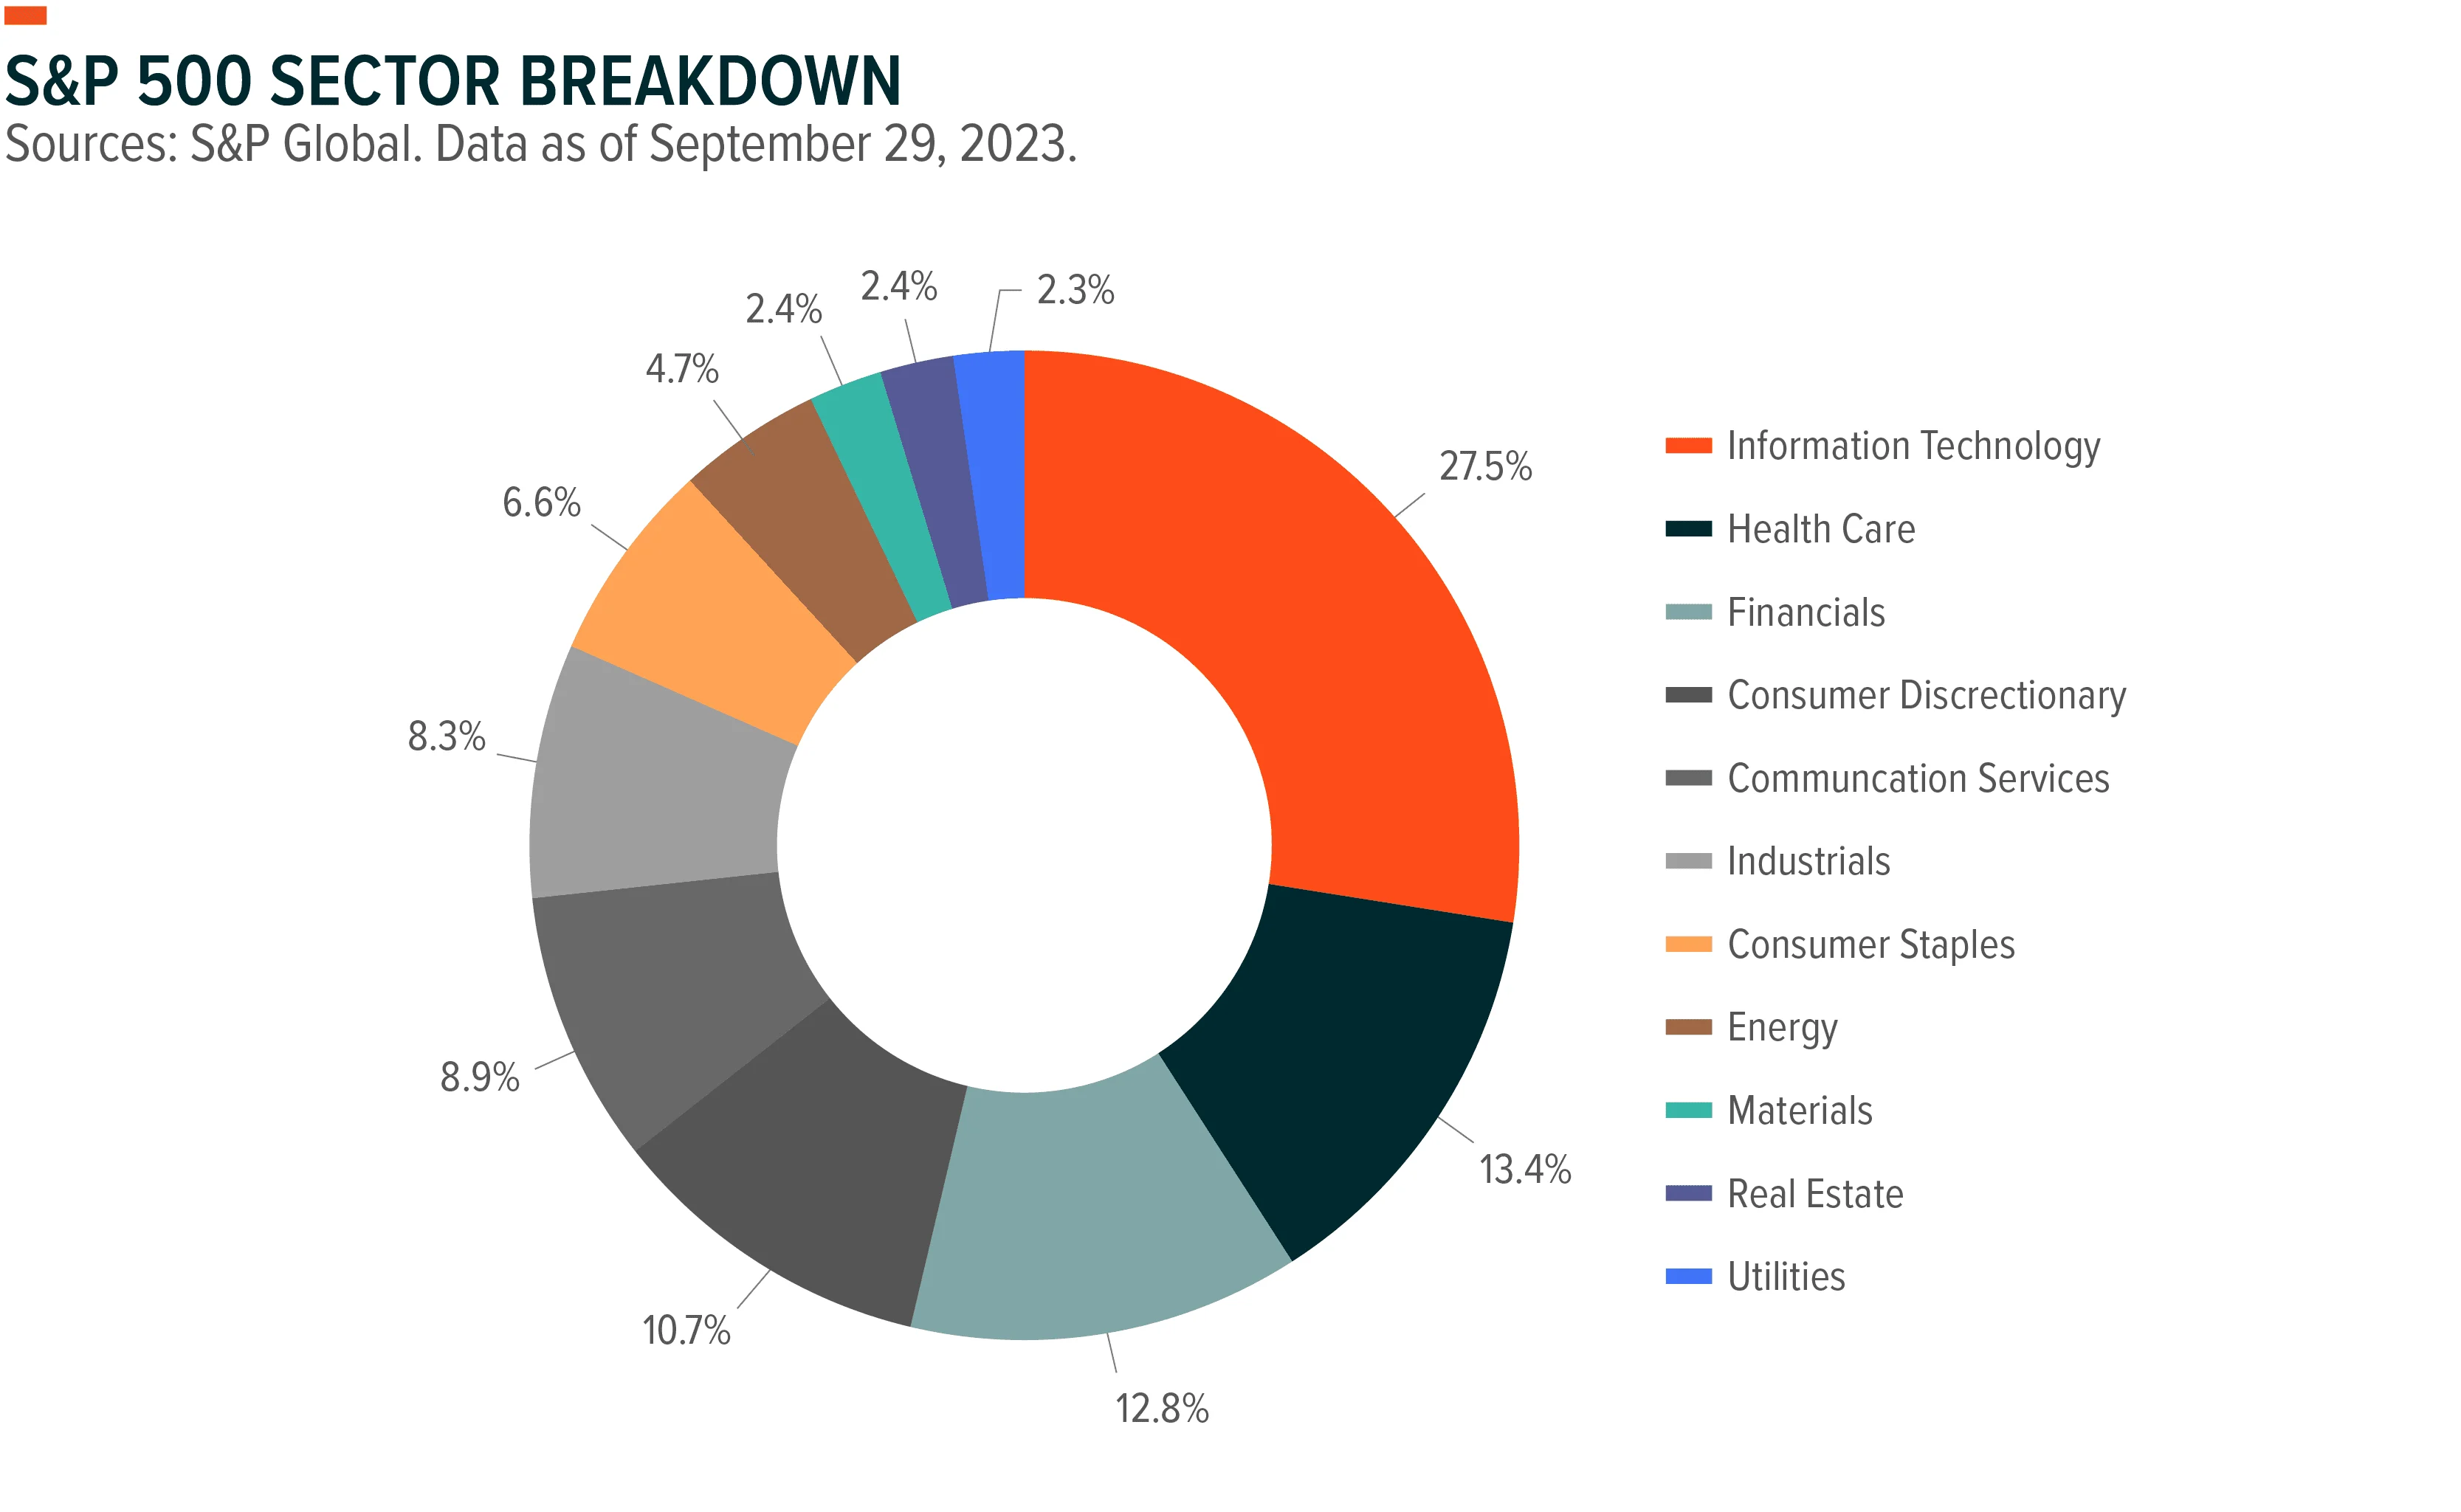
XYLD supports efficient risk-adjusted return potential by way of this underlying asset exposure, specifically as it pertains to sectors like Information Technology or Consumer Discretionary. There, excess funds are typically allocated toward capital investments or research & development, as opposed to the offering of a dividend. However, in 2023, these sectors have represented some of the strongest performing portions of the market, reaping gains on average of about 42%.4 Meanwhile, Consumer Staples, Energy, Financials, and Real Estate, where income investors might be more traditionally inclined to take a position, have fallen on average about 8%.5
Discounting the sector-related diversification that can be provided by XYLD, the call options that it writes also create for it a positive relationship with volatility. Typically, premiums received via the buy/write strategy will increase when market performance becomes less predictable. By monetizing this volatility using covered call premiums, the fund has the potential to outperform the underlying S&P 500 Index during periods when it trades in a flat or choppy manner.

Weakening Momentum for the S&P 500 May Support an Ideal Backdrop for XYLD
Operating under its rules-based distribution methodology, XYLD can represent a cornerstone premium distribution provider to a portfolio, capable of fitting this mold in most market environments. Even so, the fund’s design should lead it to perform better in certain conditions and, from a tactical perspective, these conditions could very well be on the horizon.
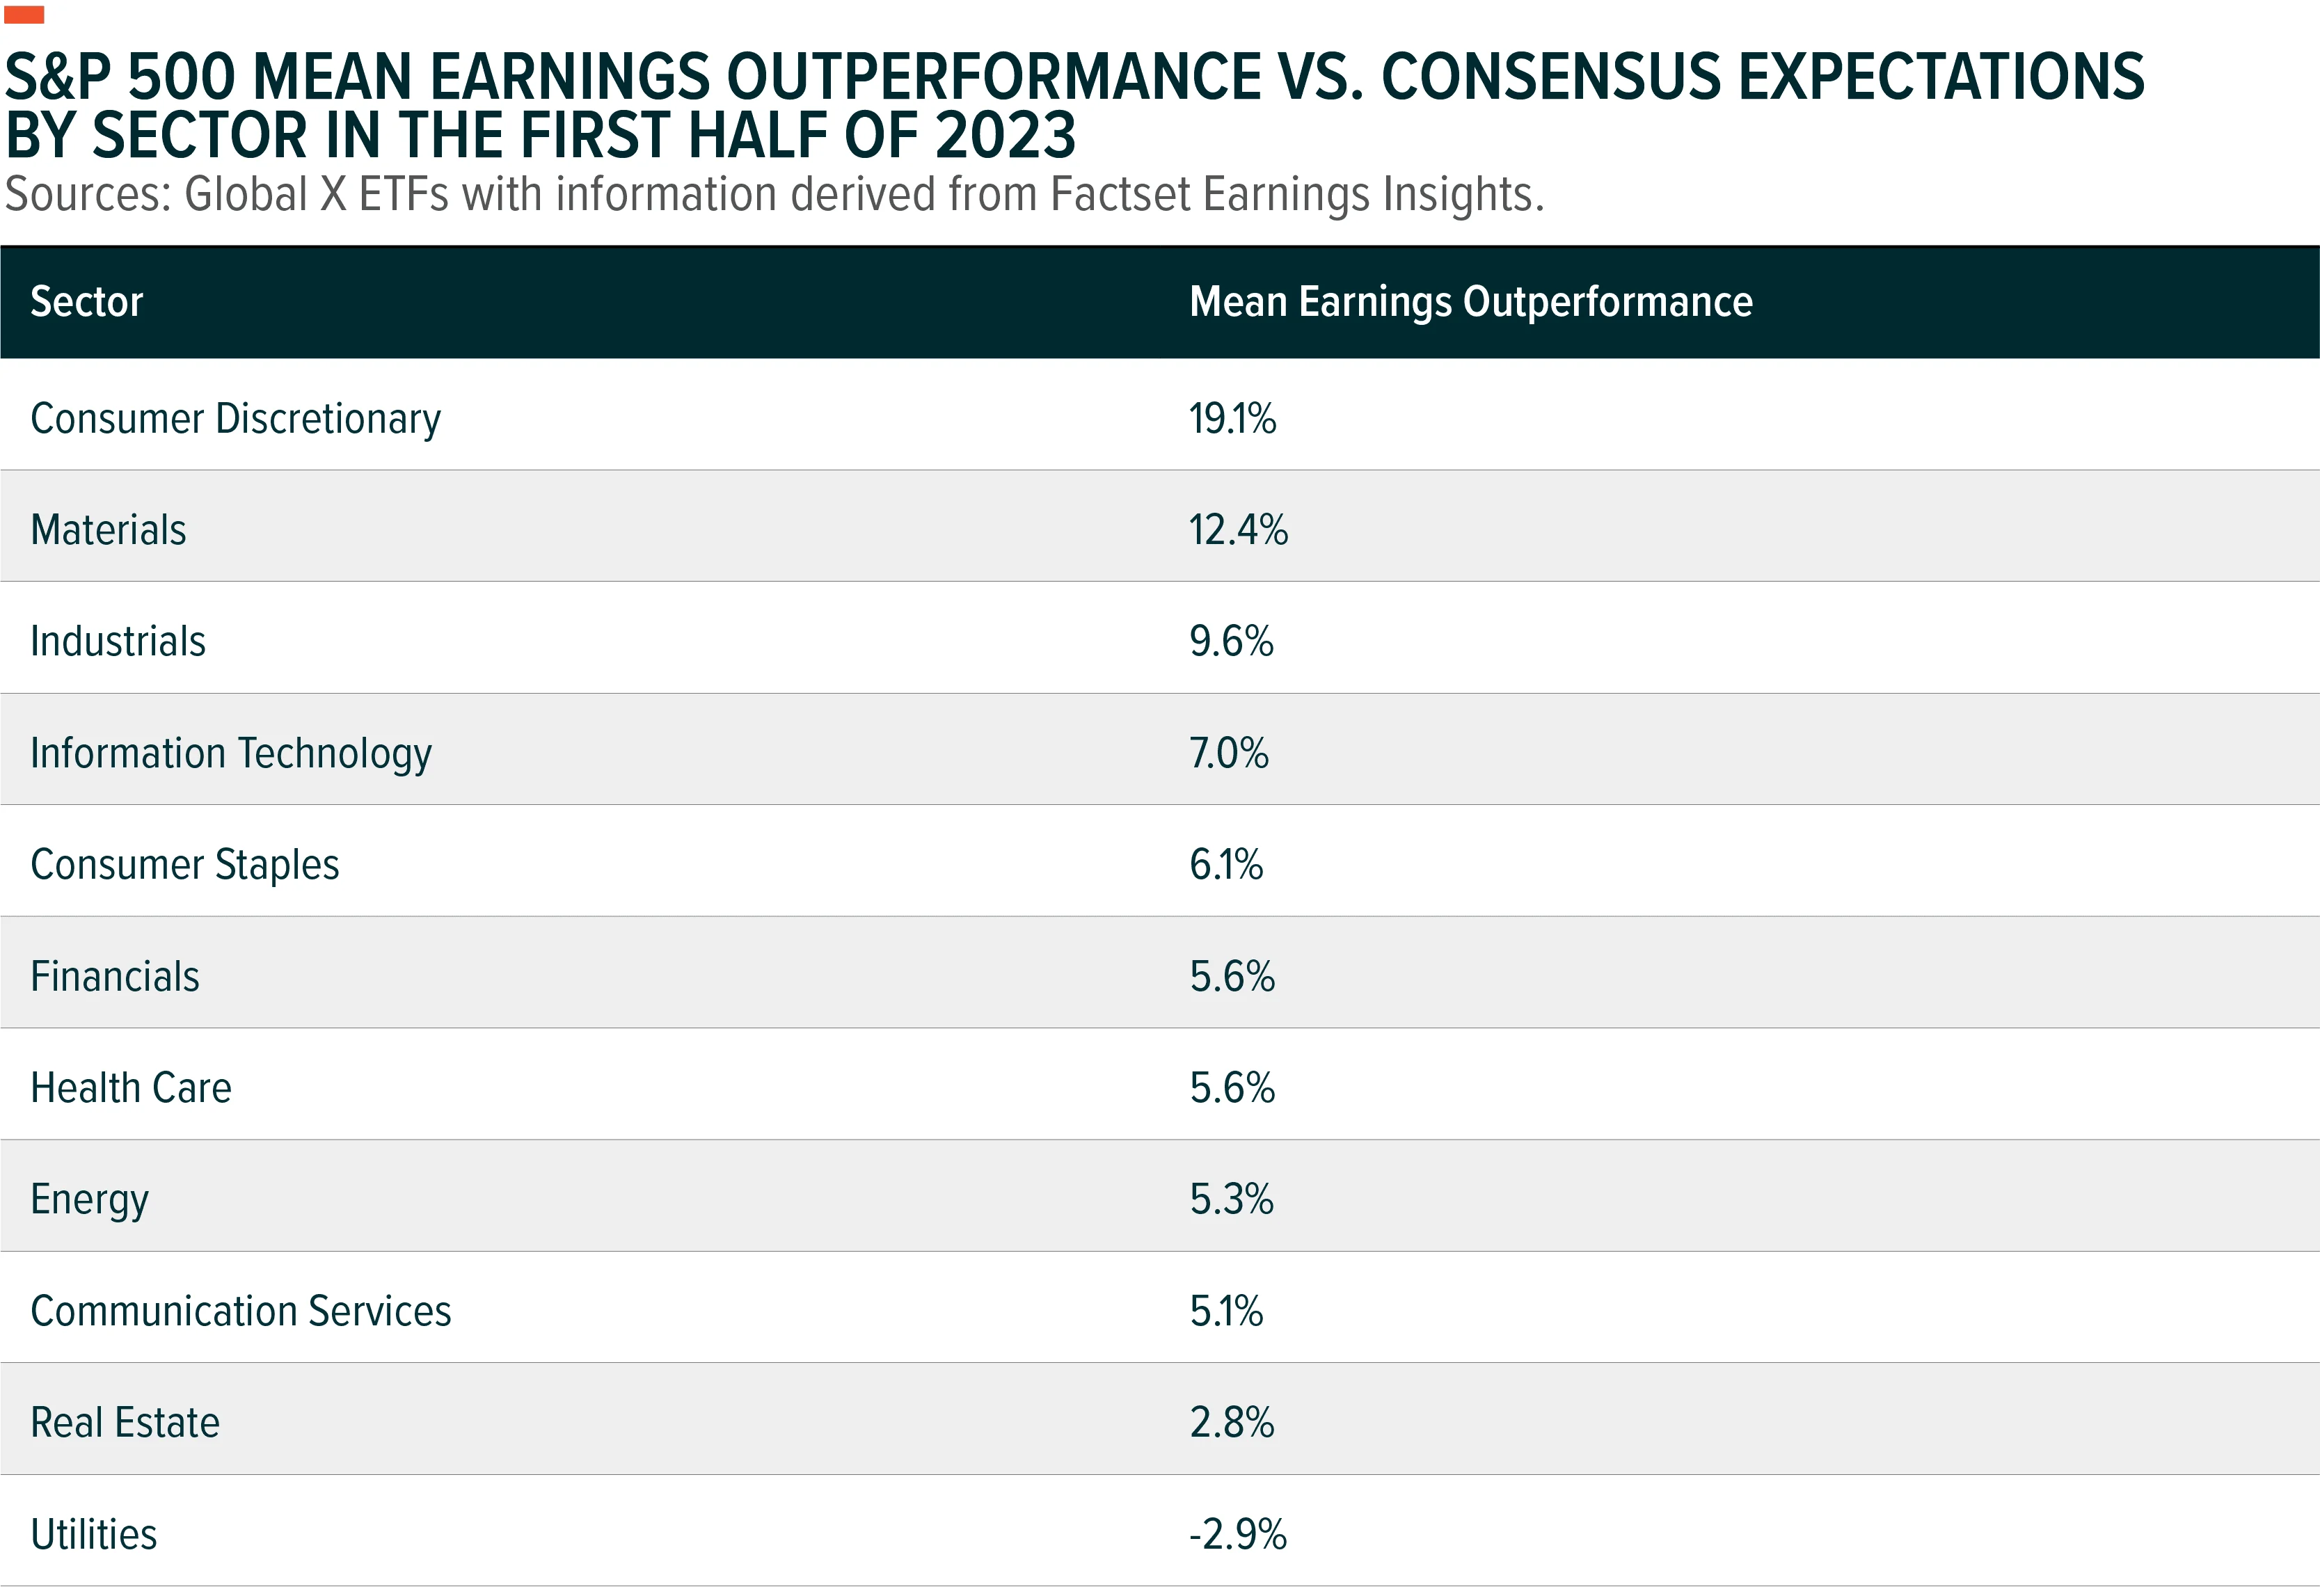
As recently as July 31st, the S&P 500 was up a healthy 20% in 2023.6 Softening inflation and the Fed nearing the end of its interest rate hiking cycle were positive for investor sentiment. The long-awaited earnings recession also turned out to be weaker than expected.
In the second half of the year, however, price appreciation has been harder to come by. Energy commodities like crude oil rose to their highest levels since 2022, and the U.S. dollar surged to support the sentiment that interest rates will need to be kept higher for longer.7,8 After rising to a peak of about 49% in late August, the probability of the Fed raising interest rates at its December meeting dropped to around 30%.9
Still, Treasury yields rose to multi-year highs due, in part, to lingering uncertainty about when the Fed can ease rates, potentially drawing future investment activity away from the equity markets.10 The chart below shows the generally negative relationship that the yield on a 10-year U.S. Treasury instrument has had with market performance over time. The trend is particularly evident when interest rates dropped precipitously heading into 2019. Since then, the 10-year Treasury yield has been on a fairly consistent uptrend, and it recently surpassed the highs established in October of 2022.

These factors, combined with China’s slow post-pandemic recovery and geopolitical unrest, may make it difficult for the S&P 500 to break through resistance levels in the near term. This supports the possibility that U.S. markets and the S&P 500 move in more of a sideways fashion in the coming months. An environment like this is one where investors may benefit from trading off upside potential on their equity positions in exchange for premium returns.
Conclusion: XYLD Can Be a Long-Term Allocation and a Tactical Market Play
We believe that the current market environment demonstrates the multifaceted appeal of covered call investment strategies. Based on the 12-month trailing distributions that XYLD has been able to produce, income-driven investors and those seeking diversification can consider using the fund on more of a buy-and-hold basis. Even with the Cboe Volatility Index establishing three-year lows on multiple occasions in 2023, XYLD’s 12-month trailing distributions (%) remained in the double-digit range. Investors can use the potential distributions gained from a position like this to pursue a targeted savings goal, or they can use it in a discretionary fashion, such as for recurring payments or to create a source of ongoing reinvestment.
Related ETFs
XYLD – Global X S&P 500 Covered Call ETF
Click the fund name above to view current performance and holdings. Holdings are subject to change. Current and future holdings are subject to risk.