
In this piece, we explain why investors may want to consider tail risk strategies and how the Global X Nasdaq 100 Tail Risk ETF (QTR) and the Global X S&P 500 Tail Risk ETF (XTR) can represent efficient ways of gaining this exposure.
Key Takeaways
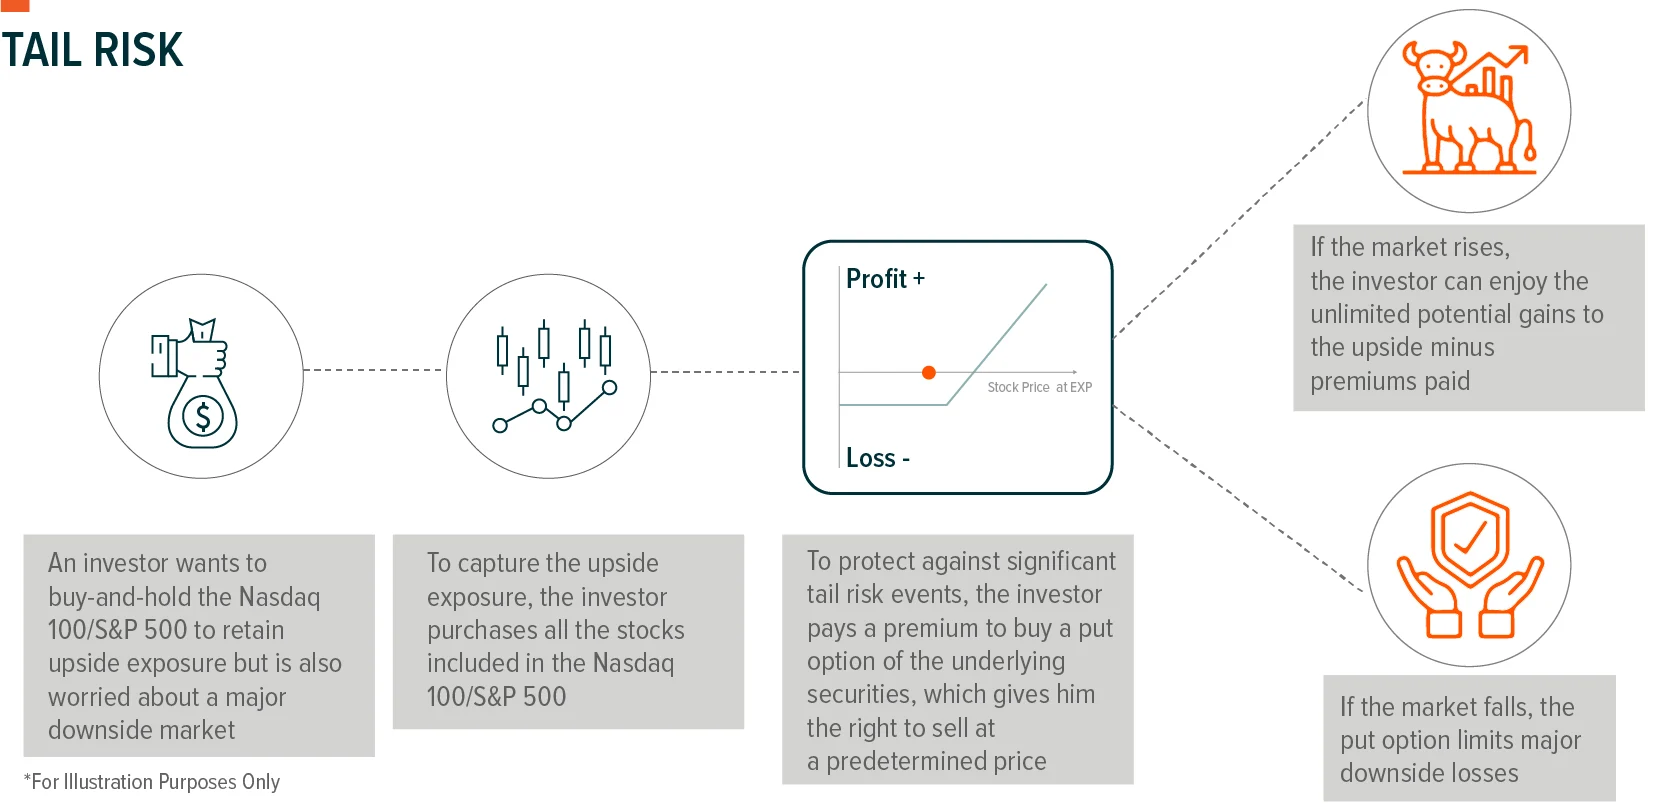
Tail risk strategies typically own the securities in an equity index, while also buying an out-of-the-money (OTM) protective put on that index. This allows for participation in upside potential (minus premiums paid), while mitigating the impacts of significant downside moves.
Tail risk strategies can be used as a core segment of a portfolio in an effort to establish defensive positioning against sharp drawdowns for equities.
Global X’s tail risk strategies place no cap on the upside appreciation potential realizable through positions in their underlying indexes. However, there is a premium cost due to the recurring purchases of protective puts in addition to management fees. QTR and XTR give investors access to tail risk strategies, utilizing professional portfolio managers to purchase 10% OTM put options on their respective indexes every three months.
What Are Tail Risk Strategies?
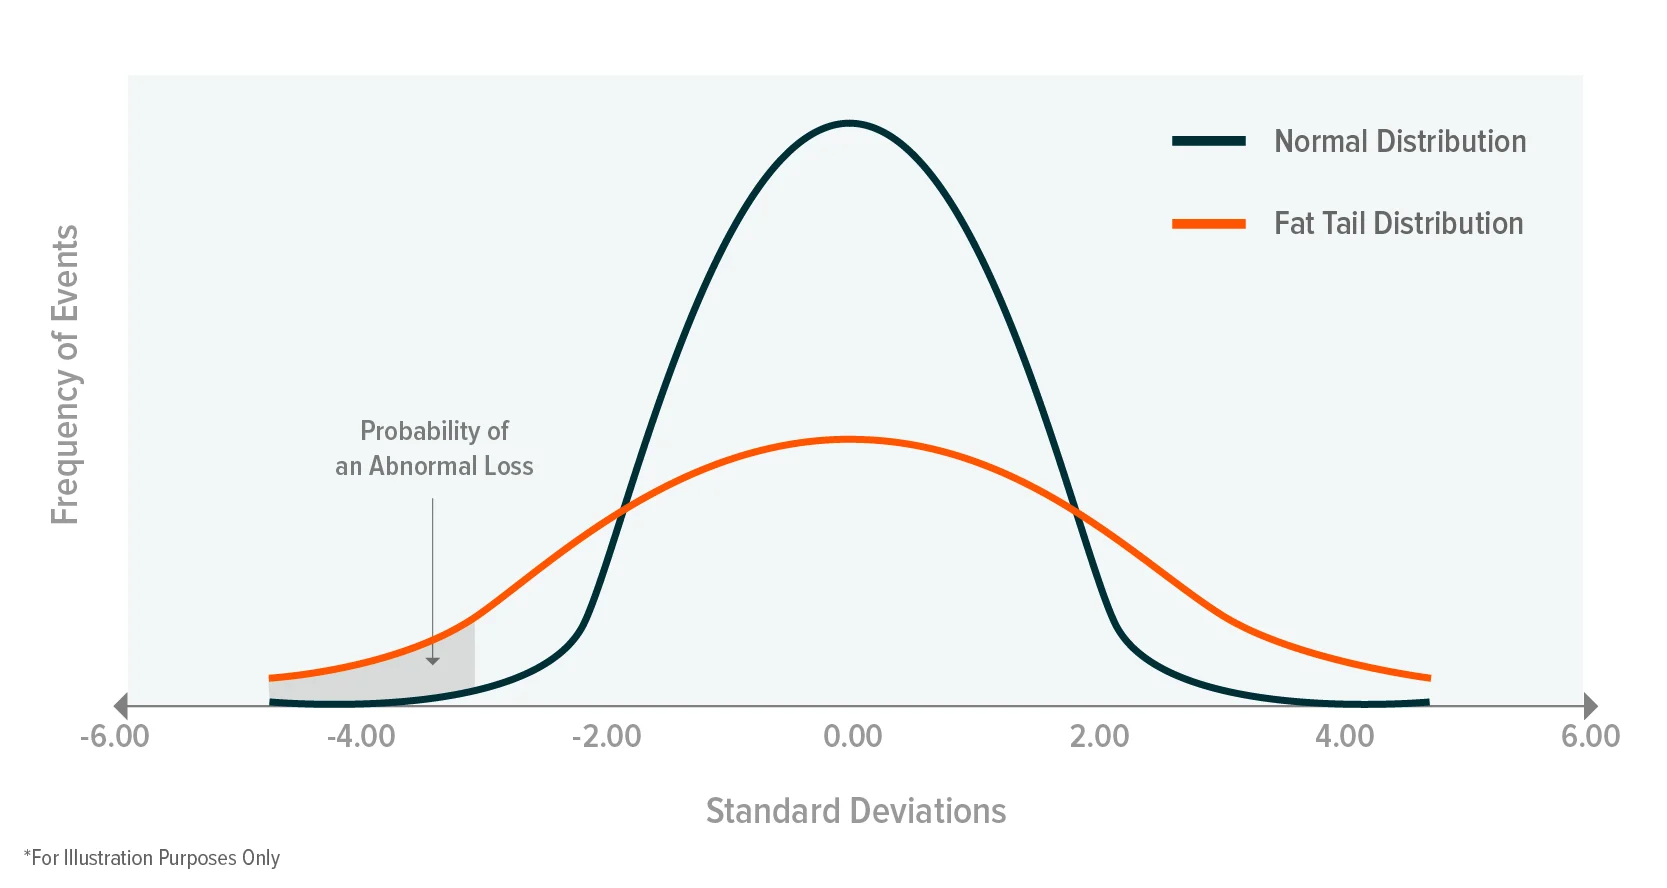
Traditionally, asset pricing models have assumed that equity returns are normally distributed, meaning 99.7% of observations should fall within three standard deviations of the average return. Yet history shows us that left tail events, i.e. significant market selloffs like the global financial crisis or the pandemic-induced selloff in Q1 2020, occur more regularly than a normal distribution anticipates.1 Over the last 20 years, there have been 6 selloffs in both the S&P 500 and the Nasdaq 100 of 10% or more over any rolling three-month period.2 Given that market selloffs occur more often than anticipated, investors may want to incorporate strategies into their long-term core portfolios to help address these concerns.
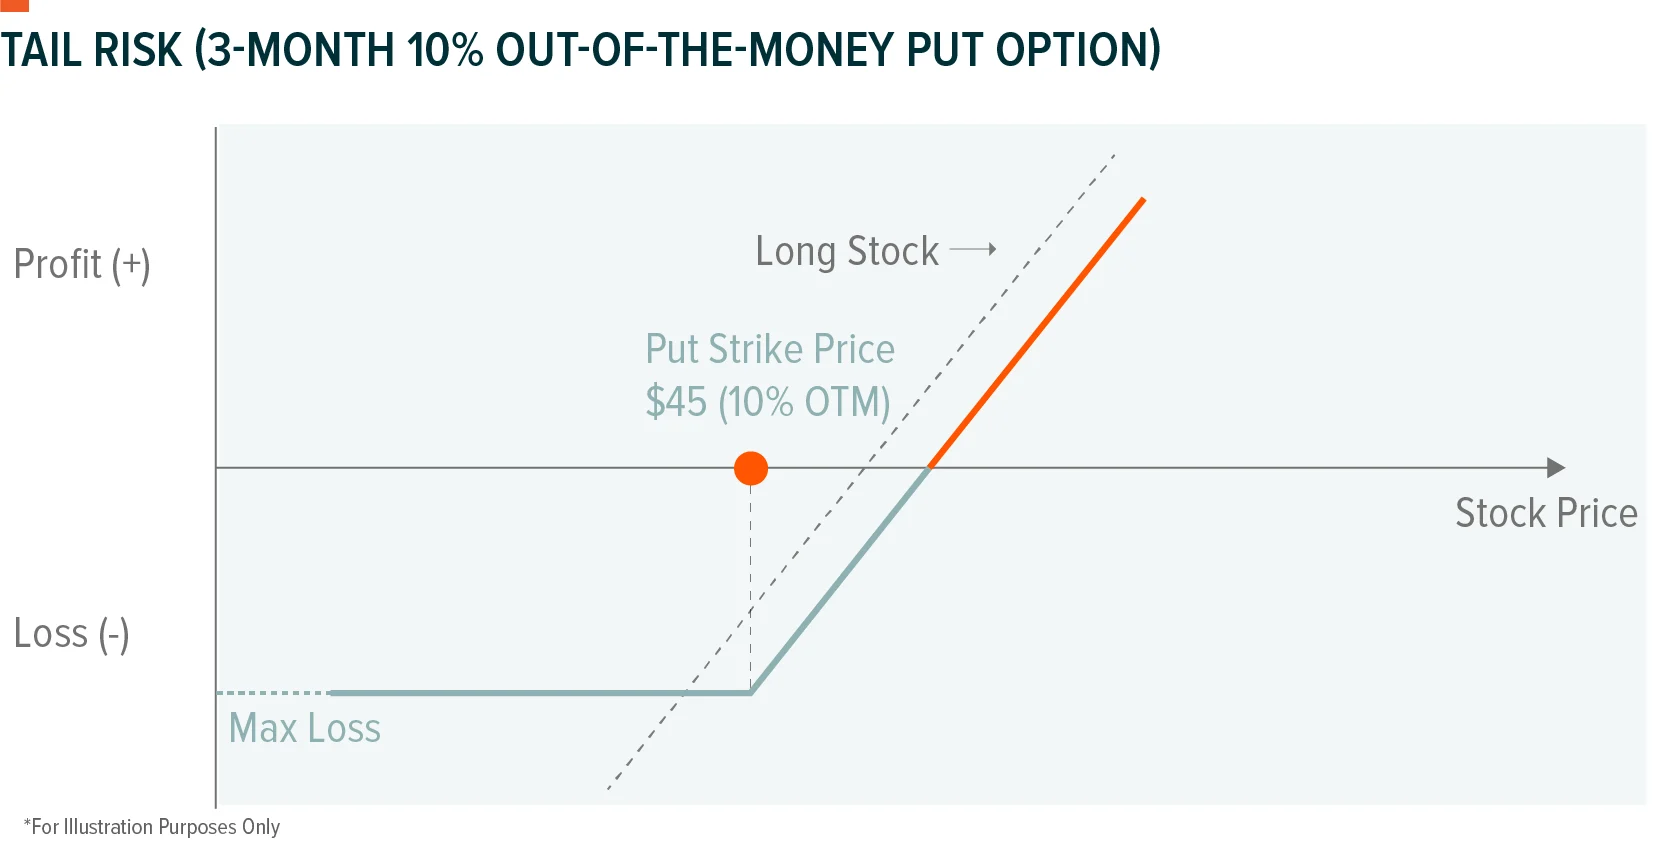
Protective put strategies are also widely used for mitigating downside risks because, when implemented effectively, they can put a floor on losses. A protective put consists of owning a security (or several securities) and purchasing put options on the same asset(s). A put option gives the buyer the right, but not the obligation to sell a security (or several securities) at a pre-determined strike price within a given time frame. In exchange for paying a premium to buy a put option, an investor owns a contract that can rise in value if the underlying security declines.
The cost of buying a put option varies based on several factors, but a major input is the strike price. Generally, the higher the strike price, the more expensive the option, but the greater protection that option affords the investor. For example, buying stock XYZ and an at-the-money (ATM) put option at XYZ’s current share price effectively hedges against downside moves. That said, this can also represent an expensive option for investors and could expire worthless if XYZ rises. The average cost of a 3-month ATM put option on the Nasdaq 100 is a premium of 3.5%. Annualized this would cost about 14%.3
Tail risk strategies are a subset of protective put strategies that typically buy out-of-the-money options with lower strike prices. These options only offer protection if XYZ falls below the strike price of the option, but also cost less to implement on an ongoing basis. For example, a 10% OTM put option will only start to protect against XYZ’s losses once the security falls more than 10% from the time an investor enters the contract. In a 15% selloff for example, the put option would limit losses to 10% and protect against the other 5%.
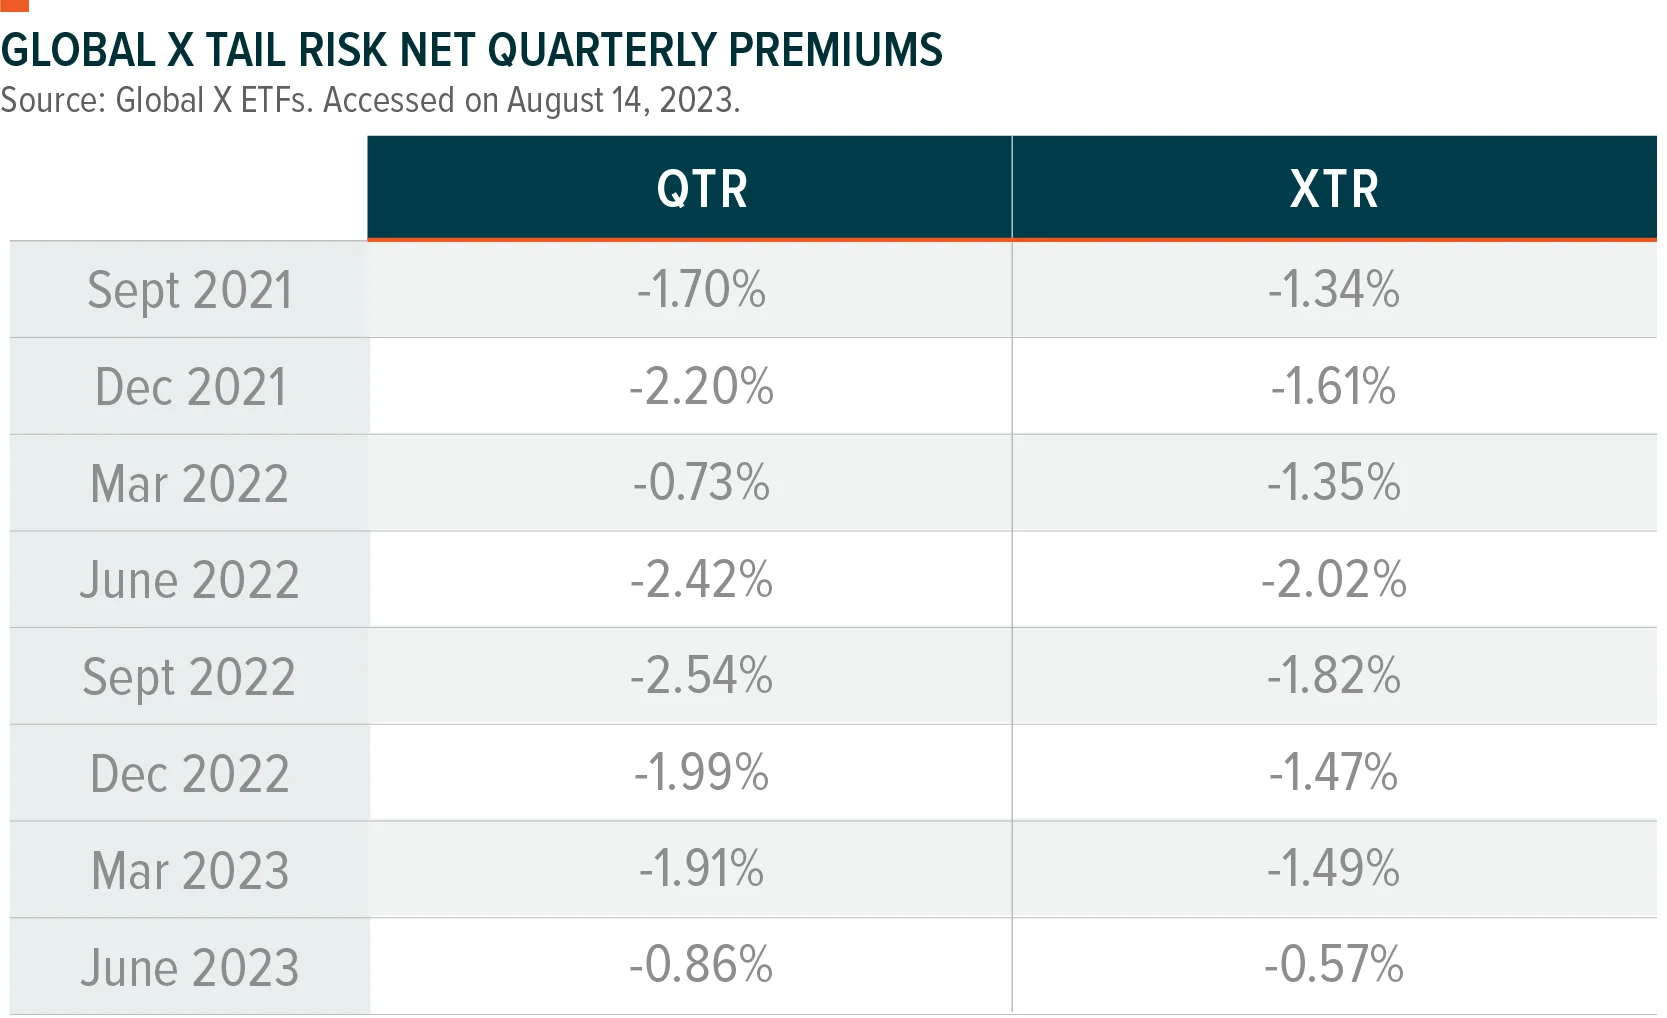
The potential advantage of managing tail risks rather than all downside risks is that the options are generally less expensive. Recently, 3-month at-the-money (ATM) put options on the Nasdaq 100 cost 3.5%, while 10% OTM put options cost about 1.2%.4 This difference can help support long term returns, at the expense of greater short-term drawdown potential. Other factors besides an option’s strike price can also impact the cost of a contract. For example, premiums tend to rise during volatile market periods and longer contract lengths (times to expiration) are also typically more expensive. Below we have provided the historic cost of our tail risk strategies on both the Nasdaq 100 and S&P 500 that buy 10% OTM put options.
Tail risk strategies can vary based on the moneyness of the put options they buy, the time until expiration of the options contracts they purchase, and the underlying securities they take long positions in. For example, rather than investing in stock XYZ and buying an OTM put, a tail risk strategy could own the stocks in a broad equity index like the S&P 500 or Nasdaq 100 and buy OTM index put options.
Core Portfolio Applications for Tail Risk Strategies
Tail risk strategies can be helpful if an investor is anticipating a major drawdown event, but wants to remain invested in case there is continued upside. This could be the case in a strong bull market – such as if an investor believes a bubble may be forming and both wants to participate in price appreciation, but protect against severe drawdowns. It could also prove a sentiment that investors wish to express by making tail risk strategies a core makeup of their portfolios. Indeed, tail risk strategies can make sense for investors looking for the growth characteristics of equities, yet want to potentially avoid major drawdowns. They can also support softer volatility within a broader basket of positions, with beta coefficients associated with QTR and XTR tracking in the .70 and .78 vicinities at the end of the second quarter of 2023.5
Relative to their benchmark indexes, tail risk index strategies will perform differently depending on the market environment. In an upward trending market, tail risk strategies will likely underperform because of the cost of the premiums paid to purchase the put options. In a sideways market, underperformance is possible too, given these put option costs. That said, in a severe downward market, tail risk strategies are designed to outperform. This is exemplified by the downside capture ratios associated with QTR and XTR, which were roughly 75 and 83 at the end of Q2, respectively.6
As the COVID-19 pandemic showed, the risk of an unknown black swan event could always be looming on the horizon. After a decade-plus of an equity market bull run, the risk of a market correction is always present. For risk-averse investors, this may represent justification for incurring the expense associated with put option purchasing.
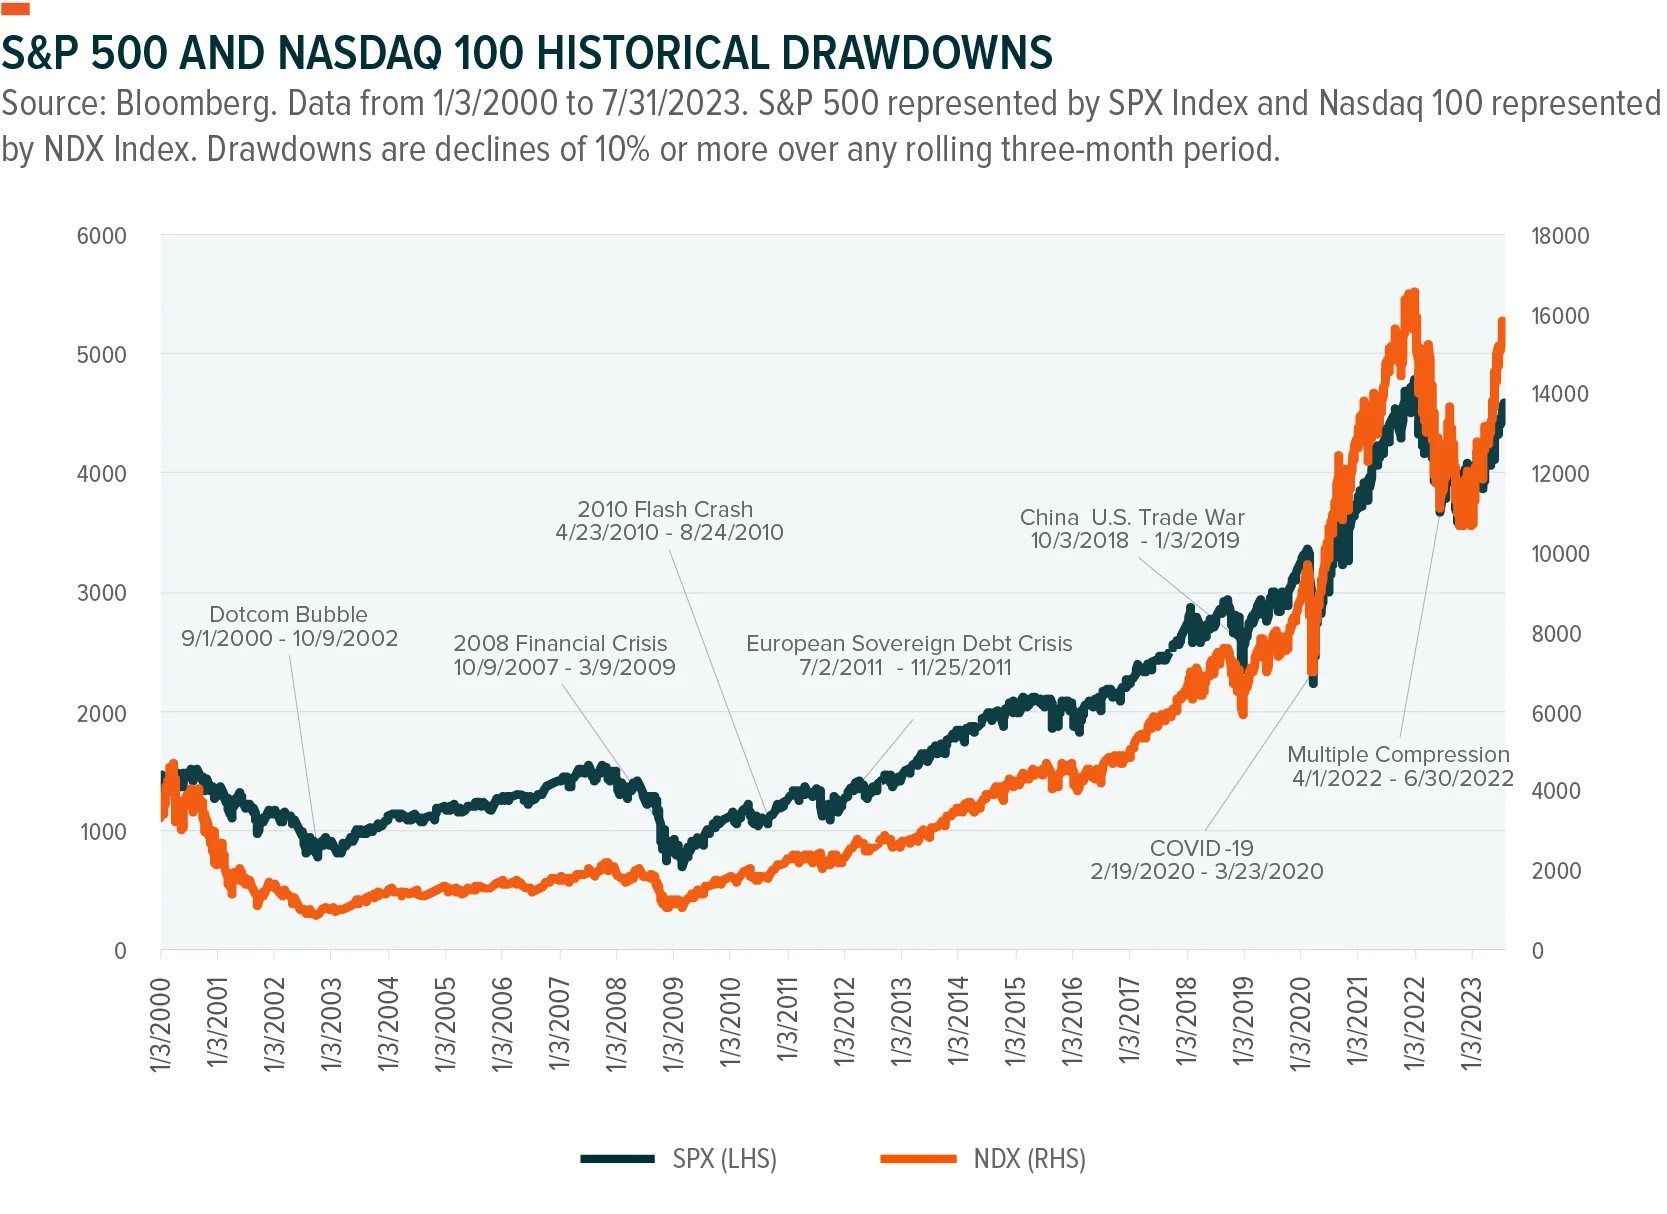
On one hand, a resilient jobs market and potentially plateauing interest rates paints a supportive picture for equities in the near term. And over the long term, investors have historically been rewarded for staying invested. The Nasdaq 100 and S&P 500 offered 20-year annualized returns of 15.69% and 9.11%, respectively through the beginning of 2023.7
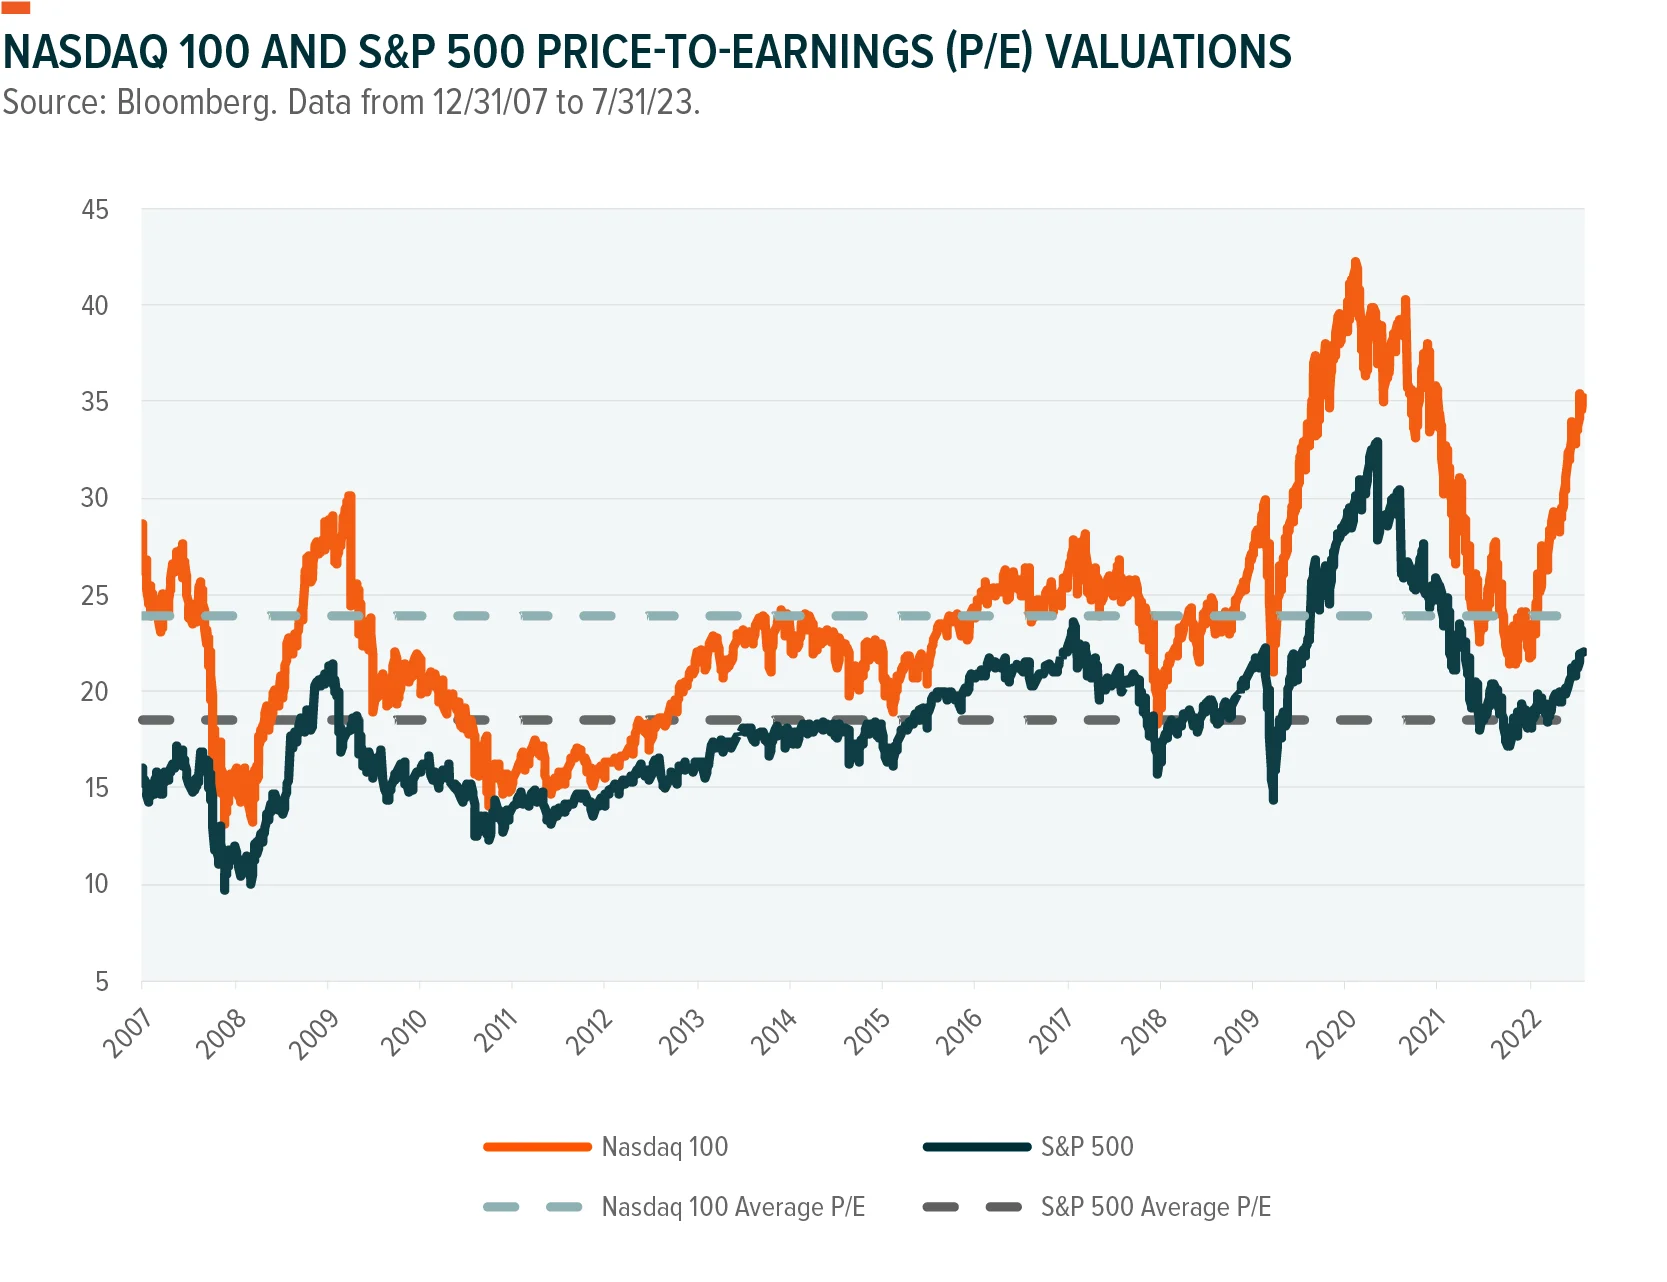
On the other hand, investors should always be prepared for a potential market correction. The Nasdaq 100 declined by -80% in the dotcom bubble, for example.8 This may be an extreme event, but as the chart above shows there have been over a handful of double-digit drawdowns for the Nasdaq 100 and S&P 500 in the past two decades. The odds of a tail risk event could also be elevated due to historically high valuations.
Global X Tail Risk Strategies, Explained
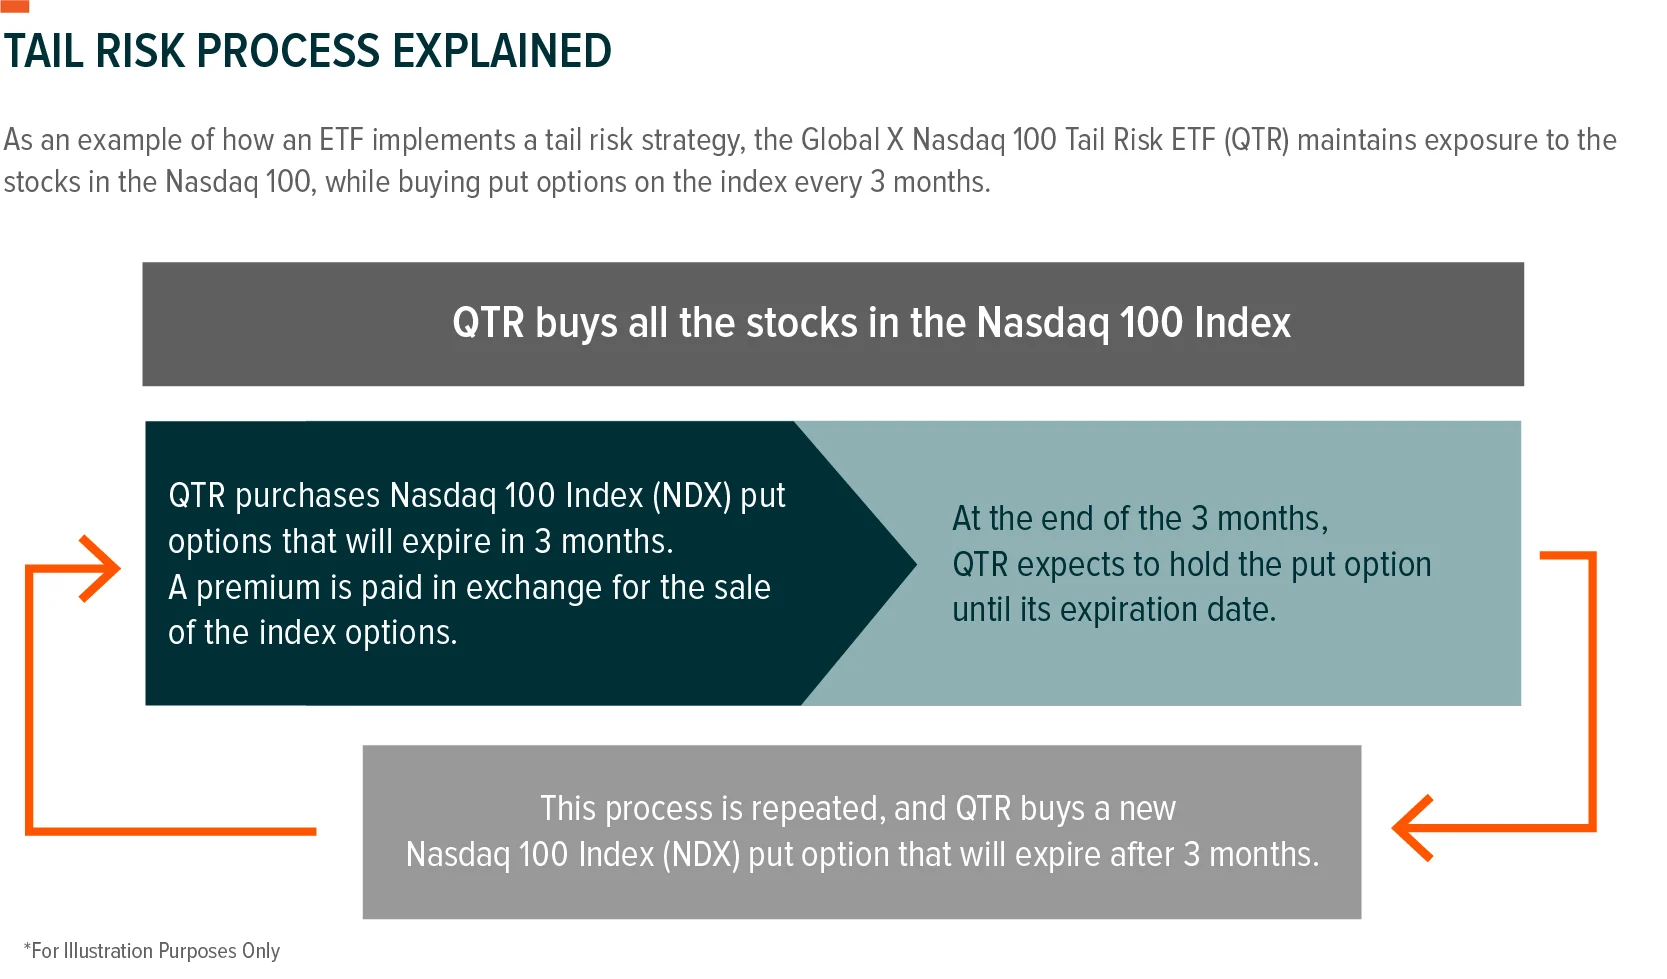
QTR and XTR are passive ETFs that implement systematic strategies designed to provide tail risk protection on the Nasdaq 100 and S&P 500 indexes, respectively. Both funds follow similar processes, but are designed to offer a tail risk strategy on different underlying indexes. Using QTR as an example, Global X portfolio managers replicate the Nasdaq 100 Index by purchasing each of the stocks in their assigned weights. They then purchase index put options on the Nasdaq 100 Index with a strike price that is 10% “out-of-the-money” (OTM), meaning 10% below current market price, with an expiration date 3 months from the purchase date. Every three months, the portfolio managers ‘roll’ the options positions, meaning closing existing options positions and simultaneously opening a new position in the same option. If the put options are “in-the-money” (ITM), meaning strike price is greater than the current market price at the time of expiration, they will be exercised and settled in cash. If they are OTM, they will expire worthless. Once the previous put option is settled, the process is repeated by entering into a new 10% OTM put option with a new three-month expiration.
Conclusion
While markets tend to rise over the long term, severe drawdowns have occurred with greater regularity than expected. Tail risk strategies can help provide investors with a means to mitigate potential downside risks, while also participating in rising markets. Investors may be wise to prepare for such risks, and can use QTR and XTR as core holdings in their portfolio to effectively implement tail risk strategies.
Related ETFs
QTR - Global X Nasdaq 100 Tail Risk ETF
XTR- Global X S&P 500 Tail Risk ETF
Click the fund name above to view current holdings. Holdings are subject to change. Current and future holdings are subject to risk.