
Skip to Main Content
Subscribe to Newsletters
Global X Logo
Search
Content loaded

Explore

Our ETFs

Investment Insights

Product ResearchCharting DisruptionMidyear Outlook 2026

Investor Resources

EducationHow to InvestTax Resources

About Us

About Global XNewsroomCareersContact Us

Follow Us

socaial media icon for LinkedInLinkedInSocial media icon for X (twitter)XSocial media icon for FacebookFacebookSocial media icon for InstagramInstagramSocial media icon for Youtube

Copyright © 2026 Global X. All rights reserved.

Privacy PolicyAccessibility Statement
YouTube

Subscribe to our newsletter

Get the latest news and updates from our team.

Subscribe

SEI Investments Distribution Co. (1 Freedom Valley Drive, Oaks, PA, 19456) is the distributor for the Global X Funds.

Check the background of SIDCO and Global X's Registered Representatives on FINRA's BrokerCheck.

Content
Product ResearchFixed Income StrategiesCore

Through the Systematic Lens: Is Fixed Income a Dead Asset Walking?

x
B
Benjamin LavineSenior Investment Strategist
Jul 20, 2026·8 min read

“The reports of my death have been greatly exaggerated,” Mark Twain, 1897

Towards the middle of May 2026, traditional fixed income had been on track for posting a 1st half 2026 loss1, with duration risk failing to provide the portfolio ballast it historically has during equity volatility, as the recent Strait of Hormuz episode illustrated. Rising global interest rates have reignited the debate over whether conventional fixed income remains relevant in a world of structurally higher inflation, unchecked government spending, and elevated geopolitical risk.

Compounding the rate challenge, credit valuations in investment grade corporate bonds are stretched beyond pre-COVID levels, leaving investors with less compensation for default risk than at virtually any prior point in the cycle.

The result is a conflicted landscape: real (inflation-adjusted) yields on longer-duration government debt are more attractive than they've been in years, yet the case for reaching into credit is weaker than ever. Does today's fixed income market adequately compensate investors for risks that were less prominent during the disinflationary period between the 2008 Financial Crisis and 2020 pandemic shutdown?

Key Takeaways

  • The Iran conflict is unlikely to cause lasting disruption to U.S. economic fundamentals. Higher input costs may eventually soften consumer demand and corporate investment, which could, in turn, ease the inflationary pressures currently being priced into the bond market.

  • Rising real yields can support returns across fixed income sectors, even richly valued ones. In the absence of a meaningful economic downturn, we believe credit spreads are likely to remain range-bound from current levels.

  • Despite the complexity of today's backdrop, the rate environment may present a compelling entry point for fixed income broadly. A diversified fixed income program, spanning both traditional and non-traditional sectors, can be constructed in an effort to capture the current yield opportunity while selectively adding incremental yield beyond government debt.

Climbing the Inflation Wall of Worry

After recovering from steep 2022 losses, fixed income is facing challenges. After having dropped to just over 1% year-to-date (YTD) through mid-May (5/19/2026), the Bloomberg US Aggregate Index ended the first half of 2026 up 0.60% through 6/30/2026, with the Bloomberg US Long Treasury Index up 0.44% YTD after having dropped over 3% YTD through 5/19/2026 (source: Bloomberg). Once again, yield curves steepening and duration risks had re-emerged as total return detractors for allocators.

The year began with optimism. Spending on Artificial Intelligence (AI) and anticipated Federal Reserve (Fed) rate cuts (up to three 0.25% reductions through the end of 2026 from the 3.75% Fed Overnight Rate)2 set a constructive tone for both equities and fixed income. While the AI spending narrative has accelerated, the outlook for Fed easing in 2026 has since reversed sharply. Strong economic data following the 3Q2025 government shutdown, combined with the March 2026 Strait of Hormuz (SoH) conflict, has reignited inflationary pressures globally, pushing central bank expectations from easing back toward tightening.

The near-term inflation picture is unambiguously elevated. The SoH conflict has disrupted not just energy exports but critical feedstock inputs including alumina, sulfuric acid, and helium, the latter being a key input in semiconductor manufacturing. These supply constraints risk cascading into knock-on effects across fuel, fertilizer, and intermediate industrial goods, driving inflation expectations higher and compounding investors' already cautious stance toward fixed income following 2022's historic selloff that had been catalyzed by high inflation not experienced since the 1980s.

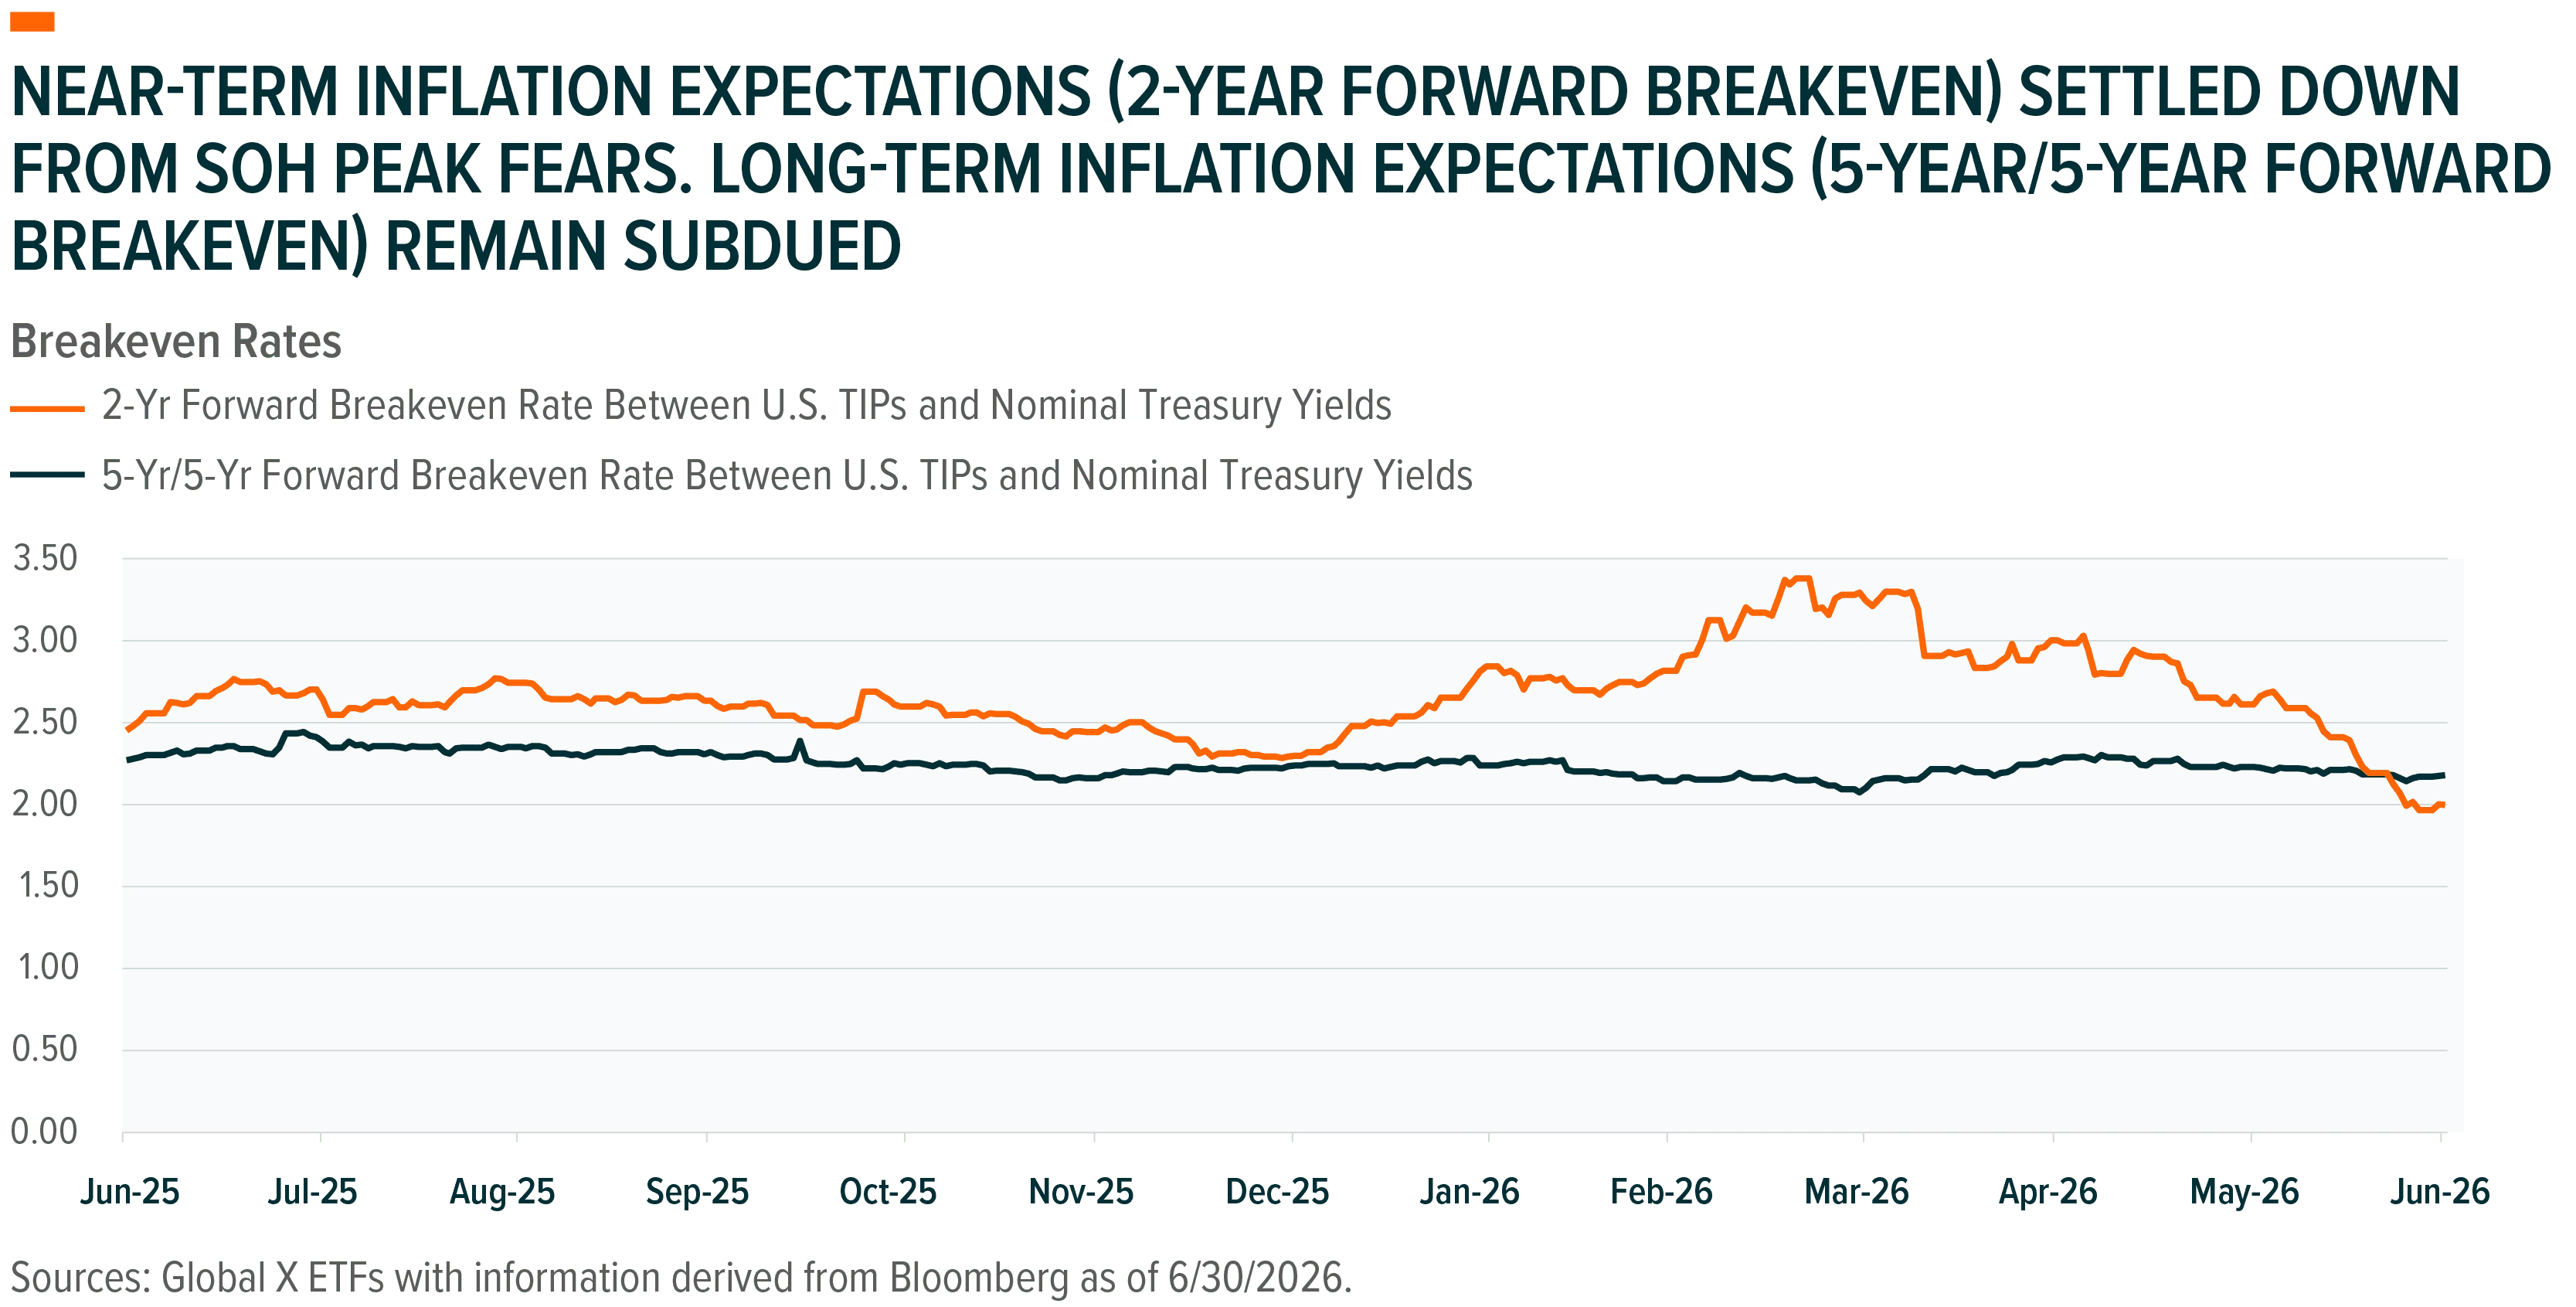
Near-term inflation readings will likely determine whether the Fed keeps rates on hold or acts to raise rates. TIPS-implied 2-year breakeven inflation rates spiked to 3.4% at the height of the SoH conflict before settling at 2.2% as of 6/30/2026 (source: Bloomberg), which is still above the Fed's 2% long-term inflation target3. Notably, longer-term inflation expectations remain better anchored, with the 5-Year/5-Year Forward Breakeven Rate at 2.2%, suggesting the market is not yet pricing in a permanent inflation regime shift.
260707 - Fixed Income Dead Asset 01

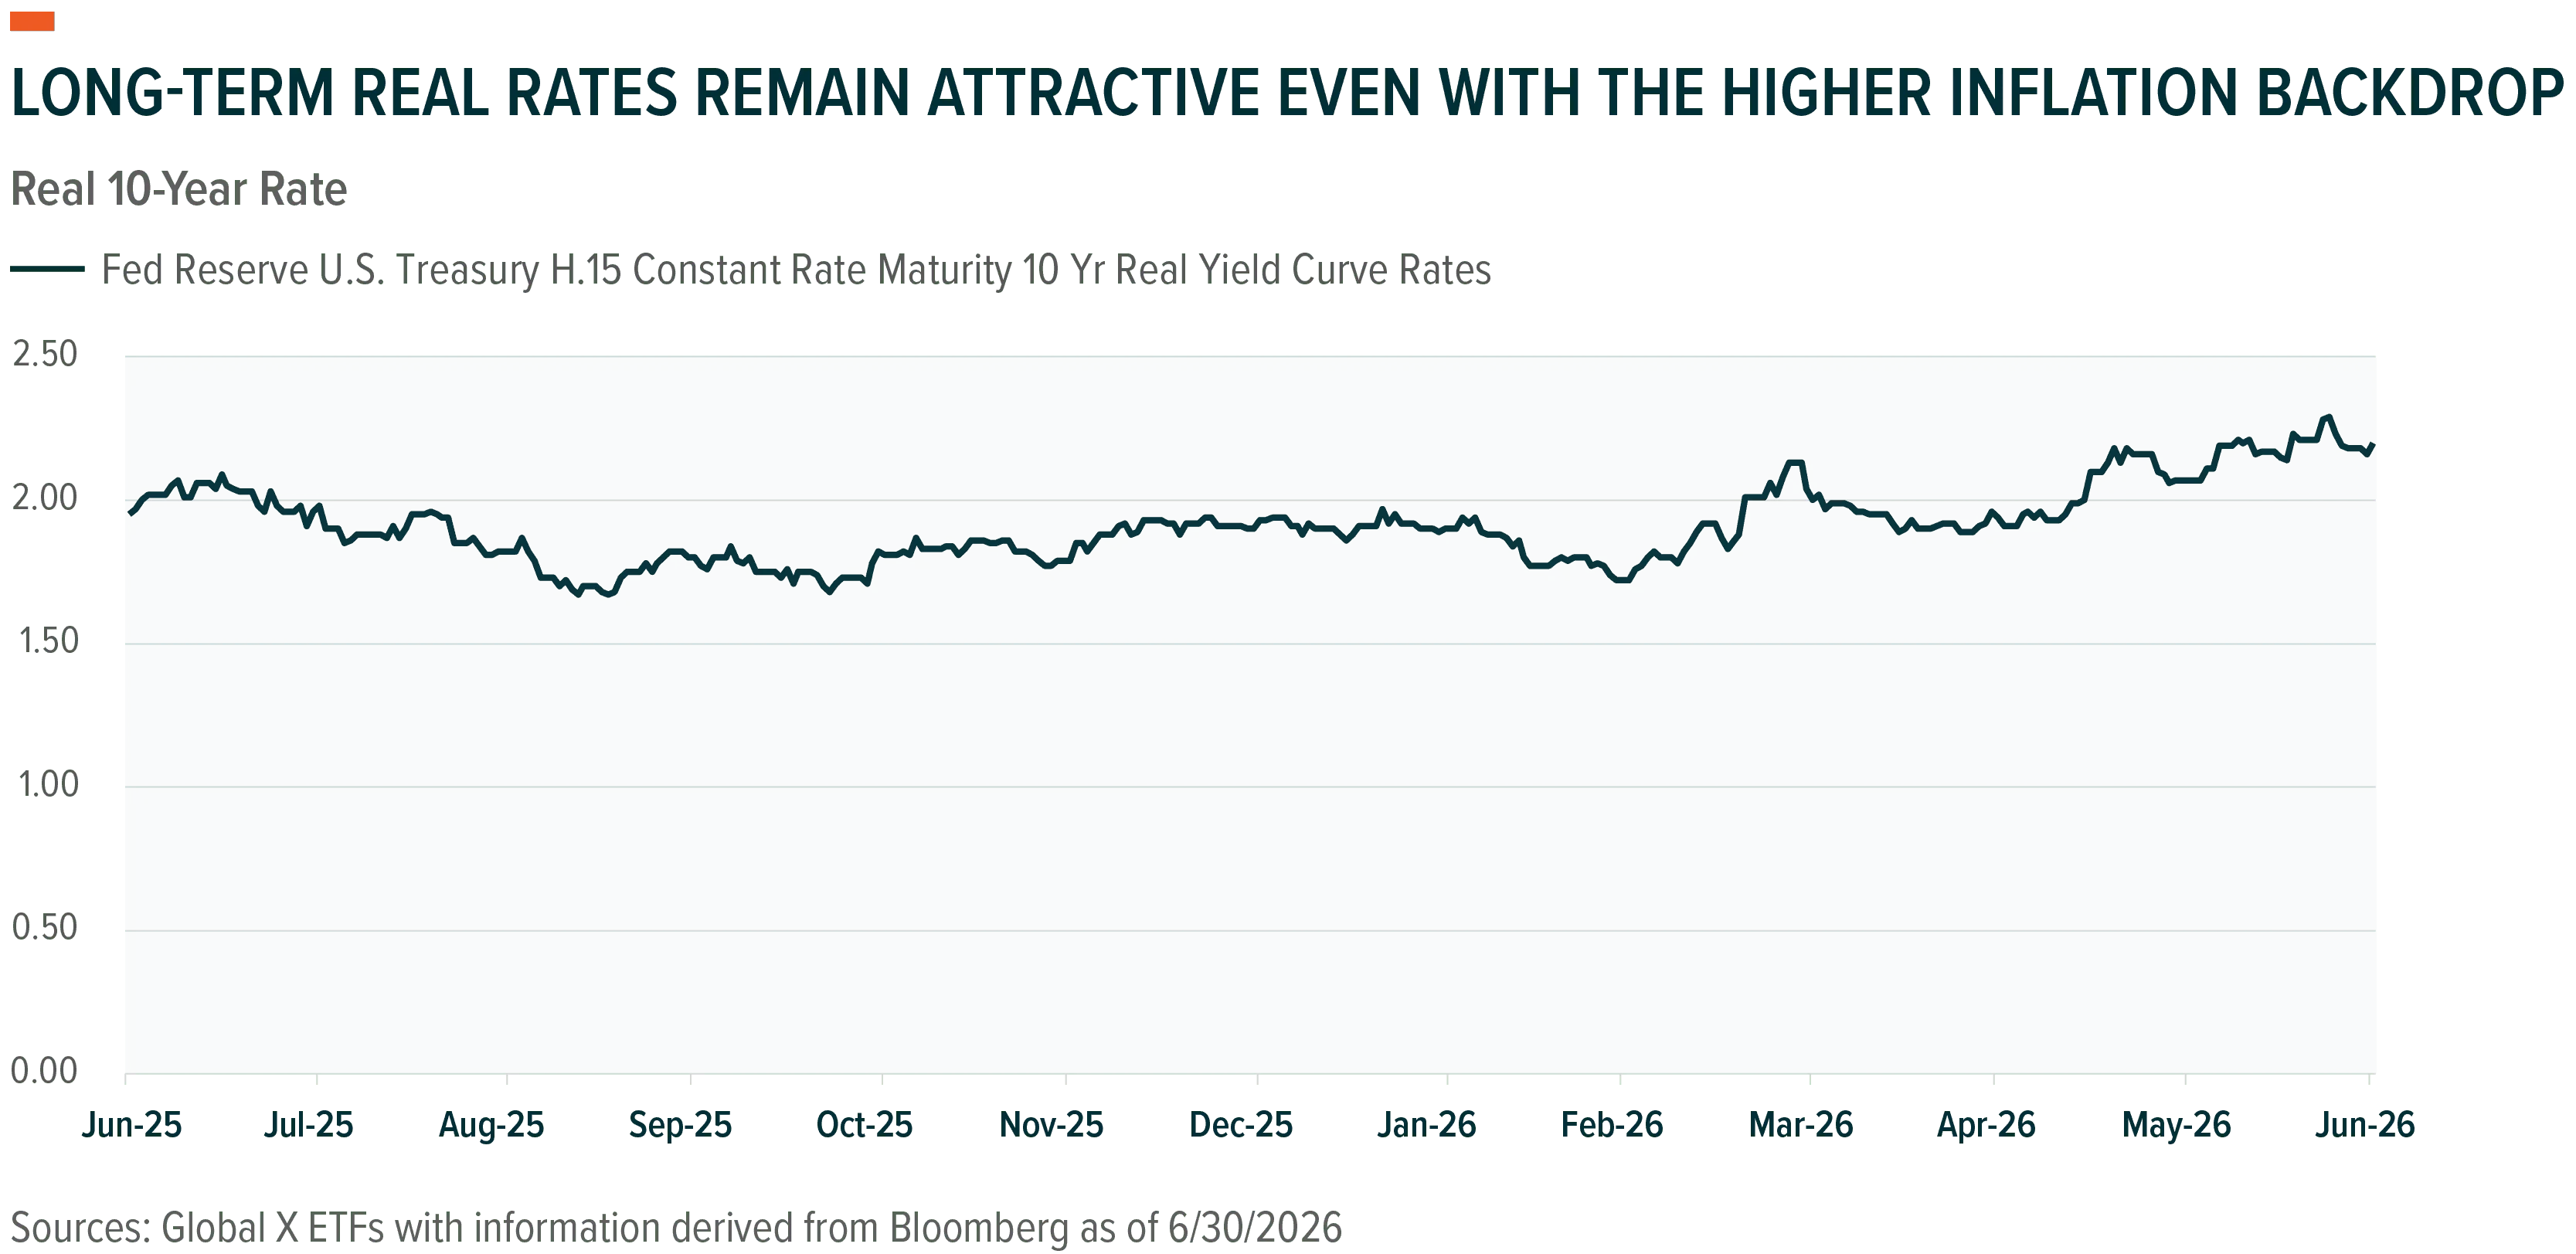
Long-term inflation expectations are the key input into the real interest rate when distilling the risk premium associated with holding long-term debt maturities. Based on the 10-Year Constant Real Rate monitored by the Federal Reserve, real interest rates remain at elevated levels as long-term nominal yields have risen with rising inflation expectations.
260707 - Fixed Income Dead Asset 02

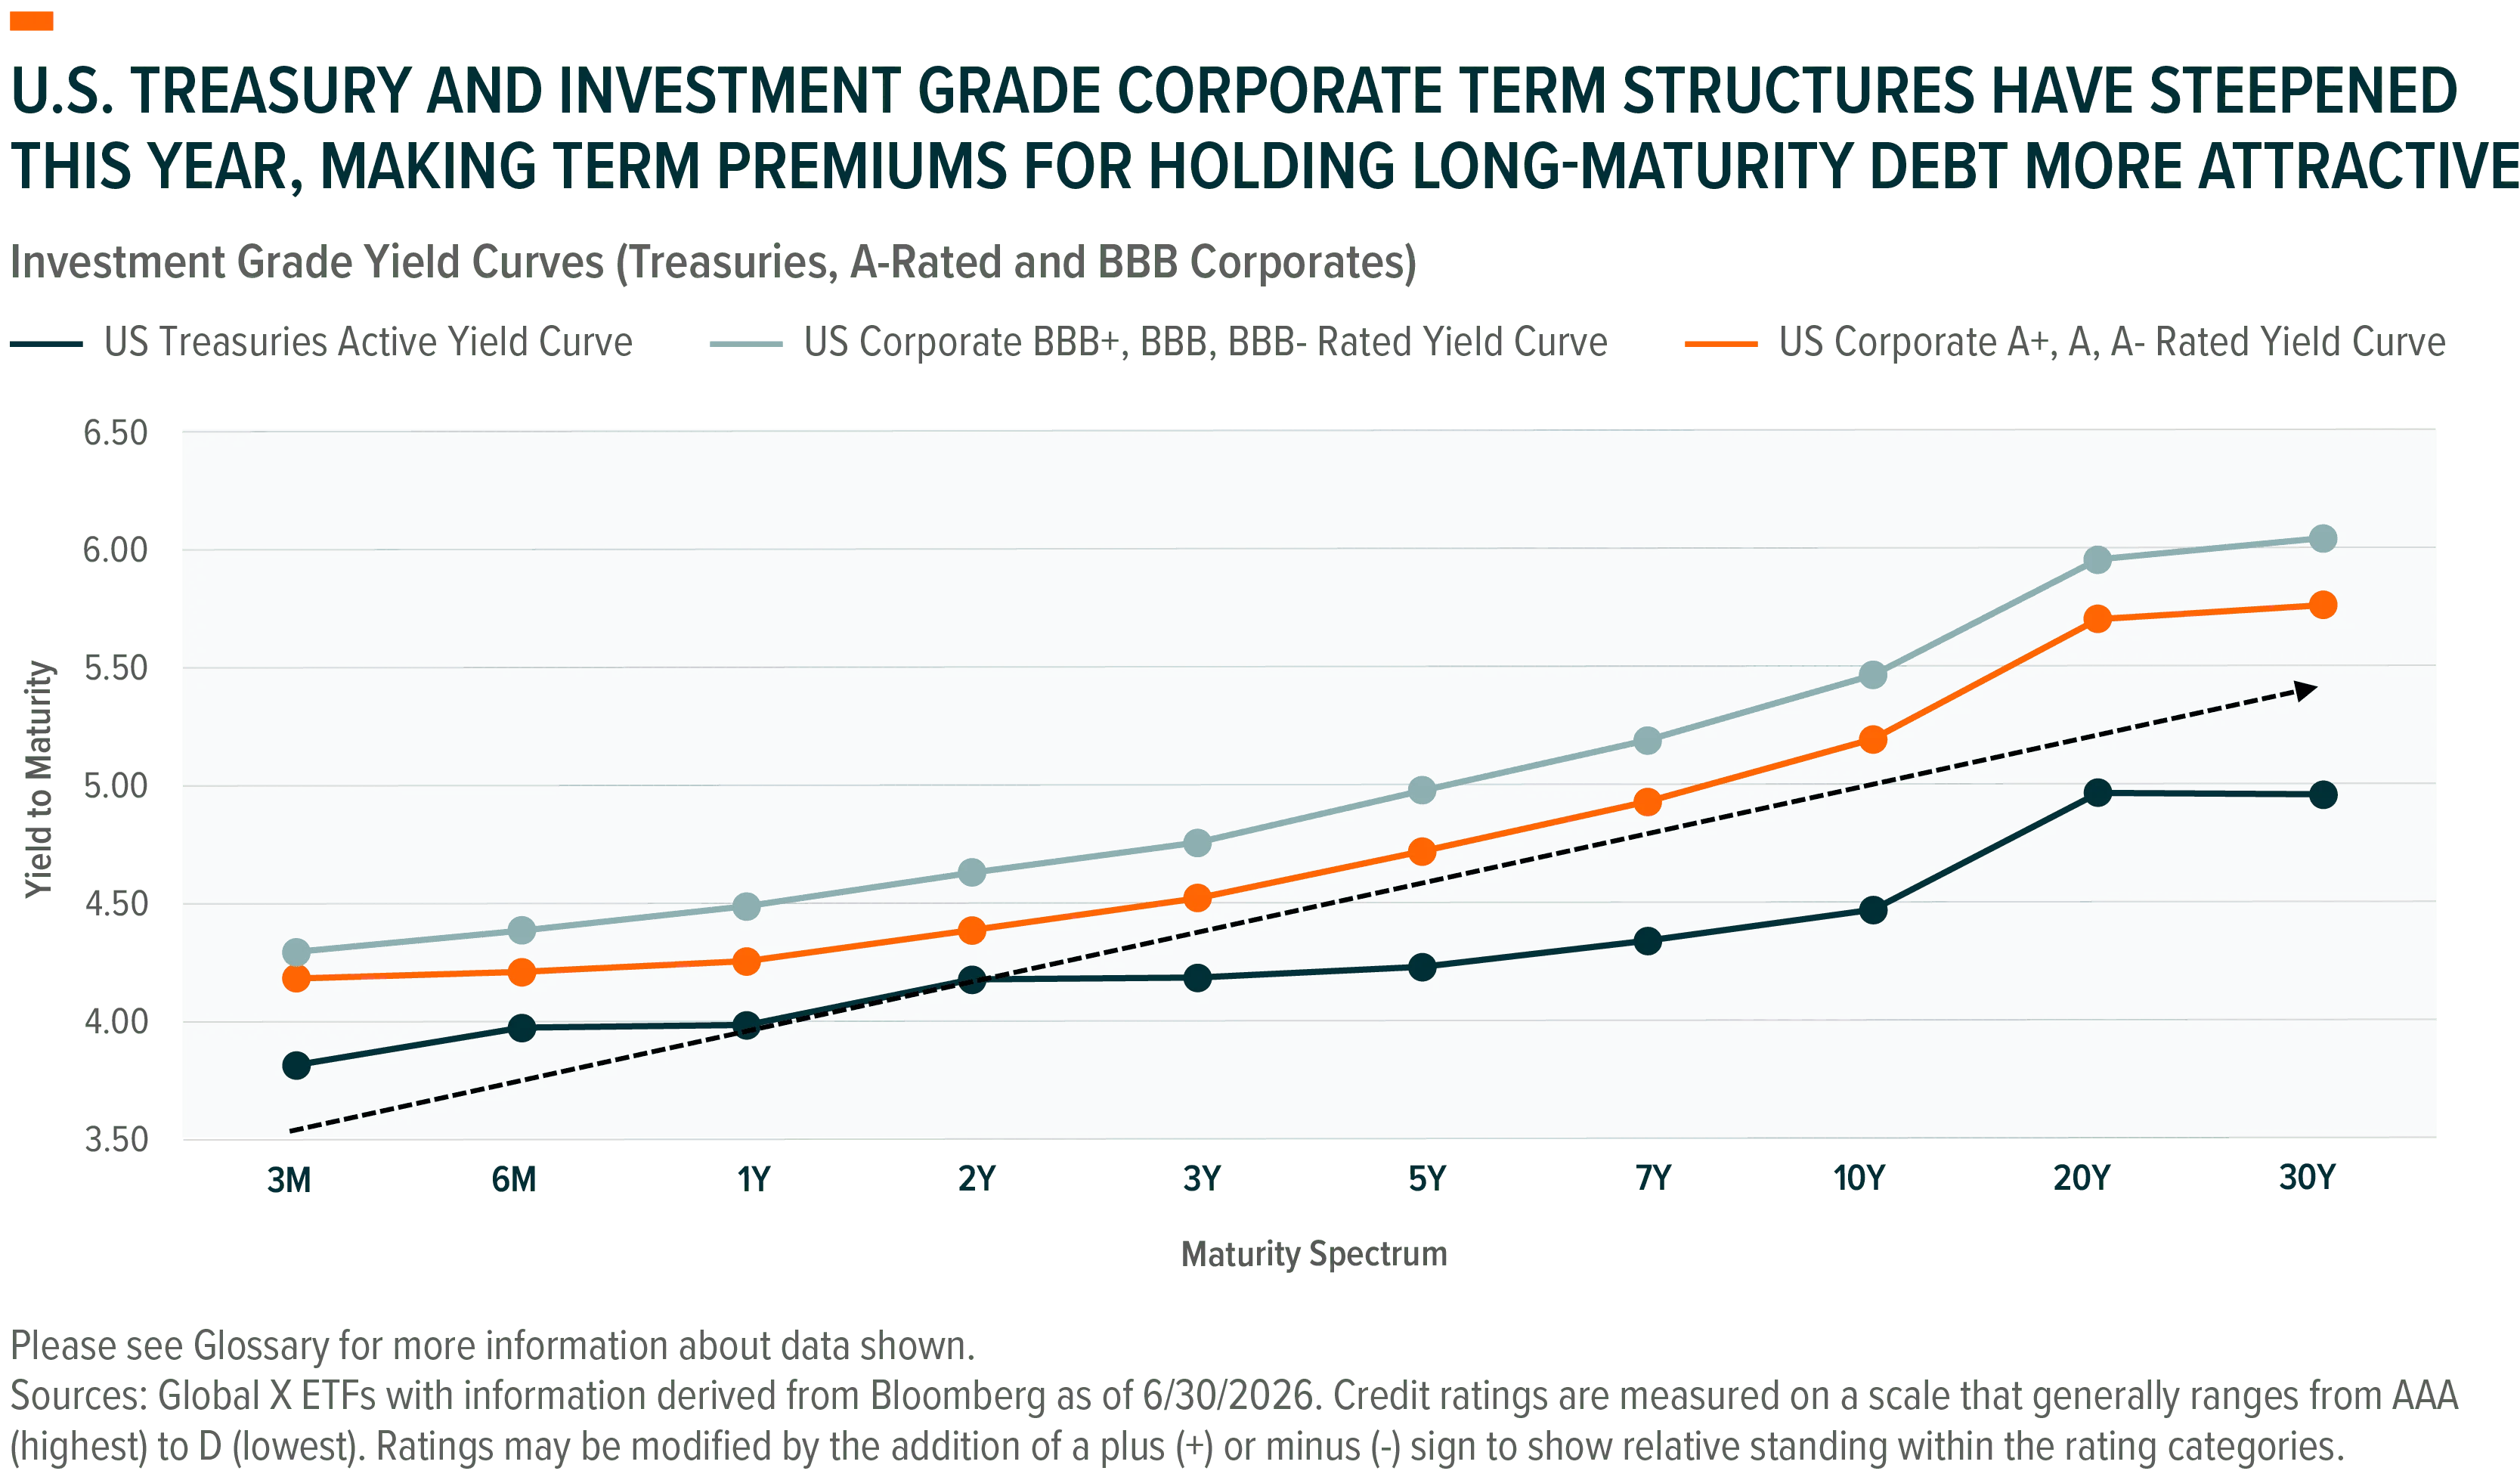
Despite this diminished backdrop for holding long duration risk, real rates remain attractive at above 2%, presuming that the Fed maintains its inflation-fighting credibility. Widening term premiums as compensation for holding long-term debt have made duration risk more attractive from a valuation standpoint. Investors are now being compensated for much of the risk priced into fixed income.
260707 - Fixed Income Dead Asset 03

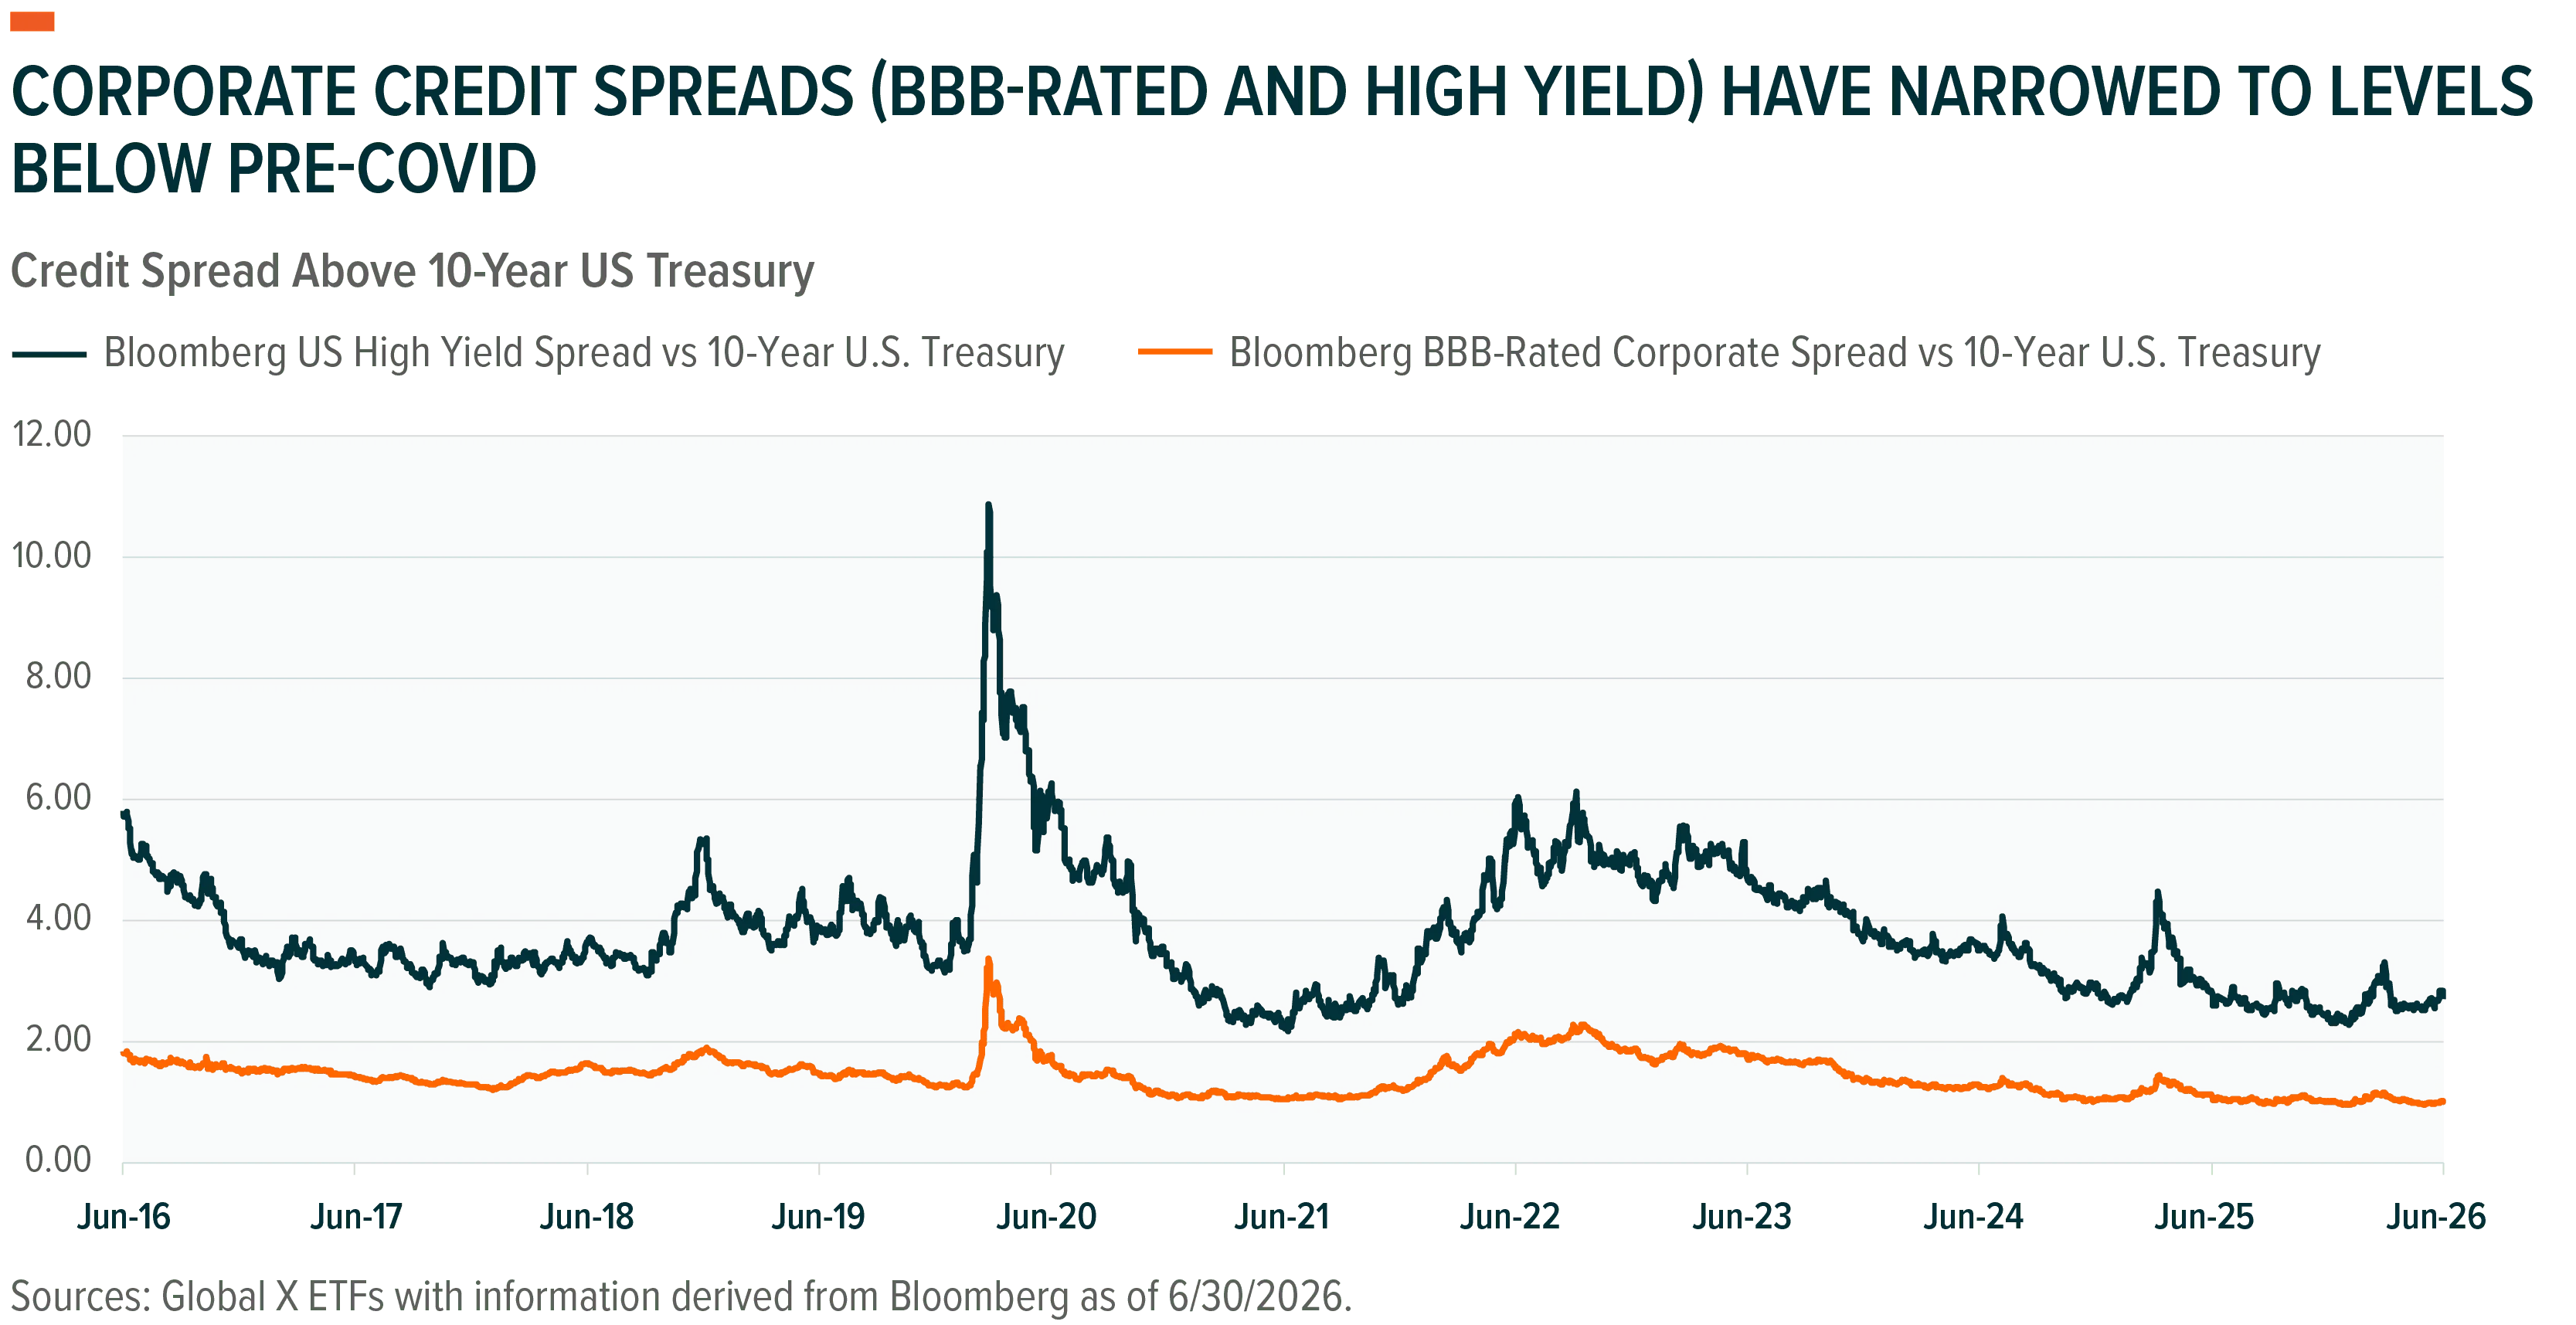
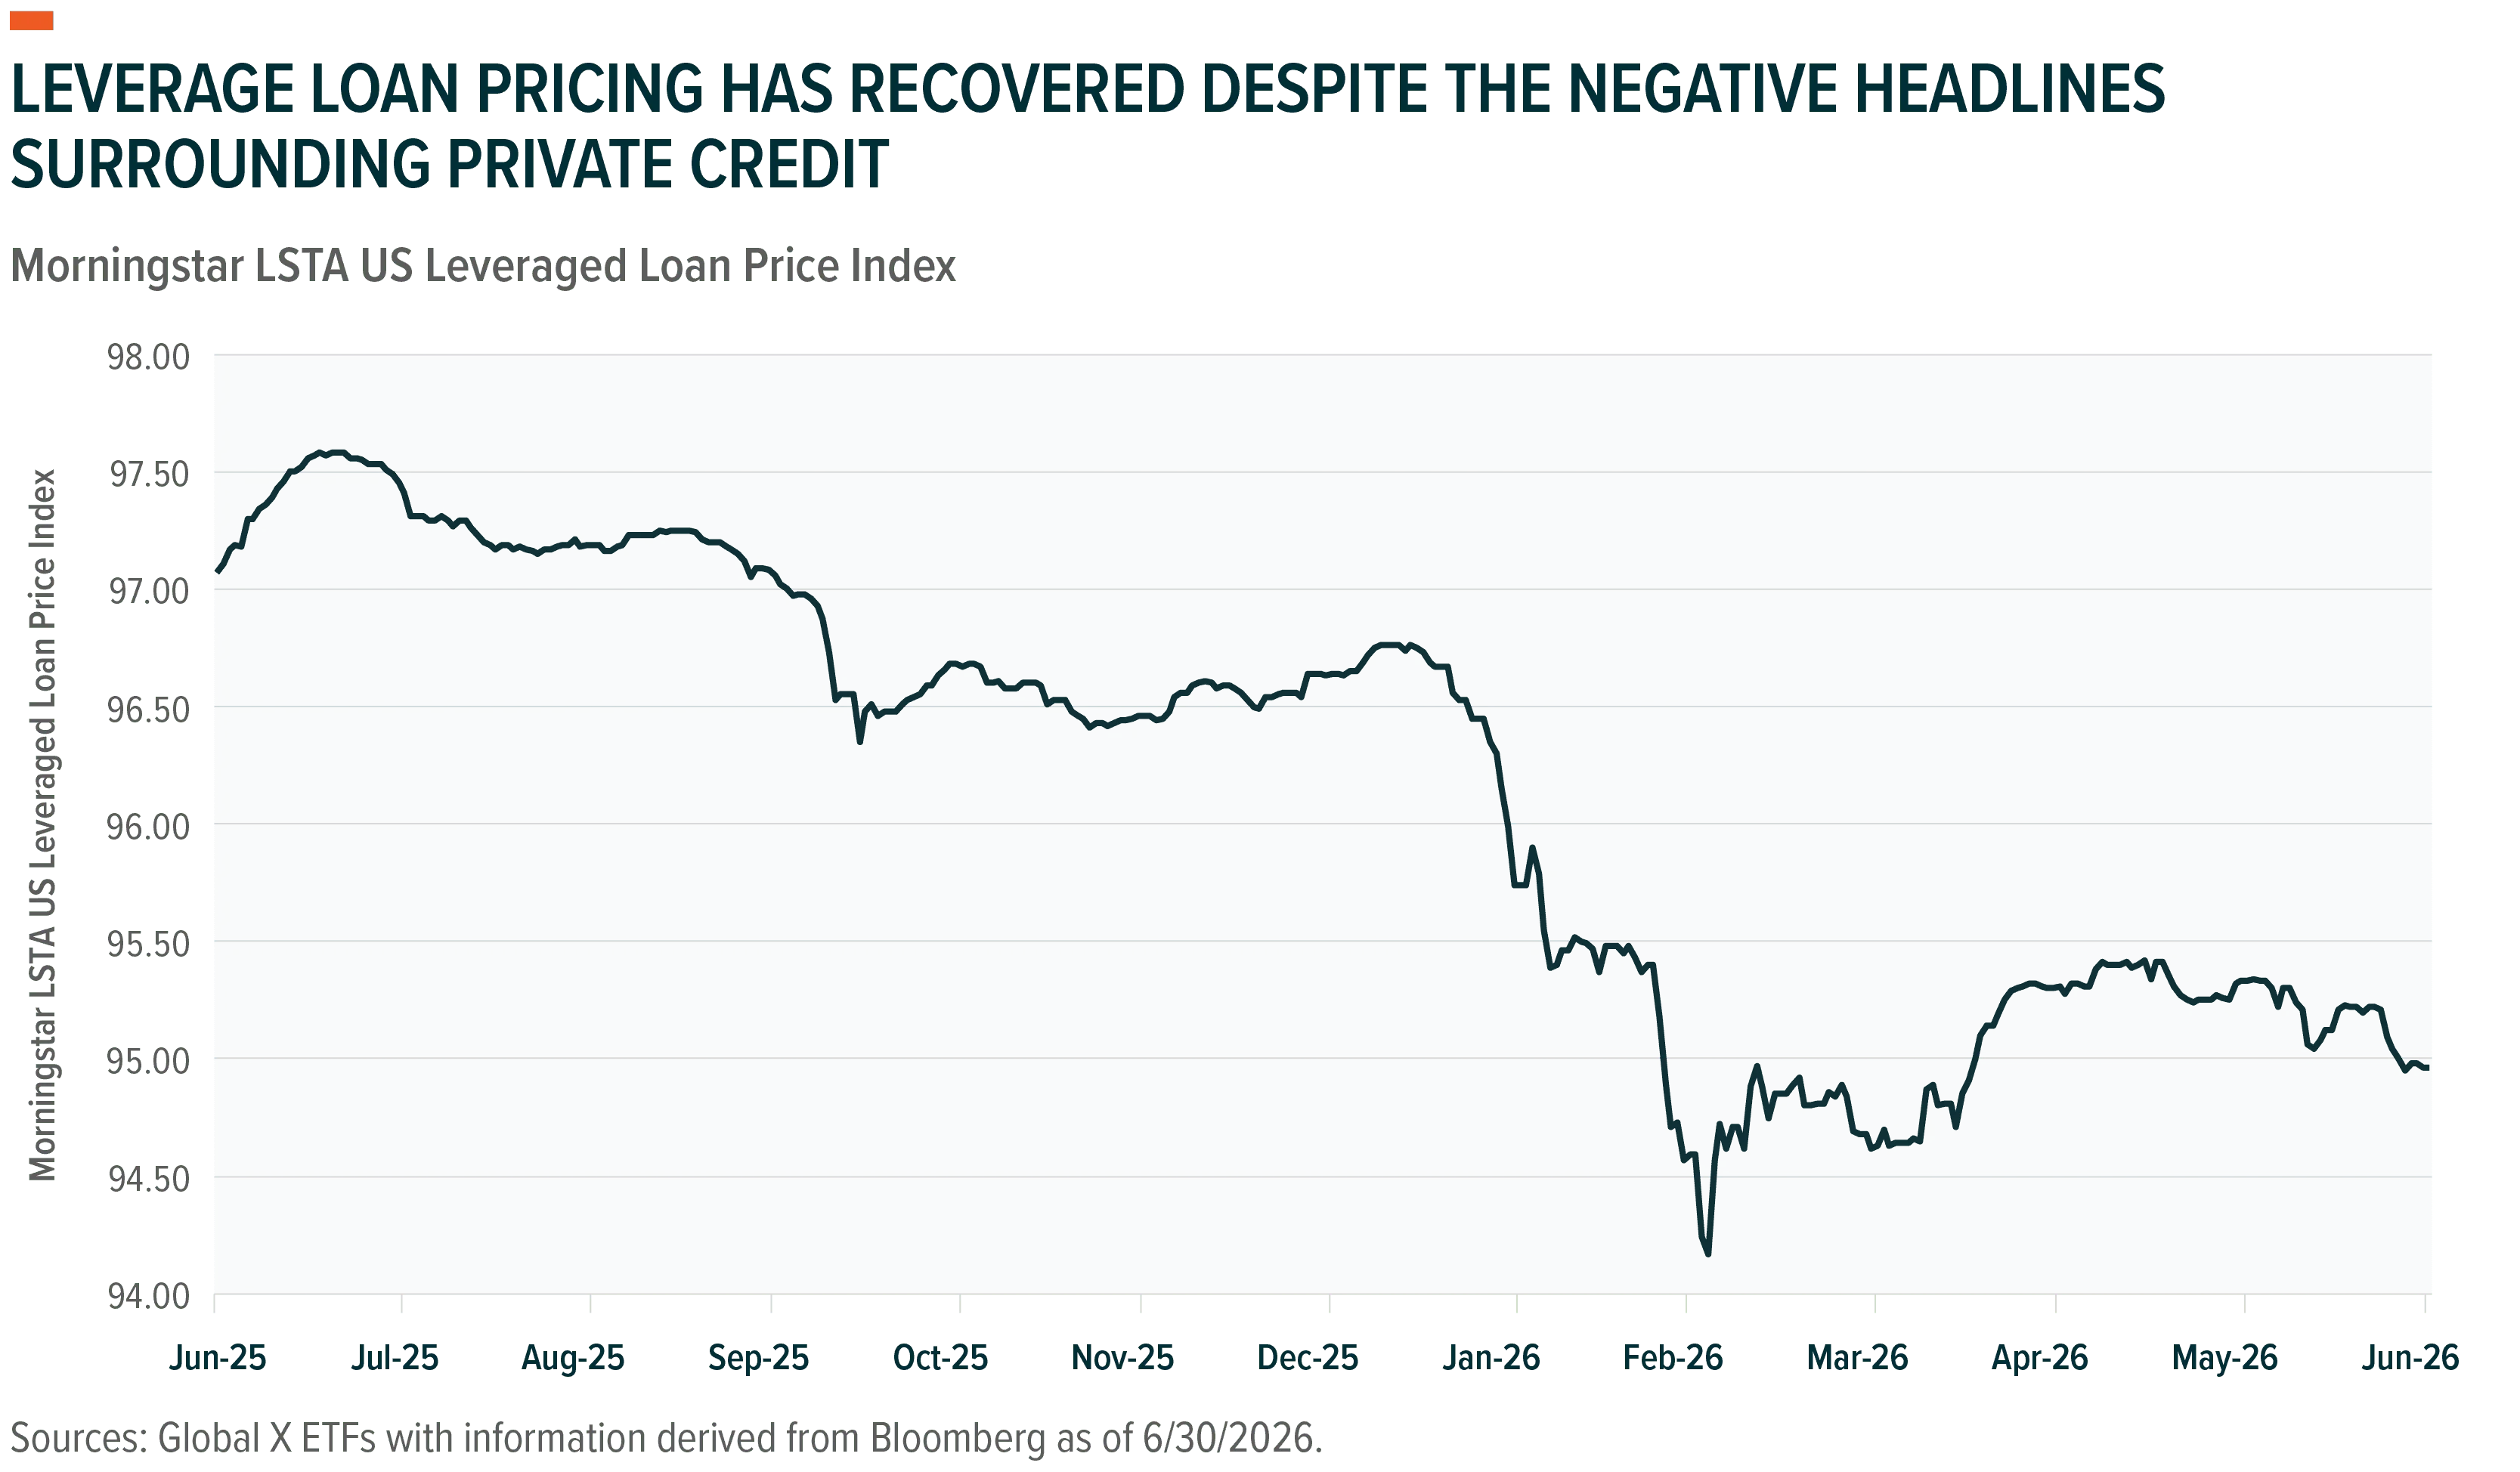
Yet, greater compensation (yield) for taking on interest rate risk is being partially offset by lesser compensation for taking on credit (default) risk. Corporate credit spreads versus 10-Year U.S. Treasury yields have narrowed from their SoH stress highs, as a strong economic backdrop is supportive of credit risk while the headline pressures weighing on private credit may be alleviating, based on the recovery of leveraged loan prices, a public proxy for private credit valuations.
260707 - Fixed Income Dead Asset 04260707 - Fixed Income Dead Asset 05

Despite a brief spread widening during the Iran conflict, corporate credit spreads have since retraced to near pre-COVID lows. Resilient economic growth and strong corporate earnings, largely AI infrastructure-driven, have kept investors positioned in credit over sovereigns. Agentic AI coding tools continue to threaten established software providers, pressuring both equity valuations and debt, particularly for private credit borrowers taken private at peak 2021–2022 valuations, who now face refinancing at higher rates and lower multiples. Narrow credit spreads and private credit headline risks make us cautious on high yield and would lead us to favor investment grade credit for defensive positioning.

Catching the Fixed Income Bird-In-Hand

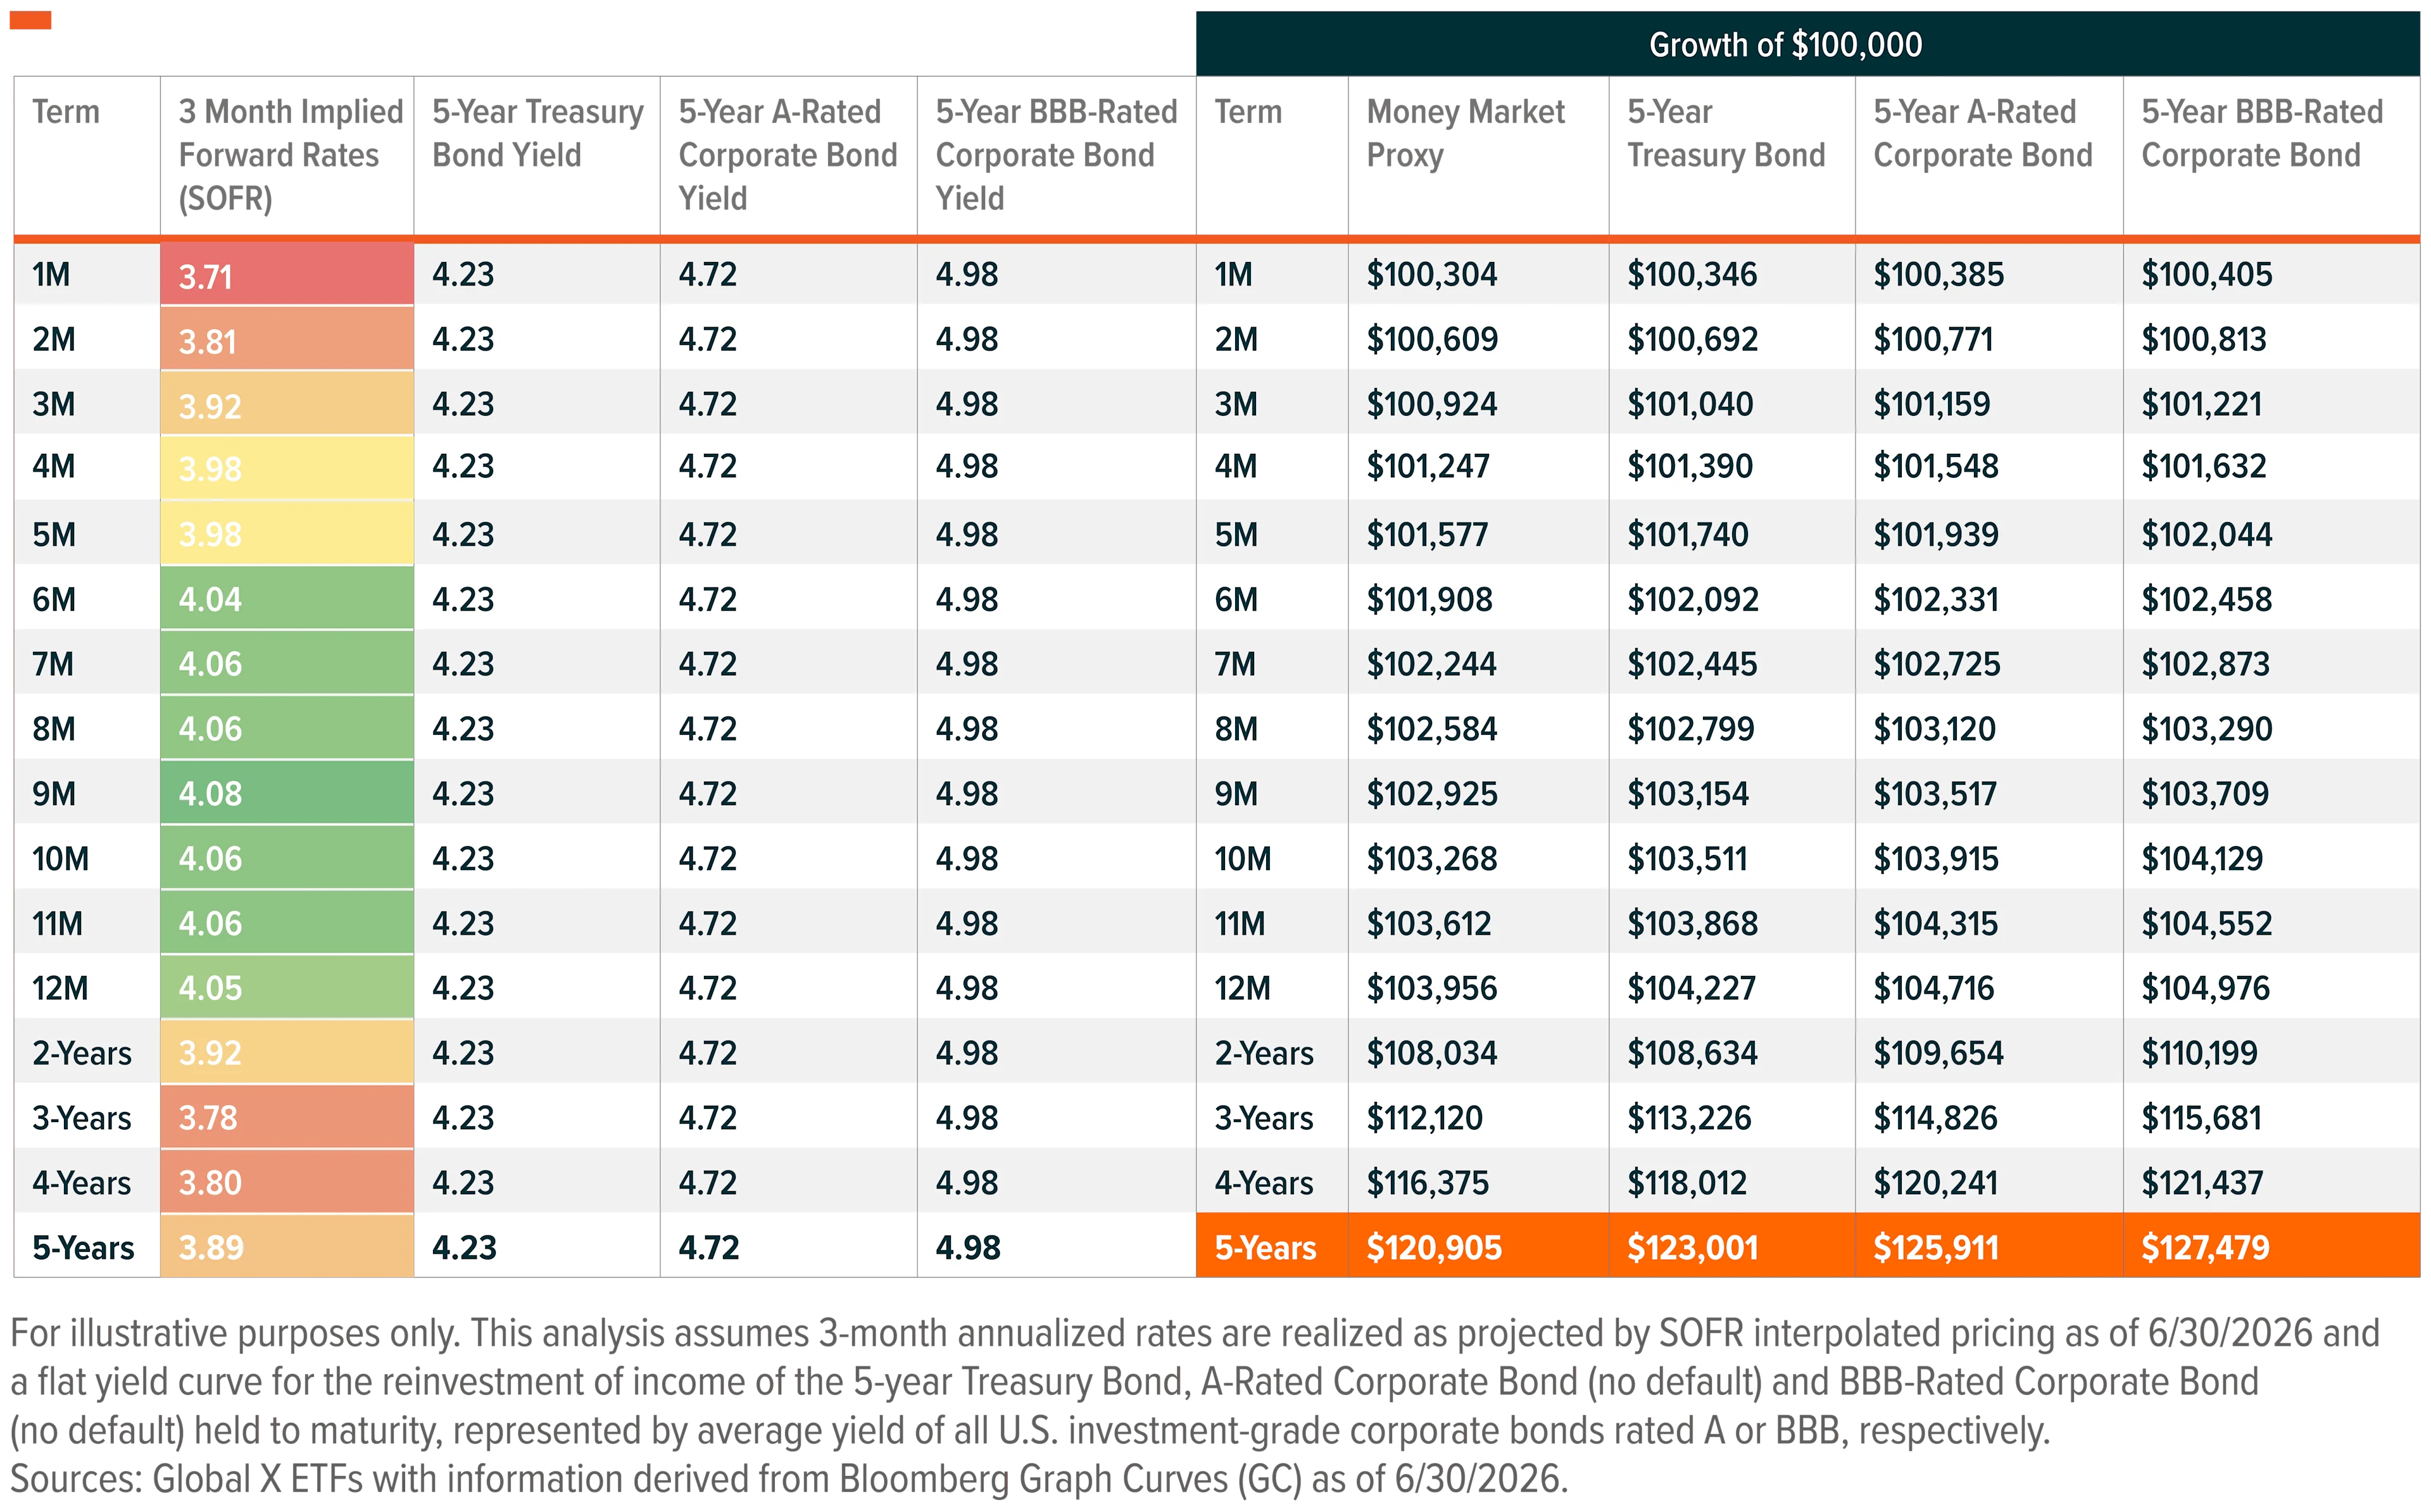
Today's steeper yield curve means investors no longer face the multi-year wait for intermediate-term bonds to outpace money market returns. Measured against 3-month Secured Overnight Financing Rate (SOFR), a reliable proxy for current and anticipated interest rates underpinning money market funds, both 5-Year Treasuries and 5-Year Corporate Bonds (A- and BBB-rated)4 currently provide a higher yield and those higher yields can be compounded as the interest rate futures market prices in not only a Fed pause on further rate cuts, but now a growing probability of rate hikes over the coming year.

Should fears of future rate hikes prove unfounded, holders of longer-maturity debt stand to benefit from potential price appreciation as well, adding a potential return tailwind on top of the yield advantage.
260707 - Fixed Income Dead Asset 06

The Need for Creativity: Global X ETFs for a Fixed Income Program

In this environment of uncertain inflation and rich fixed income valuations, one may consider tilting fixed income risk towards duration over corporate credit. A framework for investors to consider follows a barbell structure, supplemented by selective spread diversifiers.

The following solutions reference Bloomberg fixed income analytics as of 6/30/2026, except where noted.

Duration Core: A Barbell of U.S. Treasuries, Favoring Short- and Long Maturities.

Corporate Credit: Cautious and Selective

Narrow credit spreads may make risk-taking beyond investment grade unattractive. One may consider underweighting high yield bonds and private credit, where compensation for default risk and illiquidity remains thin. Within investment grade, consider the following:

Incremental Yield Diversifiers

Related ETFs

CLIP – Global X 1-3 Month T-Bill ETF

EMBD – Global X Emerging Markets Bond ETF

GXIG – Global X Investment Grade Corporate Bond ETF

LLDR – Global X Long-Term Treasury Ladder ETF

PFFD – Global X U.S. Preferred ETF

SLDR – Global X Short-Term Treasury Ladder ETF

TLTX – Global X Treasury Bond Enhanced Income ETF

ZCBA – Global X Zero Coupon Bond 2030 ETF

ZCBB – Global X Zero Coupon Bond 2031 ETF

ZCBC – Global X Zero Coupon Bond 2032 ETF

ZCBE – Global X Zero Coupon Bond 2033 ETF

ZCBF – Global X Zero Coupon Bond 2034 ETF

ZCBG – Global X Zero Coupon Bond 2035 ETF

Click the fund name above to view current performance and holdings. Holdings are subject to change. Current and future holdings are subject to risk.

Real yields are attractive, particularly at longer maturities given the steepness of global yield curves. One may consider anchoring a fixed income allocation in U.S. Treasuries via the Global X Short- and Long-Term Treasury Ladder ETFs (Tickers: SLDR, LLDR) and/or Zero-Coupon Treasury Bond ETFs (Tickers: ZCBA, ZCBB, ZCBC, ZCBE, ZCBF, ZCBG)) to target your desired maturity profile.

For short-term liquidity needs, we suggest the Global X 1-3 Month T-Bill ETF (Ticker: CLIP), with a 30-day SEC yield of 3.56% as of 6/30/2026.

Past performance is not a guarantee of future results. Click here for CLIP’s 30-day SEC yield, standard performance, and prospectus.

Global X Investment Grade Corporate Bond ETF (Ticker: GXIG): Actively managed with a systematic security selection methodology. Option-adjusted duration (OAD) is 7.0 years with a yield-to-worst (YTW) of 5.23%.

Global X U.S. Preferred ETF (Ticker: PFFD): A passive fund, seeking to track the ICE BofA Diversified Core U.S. Preferred Securities Index, with a yield-to-worst (YTW) of 5.29% with moderate rate sensitivity (OAD of 4.3 years). Unlike GXIG, fixed income risk is distributed more evenly across credit spread, equity market, and interest rate factors. The callability of many preferred securities will likely limit upside participation in a rate rally, and the fund carries greater sensitivity to credit spread volatility than straight corporate bonds.

Past performance is not a guarantee of future results. Click for GXIG and PFFD’s 30-day SEC yield, standard performance, and prospectus.

Global X Emerging Markets Bond ETF (Ticker: EMBD): Emerging Market (EM) debt offers a structural yield premium over developed markets; the fund has a yield-to-worst of 6.23% with an OAD of 5.8 years. The fund is actively managed by New York and Asia-based teams combining top-down macro and bottom-up credit analysis across sovereign and corporate EM issuers.

Global X Treasury Bond Enhanced Income ETF (Ticker: TLTX): May be best suited to a flat rate environment. The fund pairs long-term Treasuries with weekly covered calls on one or more U.S. Treasury ETFs on approximately 50%5 of the portfolio’s duration exposure. Option premiums are driven primarily by the MOVE Index (the implied rate volatility analog to the VIX). The latest distribution rate was 17.45% as of 6/30/2026.

The covered call premium represents a distinct potential risk premium category from traditional credit spreads, one that tends to exhibit moderate correlation with credit spread and mortgage basis risk, providing potential diversification value. The trade-off: covered calls introduce return asymmetry, limiting upside participation in a meaningful Treasury rally driven by falling rates.

The distribution rate is estimated to include a return of capital. This does not imply rates for any future distributions. Past performance is not a guarantee of future results. Click for EMBD and TLTX’s 30-day SEC yield, standard performance, and prospectus.

Related funds
Core
CLIP1-3 Month T-Bill ETF
International
EMBDEmerging Markets Bond ETF
Core
GXIGInvestment Grade Corporate Bond ETF
Explore All ETFs
Footnotes
  1. The Bloomberg US Aggregate Index had returned -1.06% and the Bloomberg US Long Treasury Index returned -3.58% year-to-date through 5/19/2026. Source: Bloomberg

  2. As of 12/31/2025, Fed Funds Futures were pricing in expectations of 2-3 Fed rate cuts per Bloomberg World Interest Rate Probability (WIRP). WIRP displays the expected path of benchmark rates, such as the Fed Funds rate, across a forward calendar of FOMC (or other central bank) meetings, expressing each outcome as a percentage probability of a hike, hold, or cut. It is widely used by fixed income investors and portfolio managers to gauge market consensus on monetary policy direction and to benchmark positioning against rate expectations priced into derivatives markets.

  3. Federal Open Market Committee, "Statement on Longer-Run Goals and Monetary Policy Strategy," adopted January 24, 2012; as amended August 22, 2025.

  4. Bloomberg Graph Curves (GC) function for calculating mid-point pricing yields for US Treasuries Active, A+, A, A- rated Corporate Bonds, BBB+, BBB, BBB- rated Corporate Bonds. See Glossary for details.

  5. Degree of notional exposure may vary.

Glossary
  • 5-Year/5-Year Forward Breakeven Rate: A market-derived measure of expected inflation five years from now, over the subsequent five-year period. Because it looks beyond the near term, it is widely used by the Federal Reserve and market participants as a gauge of long-term inflation anchoring.
  • Barbell Strategy: A fixed income portfolio construction approach that concentrates allocations at opposite ends of the maturity spectrum — typically short-term and long-term securities — while underweighting the intermediate maturities. The structure seeks to balance liquidity and income with interest rate exposure.
  • Bloomberg BBB Corporate Credit Spread (Bloomberg CSI BBB Index): The yield spread between the U.S. BBB/Baa-rated corporate bond yields and the 10-Year U.S. Treasury yield as calculated by Bloomberg. It isolates the incremental yield premium for the lowest tier of investment-grade credit risk, the segment most sensitive to economic deterioration given its proximity to the high yield threshold. BBB ratings come from S&P/Fitch and Baa ratings come from Moody’s. The underlying Bloomberg U.S. Corporate Index (from which BBB is a rated sub-index) is broad, market-cap-weighted benchmark measuring the performance of the investment-grade, fixed-rate, taxable U.S. corporate bond market.
  • Bloomberg US Aggregate Index: A broad benchmark measuring the performance of the U.S. investment-grade taxable bond market, encompassing Treasuries, agency securities, mortgage-backed securities, and corporate bonds. Widely used as the standard proxy for "core" fixed income performance.
  • Bloomberg US High Yield Credit Spread (Bloomberg CSI BARC Index): The yield spread between the Bloomberg U.S. Corporate High Yield Yield-to-Worst (YTW) and the 10-Year U.S. Treasury yield as calculated by Bloomberg. It measures the incremental yield compensation investors demand for taking on below-investment-grade (BB-rated and lower) credit risk above the risk-free rate. It is widely used as the primary real-time barometer of high yield credit market stress and risk appetite. The Bloomberg U.S. Corporate High Yield Index is a broad, market-cap-weighted benchmark measuring the performance of the USD-denominated, below-investment-grade, fixed-rate corporate bond market.
  • Bloomberg US Long Treasury Index: A subset of the broader Treasury index tracking U.S. Treasury bonds with maturities of ten years or greater. Because of its extended duration profile, it carries significantly higher interest rate sensitivity than the Aggregate Index, making it a common benchmark for long-duration fixed income strategies and a key indicator of long-term inflation and fiscal expectations.
  • Breakeven Inflation Rate: The yield differential between a nominal U.S. Treasury and a TIPS of equivalent maturity. It represents the market's implied inflation expectation over that period — the rate at which an investor would be indifferent between holding a nominal Treasury and a TIPS.
  • Covered Call Writing: An options strategy in which the holder of a security (e.g., a Treasury bond) sells call options on that security in exchange for receiving a premium. The trade-off is that the call caps upside appreciation if prices rise above the strike price, creating return asymmetry.
  • Credit Spread: The yield differential between a corporate (or other non-government) bond and a comparable maturity U.S. Treasury. Credit spreads represent the market's compensation for taking on default, liquidity, and other risks beyond those of sovereign debt. Narrow spreads indicate that investors are receiving less incremental compensation for credit risk.
  • Distribution Rate: The annual rate an investor would receive if the most recent fund distribution remained the same going forward. The rate represents a single distribution from the fund and does not represent total return of the fund. The distribution rate is calculated by annualizing the most recent distribution and dividing by the most recent fund NAV.
  • Duration: A measure of a bond or portfolio's sensitivity to changes in interest rates, expressed in years. The longer the duration, the greater the price decline for a given rise in yields — and the greater the price appreciation for a given decline in yields.
  • High Yield (HY) / Below Investment Grade: Bonds rated below BBB–/Baa3, also known as speculative-grade or "junk" bonds. These securities offer higher yields to compensate for elevated default risk, credit volatility, and generally lower liquidity.
  • ICE BofA Diversified Core U.S. Preferred Securities Index: A rules-based, market-capitalization-weighted benchmark designed to measure the performance of the broad U.S. preferred securities market, encompassing both exchange-listed retail preferred stock and institutionally traded hybrid capital instruments
  • Investment Grade (IG) Credit: Bonds rated BBB–/Baa3 or higher by major credit rating agencies (S&P, Moody's, Fitch), reflecting relatively low default risk. Investment grade debt is distinguished from high yield or "junk" bonds, which carry higher default probability and therefore offer wider spreads.
  • Leveraged Loans: Senior secured floating-rate loans made to below-investment-grade companies, typically by banks or institutional lenders. Leveraged loan prices are often used as a public market proxy for private credit valuations, given the overlap in the borrower universe.
  • Morningstar LSTA US Leveraged Loan Price Index: A market-value-weighted benchmark designed to measure the performance of the USD-denominated U.S. leveraged loan market, tracking more than 1,400 broadly syndicated senior secured term loans held within top-tier institutional investor portfolios.
  • MOVE Index: Formerly the Merrill Lynch Option Volatility Estimate Index, the ICE BofA U.S. Bond Market Option Volatility Estimate Index measures implied volatility in the U.S. Treasury market using prices of near-term options on Treasuries. Often described as the fixed income equivalent of the VIX, it reflects the market's expectation of future interest rate volatility.
  • Option-Adjusted Duration (OAD): A measure of interest rate sensitivity that accounts for embedded options in a bond — such as call provisions in corporate bonds or preferred securities — which can alter the effective duration depending on the rate environment. OAD provides a more accurate sensitivity estimate than standard duration for securities with optionality.
  • Real Interest Rate: The nominal interest rate adjusted for inflation expectations. Calculated as the nominal yield minus the expected inflation rate, real rates represent the actual purchasing-power return an investor earns. Elevated real rates indicate more attractive compensation for holding long-duration debt.
  • SOFR (Secured Overnight Financing Rate): The overnight borrowing rate collateralized by U.S. Treasury securities, published by the Federal Reserve Bank of New York. SOFR replaced LIBOR as the primary benchmark for floating-rate instruments and serves as a reliable proxy for current and anticipated money market fund rates.
  • Term Premium: The additional yield investors demand as compensation for holding longer-maturity bonds rather than rolling over a series of short-term bonds. A steeper yield curve generally reflects a wider term premium, rewarding investors for bearing interest rate risk over time.
  • TIPS (Treasury Inflation-Protected Securities): U.S. government bonds whose principal adjusts with changes in the Consumer Price Index (CPI). TIPS provide a direct hedge against inflation, and the yield differential between TIPS and nominal Treasuries of the same maturity approximates the market's inflation expectations.
  • US Corporate A+, A, A- Rated Yield Curve: Bloomberg's fair-value yield curve for U.S. investment-grade corporate bonds rated A, constructed from mid-market yields of senior unsecured bonds grouped by rating category and currency. Ratings are an aggregate of S&P, Moody’s, and Fitch. The mid-market quote calculated as the average of the prevailing bid yield and the ask yield at the time of the last update or trade; it eliminates the bid-ask spread to provide a neutral market price reference.
  • US Corporate BBB+, BBB, BBB- Rated Yield Curve: Bloomberg's fair-value yield curve for U.S. investment-grade corporate bonds rated BBB, constructed from mid-market yields of senior unsecured bonds grouped by rating category and currency. Ratings are an aggregate of S&P, Moody’s, and Fitch. The mid-market quote calculated as the average of the prevailing bid yield and the ask yield at the time of the last update or trade; it eliminates the bid-ask spread to provide a neutral market price reference.
  • US Treasuries Active Yield Curve: A Bloomberg data series referencing the yield-to-maturity (YTM) of on-the-run (active) U.S. Treasury securities, derived from the mid-point between the bid and ask yields at last trade or quote. Active refers specifically to on-the-run Treasuries, i.e., the most recently auctioned issue at each maturity point. These are the most liquid and actively traded securities in the Treasury market and serve as the market's pricing benchmark.
  • VIX: CBOE Volatility Index. A real-time market index published by the Chicago Board Options Exchange (CBOE) that measures the market's expectation of 30-day forward-looking volatility in the S&P 500, derived from the prices of near-term S&P 500 options. Commonly referred to as the market's "fear gauge" or "fear index," the VIX reflects the implied volatility priced into options by market participants, rising sharply during periods of uncertainty, stress, or rapid equity sell-offs, and falling during calm, trending market environments.
  • Yield-to-Maturity (YTM): The total annualized return an investor will receive if a bond is held to its maturity date and all coupon payments are reinvested at the same rate. It accounts for the bond's current price, coupon payments, and time to maturity.
  • Yield-to-Worst (YTW): The lowest potential yield an investor can receive on a callable bond without the issuer actually defaulting. It reflects the most conservative yield outcome across all possible call scenarios and is the standard yield measure for investment grade corporate bonds.
  • Zero-Coupon Bond: A bond that pays no periodic interest but is issued at a discount to its face value, with the investor receiving the full face value at maturity. The return is entirely in the form of price appreciation, making zero-coupon bonds highly sensitive to interest rate changes and useful for liability-matching or targeted maturity strategies.