


Product ResearchArtificial IntelligenceThematic Growth
A Thematic Playbook to Invest in the AI Ecosystem
T
Tejas Dessai
Jan 8, 202616 min read
Get the latest news and updates from our team.
Copyright © 2026 Global X. All rights reserved.
SEI Investments Distribution Co. (1 Freedom Valley Drive, Oaks, PA, 19456) is the distributor for the Global X Funds.
Check the background of SIDCO and Global X's Registered Representatives on FINRA's BrokerCheck.
Madeline Ruid
Tejas Dessai
Tejas Dessai
This piece is one in a series that delves further into the leading themes emerging from this year’s iteration of our flagship research project, Charting Disruption.
Electricity is the essential input behind many of the technologies reshaping the economy. AI data centers, robotics, advanced manufacturing, and electric vehicles (EVs) can scale only as fast as the power available to run them, and after decades of limited growth, U.S. electricity demand could rise 49% by 2050.1 Yet new dispatchable power is expected to meet only 42% of the projected demand growth through 2030.2 Meeting that need while keeping power reliable and affordable will require investment across a diverse energy system, including nuclear power, natural gas infrastructure, renewable energy, and grid modernization. Recent geopolitical tensions and fuel disruptions have also underscored the importance of energy security and resilient access to power. That investment spans power generation, fuel supply, and grid infrastructure – areas that remain underrepresented in broad-market indexes.
U.S. electricity demand could rise 49% by 2050 as data centers, factories, and EVs add load, while new dispatchable supply could cover only 42% of the increase expected through 2030.3,4
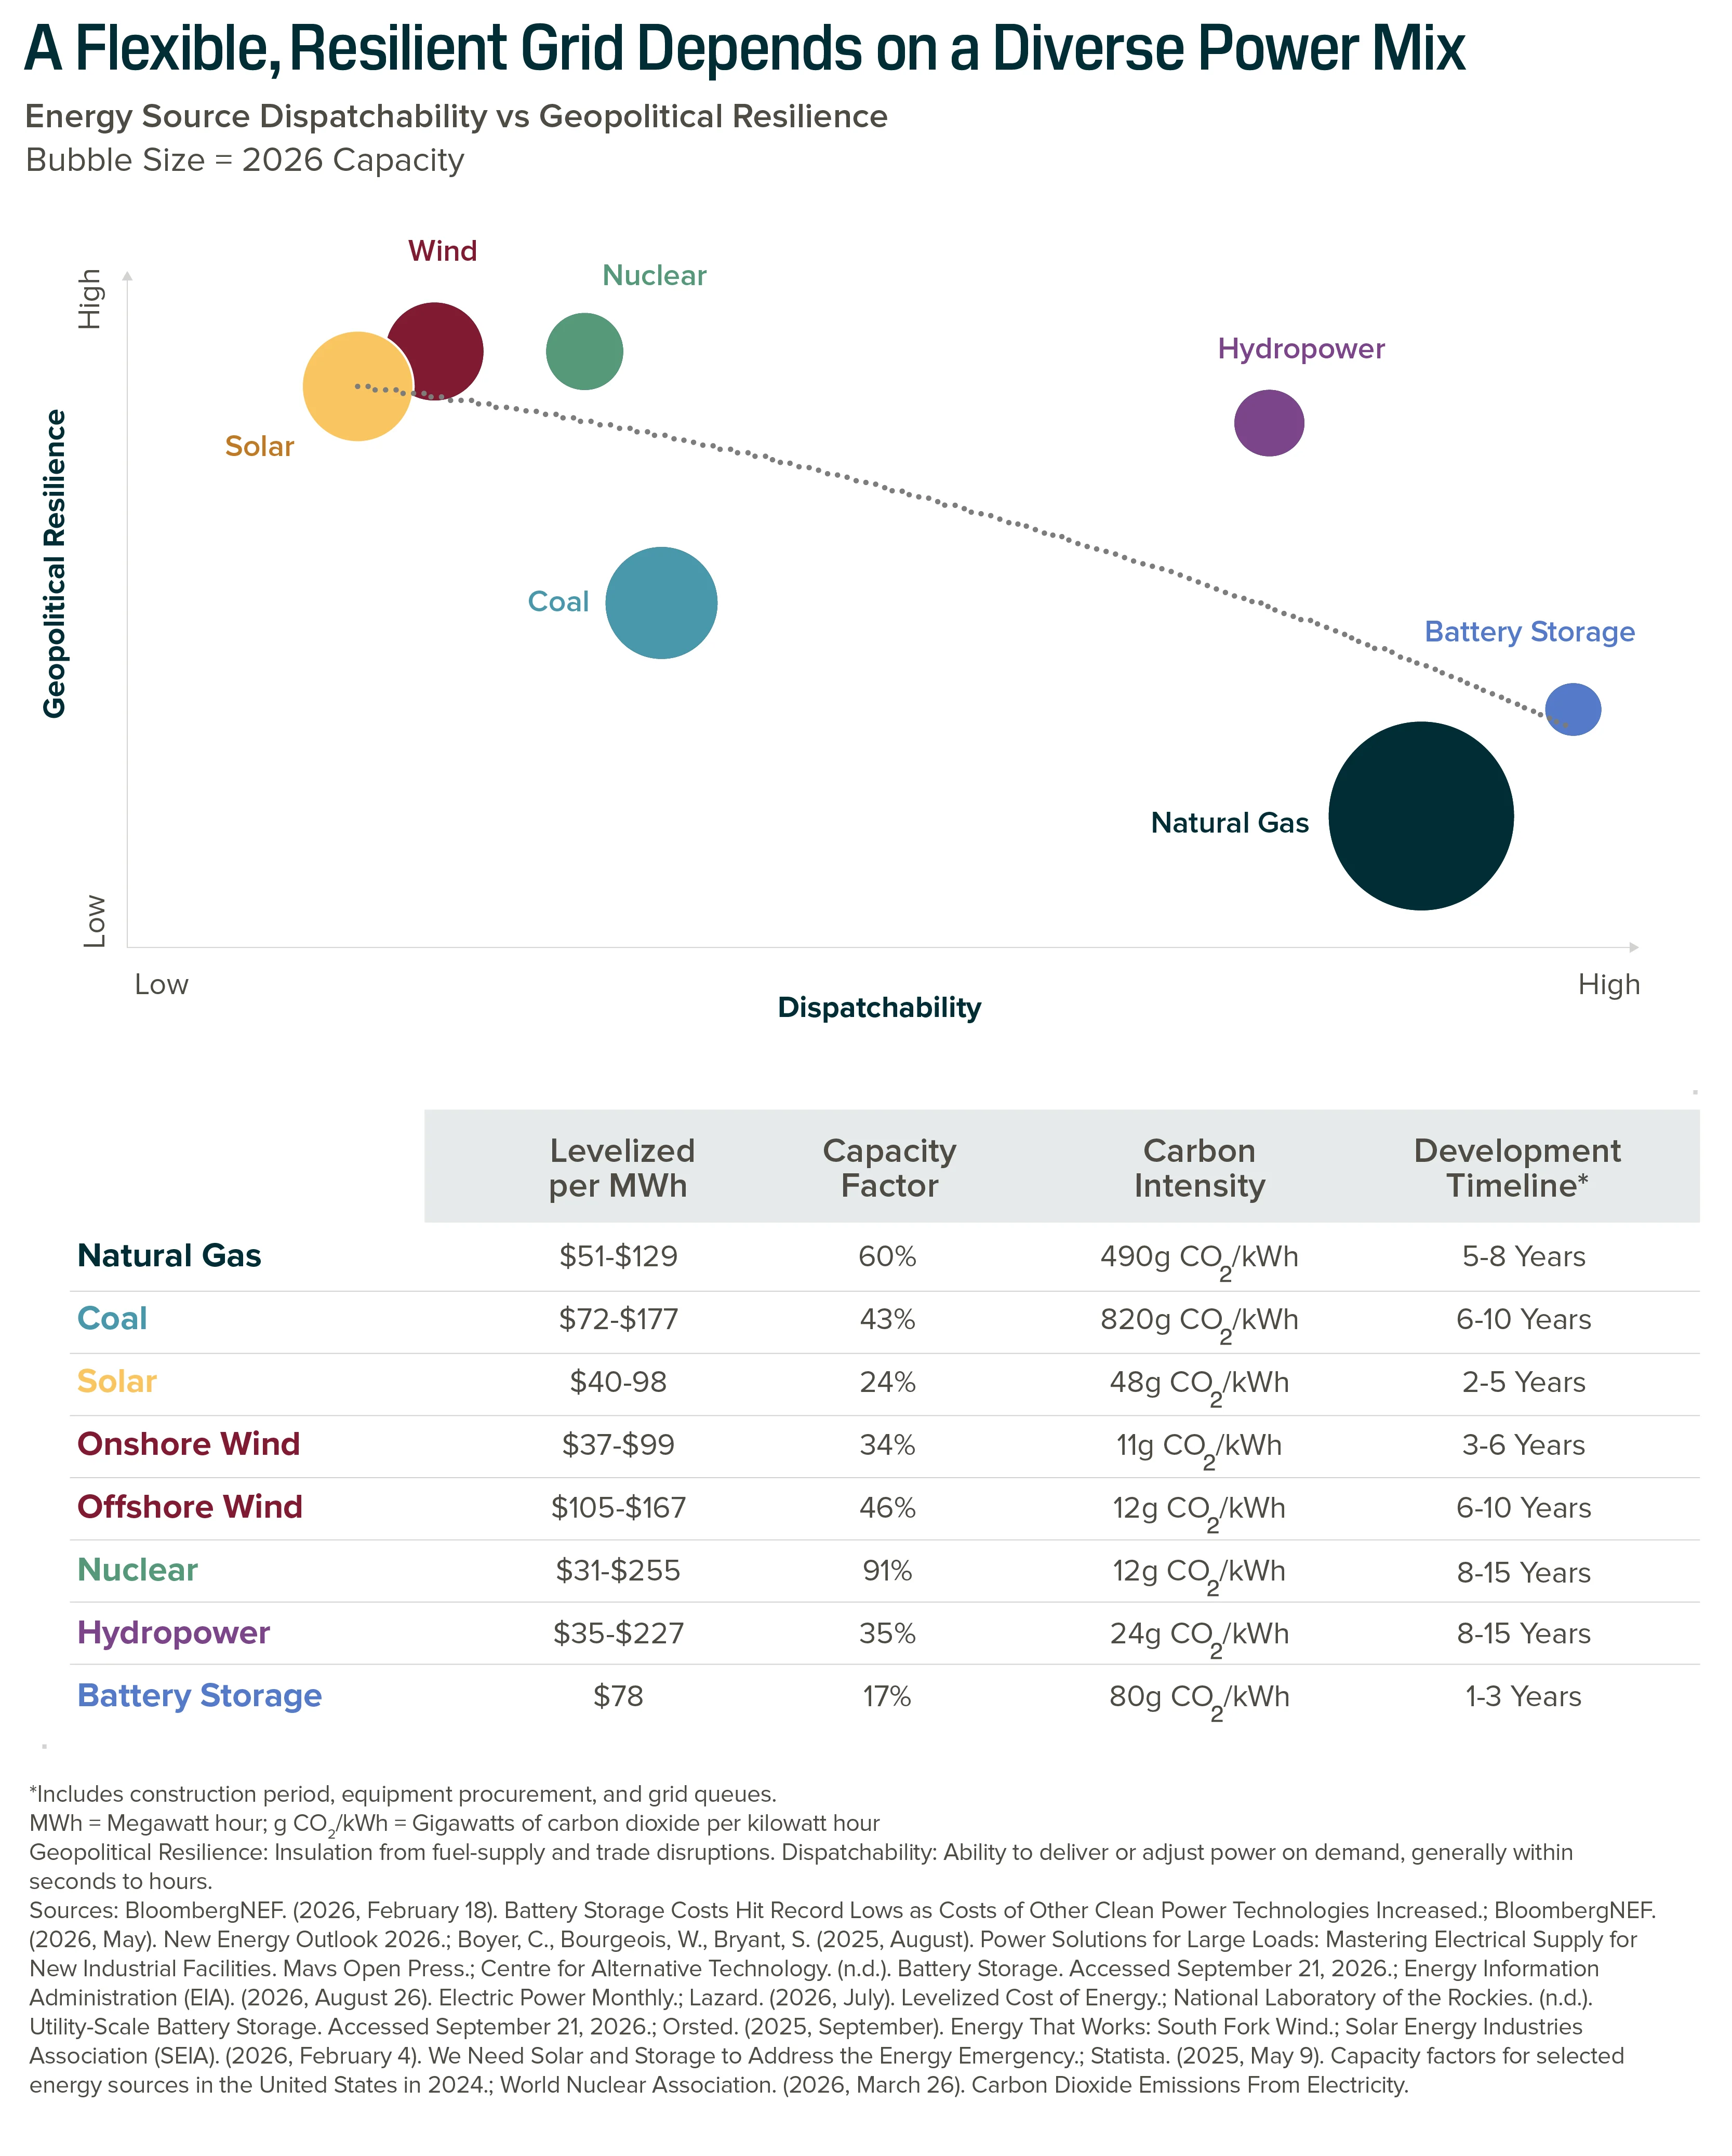
No single source will be able to scale fast enough to meet this demand, so a flexible, resilient grid depends on the right mix of sources.
Meeting global power needs could require a $21.9 trillion investment through 2040 across power generation and distribution.5
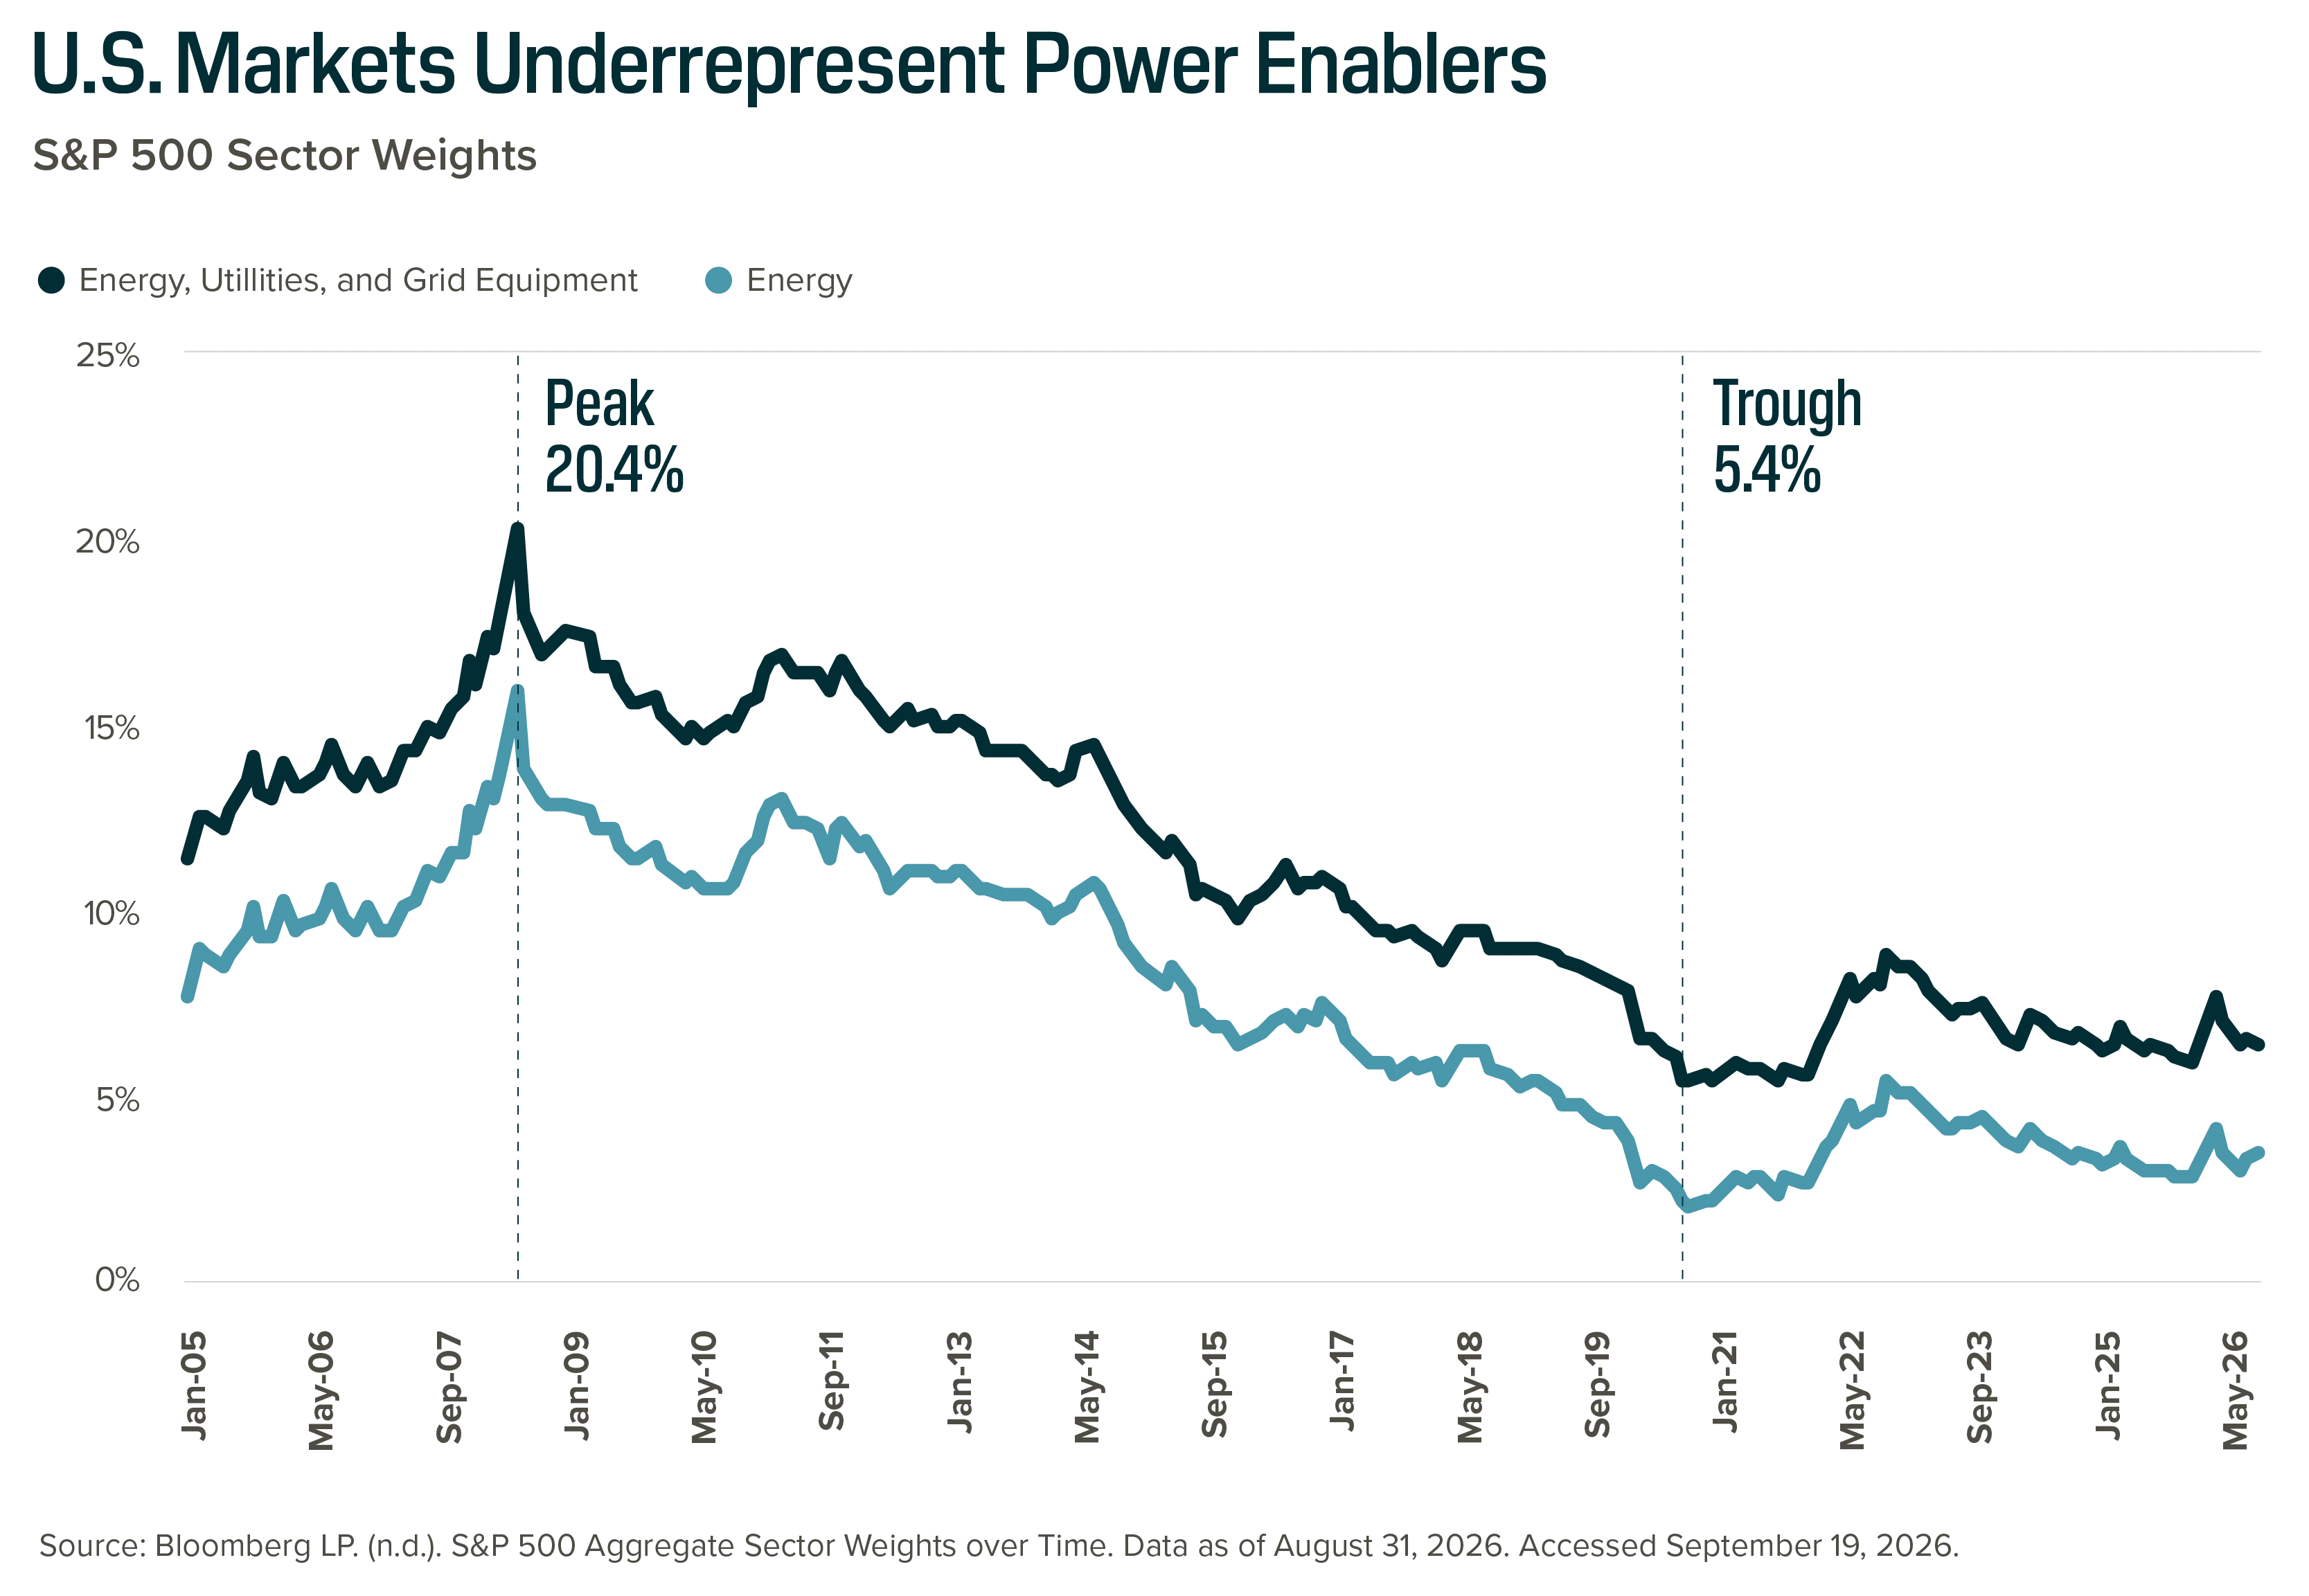
Energy, utilities, and grid equipment make up only about 6% of the S&P 500, down from a peak above 20% in 2008, so investors might be underexposed to one of the most critical parts of the market.6
Data centers are the most visible source of new demand. They could account for 20% of U.S. electricity demand by 2035, up from about 6% today.7 As AI infrastructure efforts grow, estimates of their power needs rose 83% in just seven months, adding further urgency to this buildout.8 Rising adoption of electric vehicles, manufacturing, and electric heating could compound that demand.9
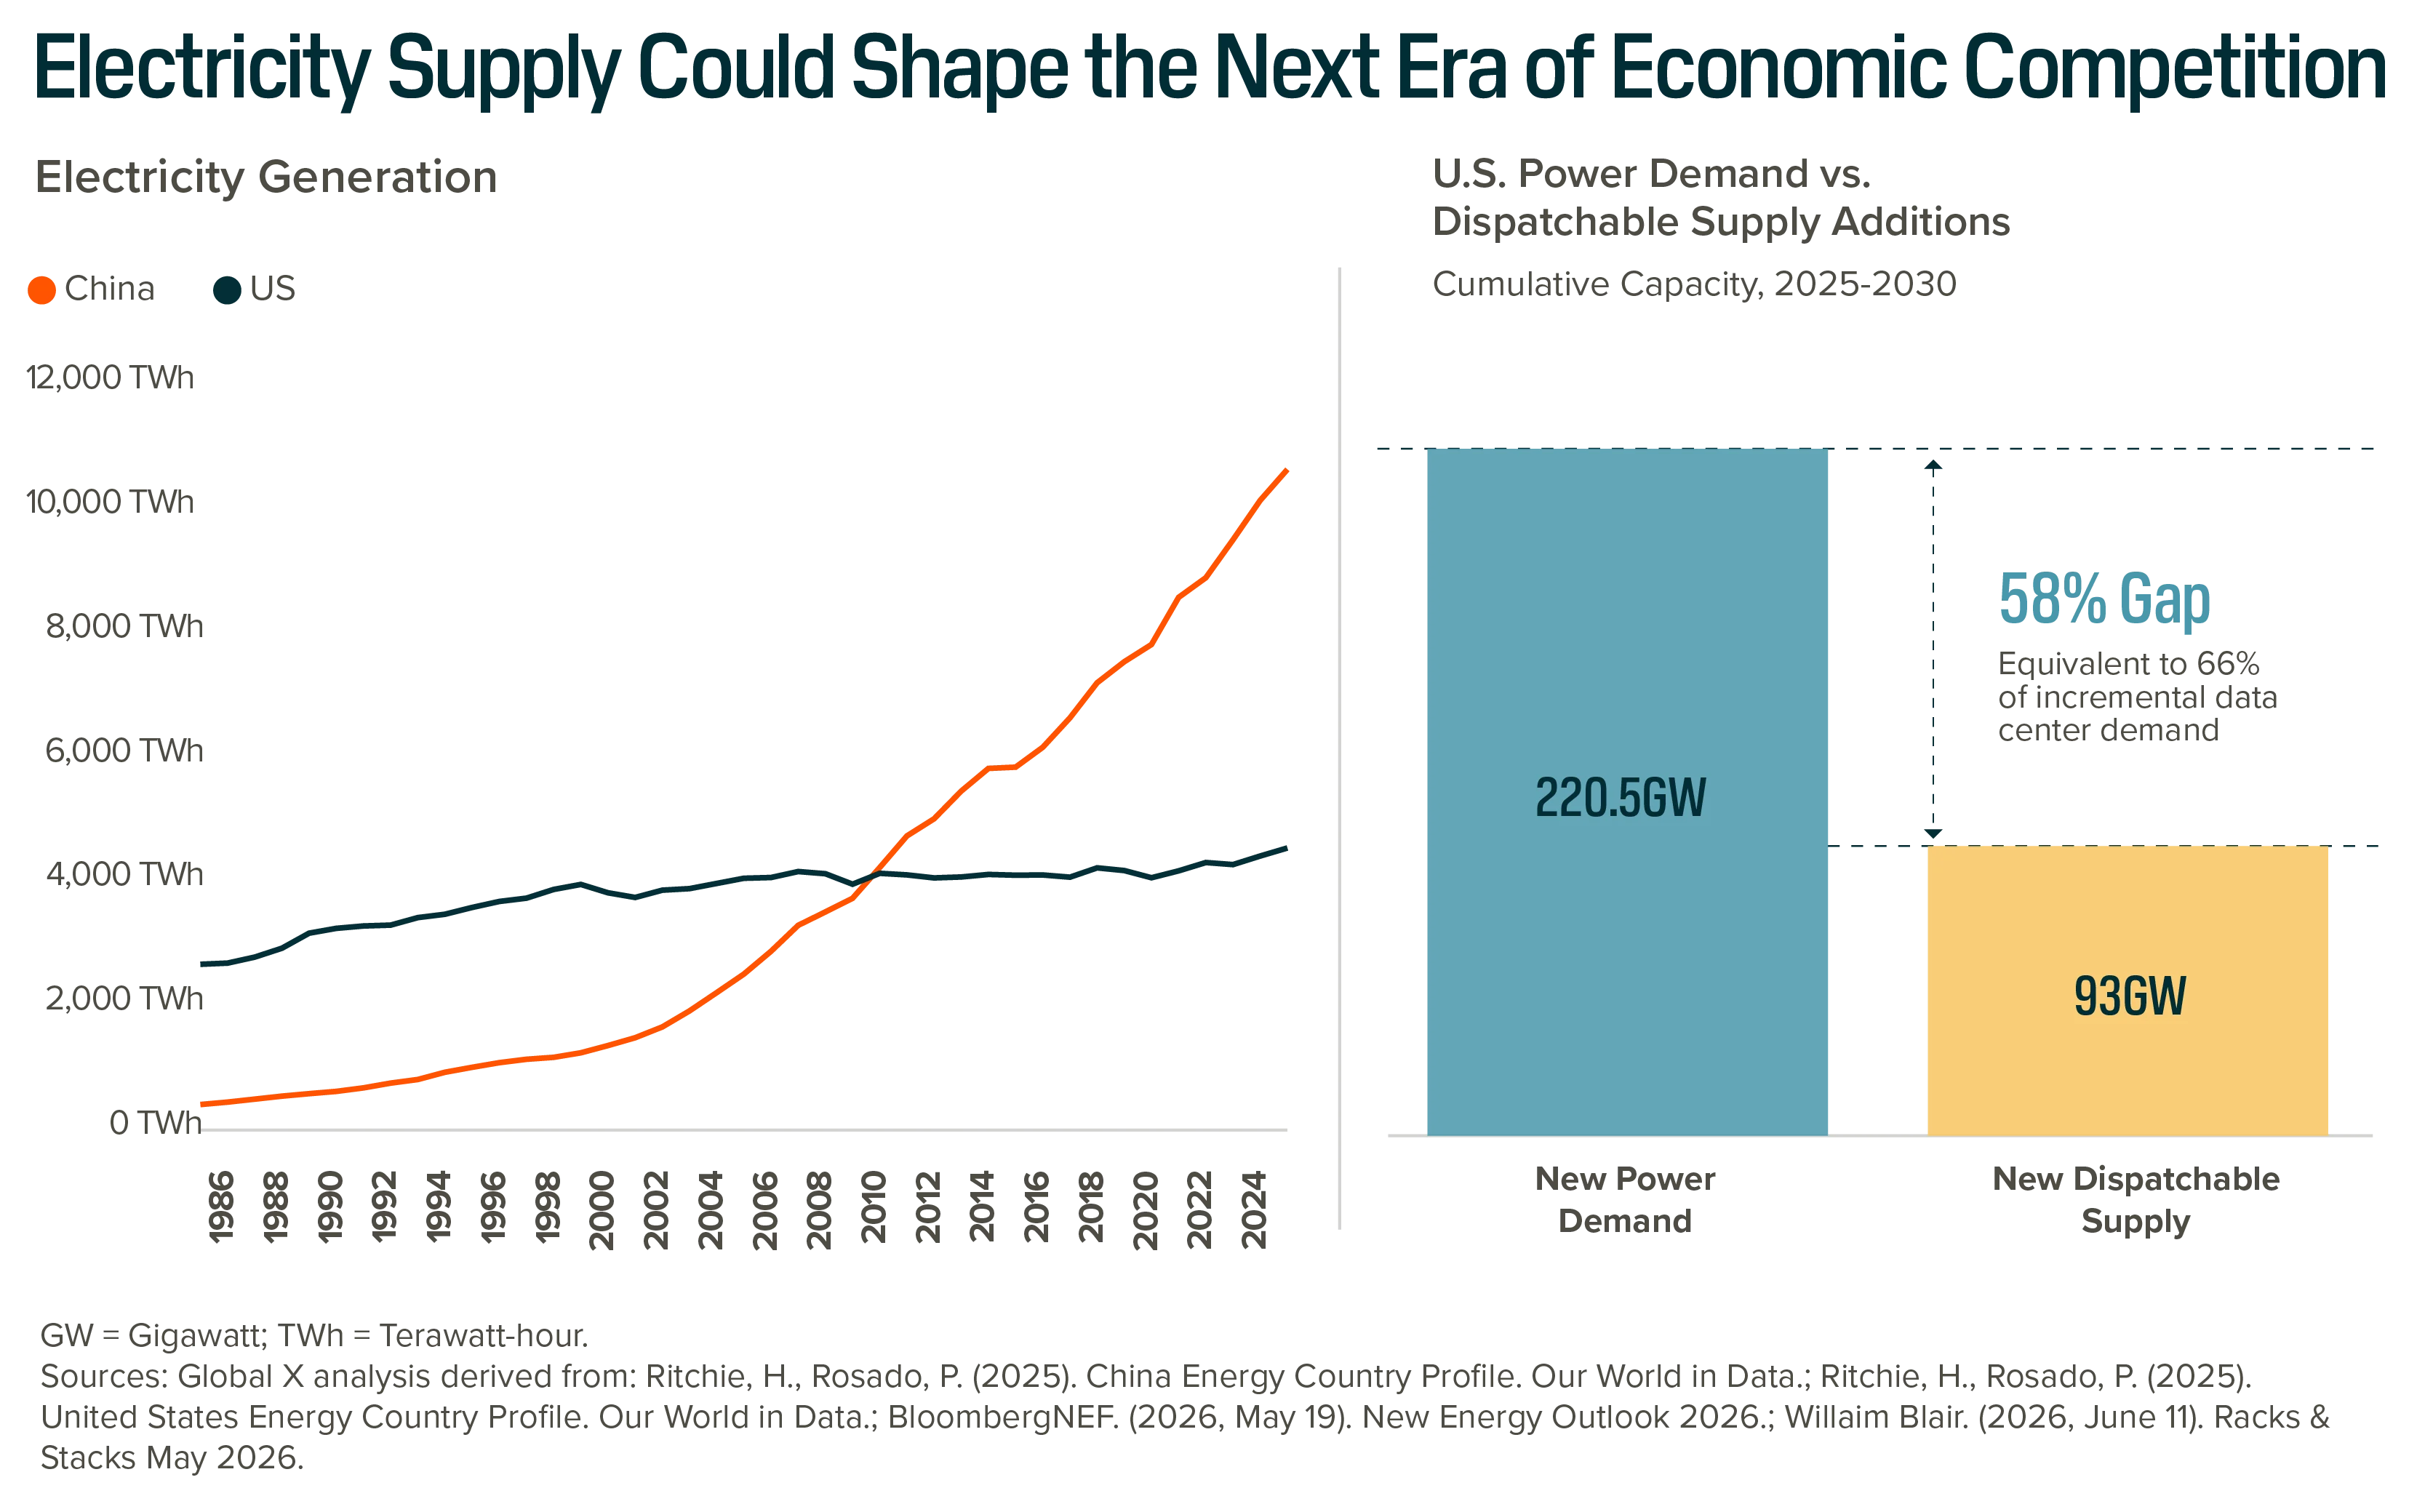
China illustrates how power availability can support industrial expansion. Since 2010, its electricity generation has grown about 150%, helping power growth in AI, robotics, advanced manufacturing, and electrified transportation.10 U.S. generation, by comparison, has grown about 10%.11
The U.S. is pursuing similar ambitions, with a historic AI infrastructure buildout and $1.76 trillion in announced manufacturing investment since January 2025.12 Yet dispatchable capacity may not keep pace: about 93 gigawatts (GW) of new capacity could come online between 2025 and 2030, compared with an estimated 220.5 GW of new demand.13 The projected 58% gap is nearly 10% of the capacity installed across the U.S. today and could constrain the next wave of innovation.14
Meeting rising demand requires more than adding generation. The grid has to deliver power as demand changes and remain dependable through disruptions to fuel supplies or infrastructure. Energy sources meet those needs differently: some can adjust output quickly but rely on globally traded fuels, while others are less exposed to fuel markets but offer less control over when they generate. Because new projects take years to develop, the mix built today will shape grid reliability and energy security for years to come.15 That makes the composition of new capacity as consequential as its scale.
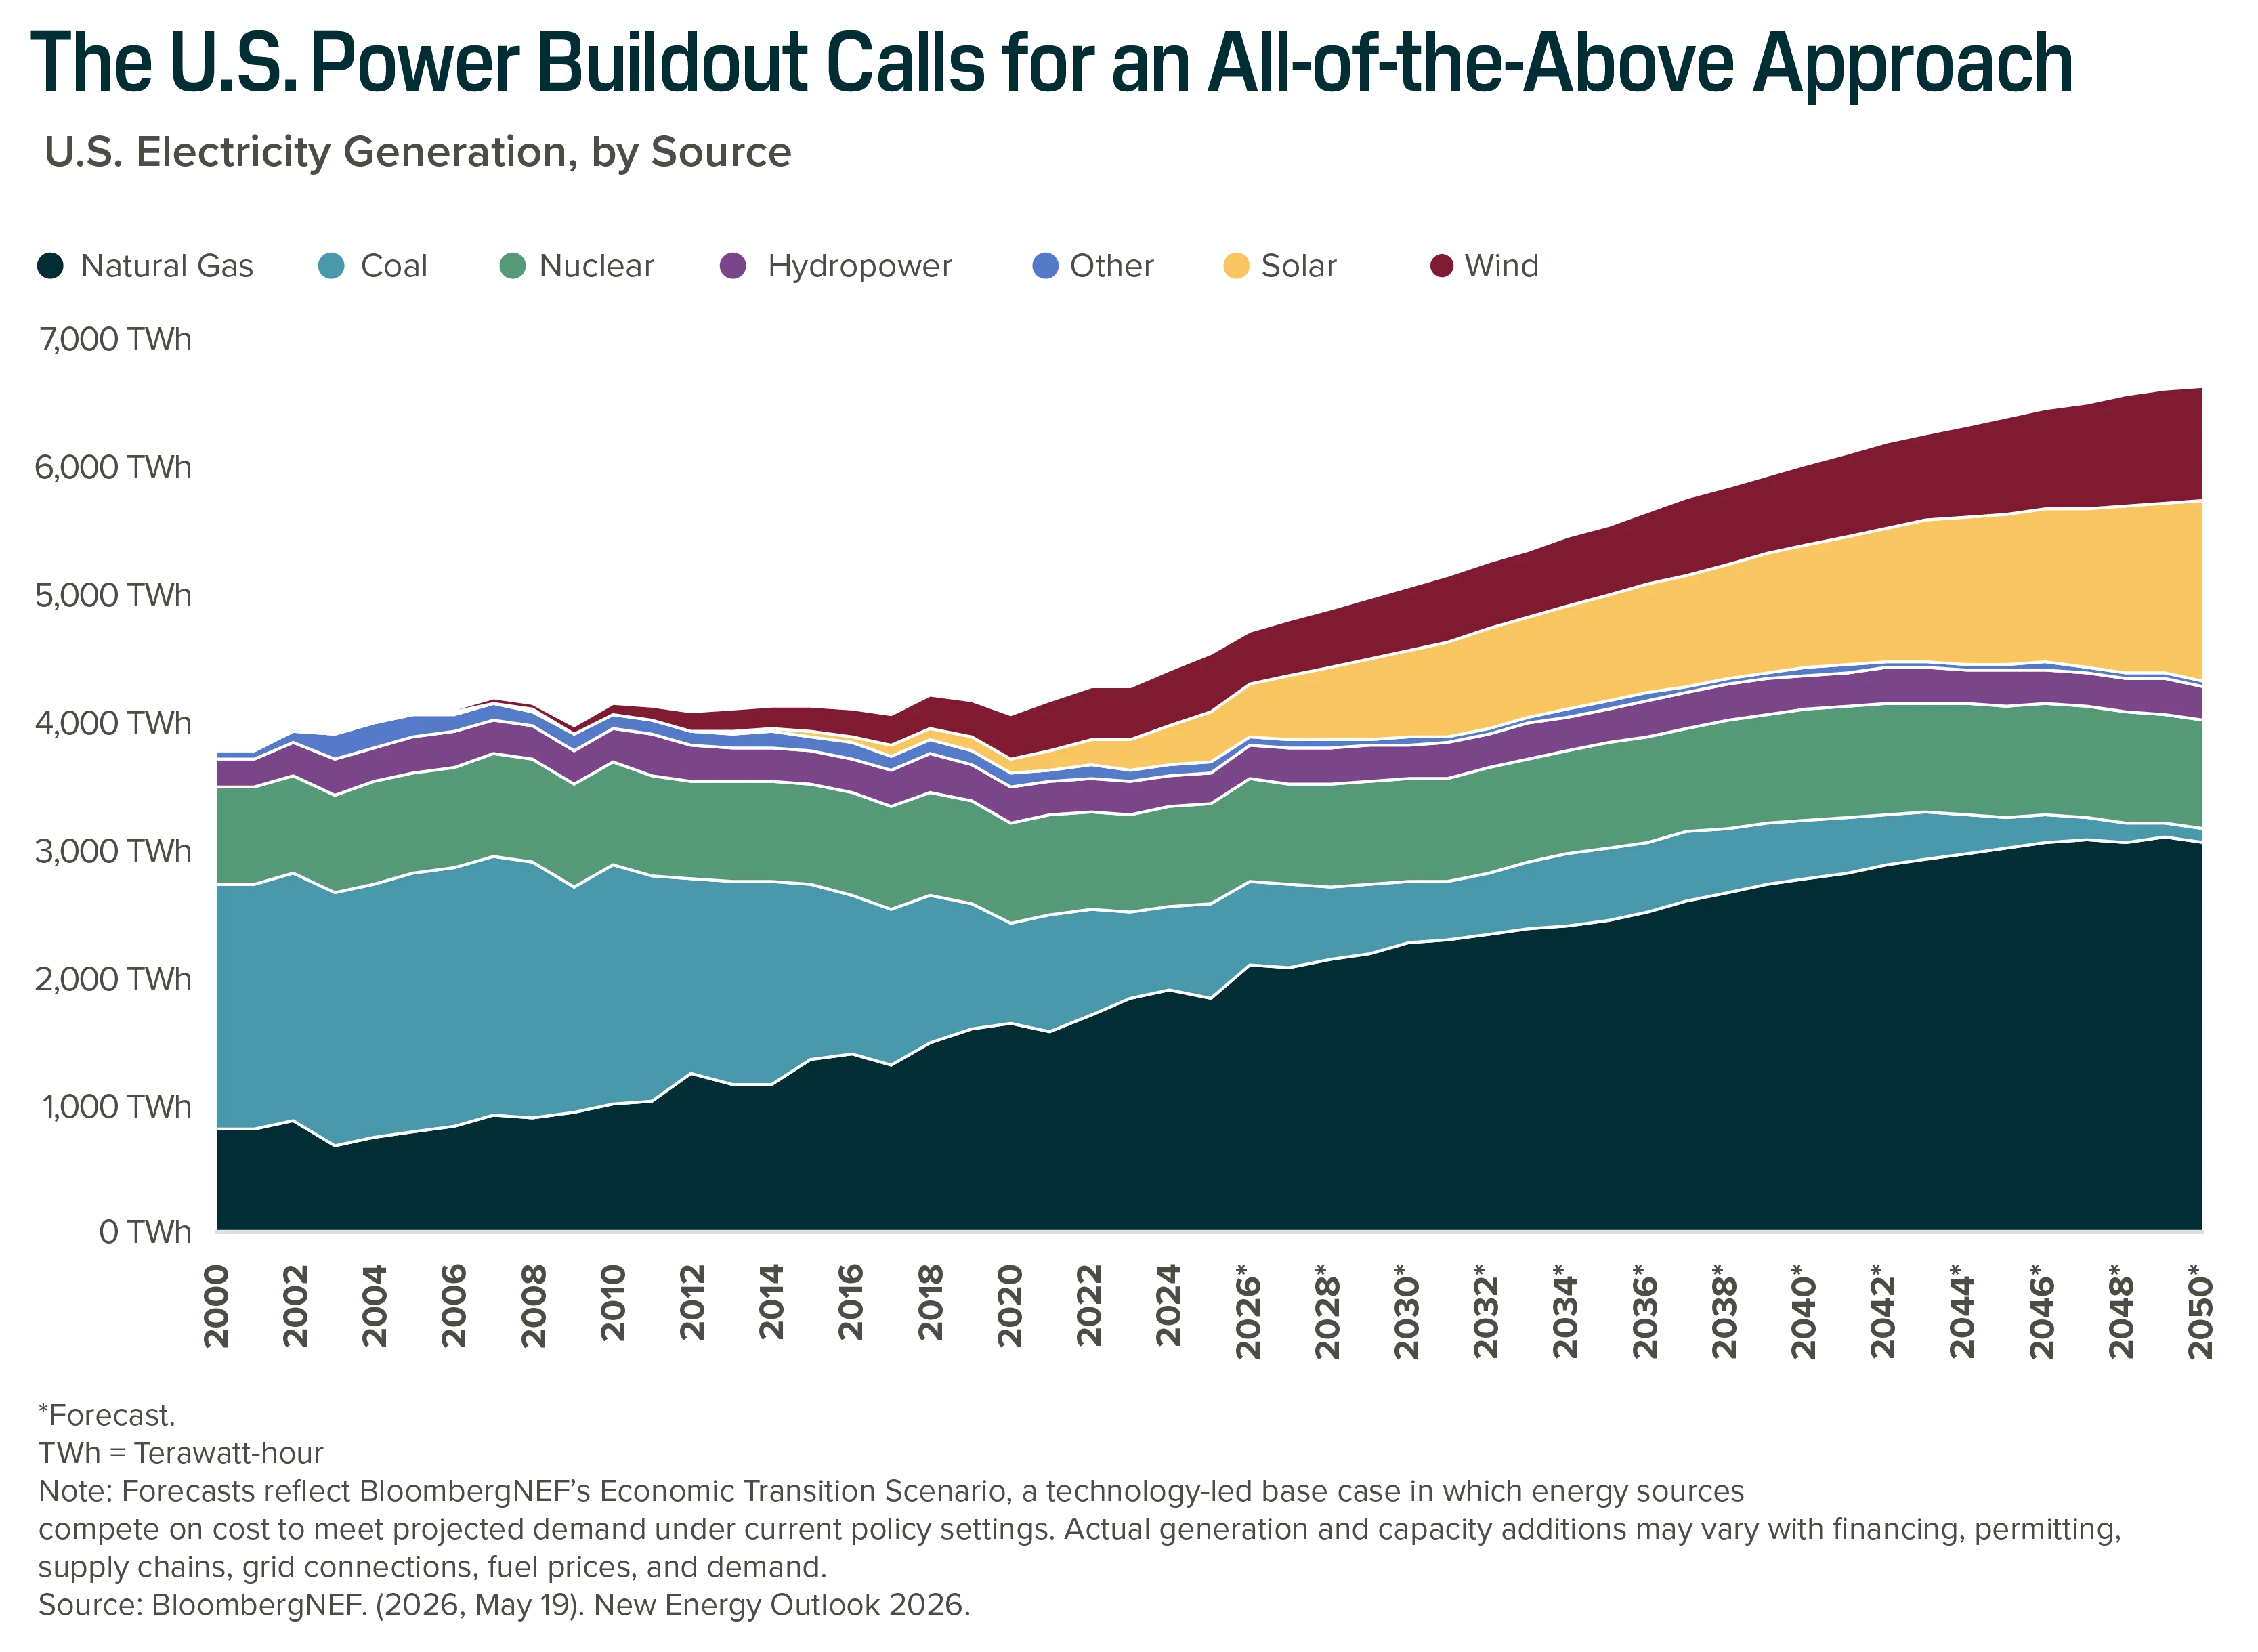
U.S. generation would have to rise about 49% by 2050, but that net increase understates the buildout required.16 Natural gas, solar, wind, nuclear, and hydropower could add output equal to roughly 60% of today’s generation, while output from coal and other sources could decline by the equivalent of 15% of today’s generation.17 Natural gas is expected to contribute the largest share of energy supply through 2050, and solar and wind – given how quickly they can come online – are expected to drive the most energy additions in the next 5 years.18
Investment needs will vary across the energy system, as each source plays a different role in meeting demand, replacing retiring capacity, and maintaining grid reliability.
Natural Gas: Natural gas is already the largest source of U.S. electricity generation, and it could contribute the largest share of additions through 2050.19 Exports add another source of demand. The U.S. became the world’s largest exporter of liquefied natural gas (LNG) in under a decade, and exports drove up to two-thirds of U.S. natural gas demand growth in 2025.20 Looking ahead, exports could more than double by 2050.21 Getting that gas to domestic users and export terminals requires midstream infrastructure. Midstream companies transport, process, and store U.S. oil and gas, typically earning fees based on the volumes they handle. U.S. natural gas production has more than doubled since 2005, sending more volume through the midstream system.22
Nuclear Power: Nuclear power offers a unique balance of low carbon emissions and 24/7 power. Yet retirements could absorb nearly half of projected new capacity, leaving even 340 GW of additions by 2050 well short of the 2023 goal to triple global capacity.23 Small modular reactors (SMRs) could help resolve some of nuclear’s longest-standing constraints, with construction times of 3–5 years and costs as low as $300 million per unit, compared with 8–15 years and $10 billion for a conventional reactor.24 Amazon, Meta, and Google have announced SMR projects totaling about 2.7 GW, with first power targeted around 2030.25 Scaling nuclear generation will also require more fuel: global uranium demand could grow 77% by 2045, expanding the projected supply gap to more than six times its current size.26 With new mines taking an average of 15.7 years to reach production, existing miners could help meet demand in the interim.27
Renewable Energy: Solar and wind could deliver most of U.S. generation growth through 2030, supported by competitive costs, shorter construction timelines, and deep project pipelines.28 Corporate buyers, including Amazon, Meta, Alphabet, and Microsoft, have signed about 160 GW of long-term U.S. renewable agreements since 2020, equal to roughly 12% of installed U.S. capacity.29
Storage: Energy storage could address some of the most persistent challenges across the energy system. Batteries shift midday solar generation to evening peak demand, addressing the mismatch between when power is generated and when it is needed. Storage capacity could grow tenfold by 2035 as system costs fall 33%.30 Hydrogen fuel cells address a separate challenge: they can provide onsite power within months to data centers, remote communities, and other sites facing long waits for a grid connection. Two-thirds of data center developers are evaluating onsite power, and 47% of them are considering fuel cells.31 Investment in data center fuel cells could grow tenfold to $30 billion by 2030.32
With major projects taking up to 20 years to come online, the U.S. must begin expanding and diversifying its power supply now.33 A broader mix also supports energy security, since no single fuel supply, trade route, or technology can disrupt the whole system.
Even the right mix has to reach customers, and the grid is currently a bottleneck. Projects waiting in interconnection queues total roughly 50% more capacity than the entire installed U.S. fleet, and the median wait to reach commercial operation has more than tripled since 2005 to five years.34
The grid buildout will require both new transmission and upgrades to existing lines. New high-voltage lines can take seven years or more to build, while reconductoring can increase capacity on existing lines by 50% to 100% in three to four years.35 These faster upgrades can help relieve bottlenecks as larger transmission projects move forward, extending grid investment to companies improving existing networks as well as those building new lines.
U.S. electric utilities could invest roughly $1.2 trillion between 2026 and 2030, with nearly half directed toward transmission and distribution.36 Backlogs at three leading grid equipment and construction companies, Quanta Services, Eaton, and MasTec, have risen more than 50% since the third quarter of 2024, signaling that planned grid investment is beginning to translate into contracted work.37
Globally, meeting power needs could require $21.9 trillion of investment through 2040 spanning both energy generation and distribution.38 Every $1 invested in new power capacity could require another $0.89 in the grid to deliver it.39
Yet broad-market exposure to the companies enabling this buildout remains limited. Energy, utilities, and grid equipment now account for about 6.4% of the S&P 500, compared with a peak of 20.4% in June 2008.40 U.S. Electrification’s overlap with the S&P 500 is only 2.1%, so investors who rely on broad indexes may hold limited exposure to these areas.41
Power underpins many themes of innovation, and a reliable, affordable, and secure supply depends on the right mix of sources and the grid that connects them. We believe LNG, midstream infrastructure, uranium, SMRs, renewables, storage, hydrogen fuel cells, grid technology, and electrification each address a different part of that buildout, and may offer investors a way to access areas that broad indexes capture only in part.
For additional insights, please view our full report, Charting Disruption: Outlook for 2027 and Beyond.
BloombergNEF. (2026, May 19). New Energy Outlook 2026.
William Blair. (2026, June 11). Racks & Stacks May 2026.
BloombergNEF. (2026, May 19). New Energy Outlook 2026.
William Blair. (2026, June 11). Racks & Stacks May 2026.
BloombergNEF. (2026, May 19). New Energy Outlook 2026.
Bloomberg. (n.d.). Overlap with the S&P 500. Accessed October 30, 2026.
Forgash, E. (2026, July 21). Data Centers on Track to Suck Up a Fifth of US Power Use by 2035. Bloomberg.
BloombergNEF. (2026, May 19). New Energy Outlook 2026.
Ibid.
Ritchie, H., & Rosado, P. (2025). China Energy Country Profile. Our World in Data.
Ritchie, H., & Rosado, P. (2025). United States Energy Country Profile. Our World in Data.
Global X ETFs. (2026, October). U.S. Manufacturing Resurgence Boosts Opportunities for Infrastructure Development.
William Blair. (2026, June 11). Racks & Stacks May 2026.
Global X analysis derived from: William Blair. (2026, June 11). Racks & Stacks May 2026.; Rand, J., Cheyette, A., Talley, C., et al. (2026, July 16). Queued Up: 2026 Edition. Lawrence Berkeley National Laboratory.
BloombergNEF. (2026, February 18). Battery Storage Costs Hit Record Lows as Costs of Other Clean Power Technologies Increased.; BloombergNEF. (2026, May). New Energy Outlook 2026.; Boyer, C., Bourgeois, W., & Bryant, S. (2025, August). Power Solutions for Large Loads: Mastering Electrical Supply for New Industrial Facilities. Mavs Open Press.; Centre for Alternative Technology. (n.d.). Battery Storage. Accessed September 21, 2026.; U.S. Energy Information Administration. (2026, August 26). Electric Power Monthly.; Lazard. (2026, July). Levelized Cost of Energy.; National Laboratory of the Rockies. (n.d.). Utility-Scale Battery Storage. Accessed September 21, 2026.; Ørsted. (2025, September). Energy That Works: South Fork Wind.; Solar Energy Industries Association. (2026, February 4). We Need Solar and Storage to Address the Energy Emergency.; Statista. (2025, May 9). Capacity Factors for Selected Energy Sources in the United States in 2024.; World Nuclear Association. (2026, March 26). Carbon Dioxide Emissions From Electricity.
Global X analysis derived from: BloombergNEF. (2026, May 19). New Energy Outlook 2026.; Ritchie, H., & Rosado, P. (2025). United States Energy Country Profile. Our World in Data. Forecasts reflect BloombergNEF’s Economic Transition Scenario, a technology-led base case in which energy sources compete on cost under current policy settings. Actual generation and capacity additions may vary with financing, permitting, supply chains, grid connections, fuel prices, and demand. Shares are relative to 2025 U.S. generation.
Ibid.
Ibid.
Global X analysis derived from: BloombergNEF. (2026, May 19). New Energy Outlook 2026.; Ritchie, H., & Rosado, P. (2025). United States Energy Country Profile. Our World in Data.
U.S. Energy Information Administration. (2026, September 9). Short-Term Energy Outlook.; U.S. Energy Information Administration. (2026, April 8). Annual Energy Outlook 2026.; U.S. Energy Information Administration. (2026, February 24). Today in Energy.
Global X analysis derived from: U.S. Energy Information Administration. (2026, April 8). Annual Energy Outlook 2026.
Global X analysis derived from: U.S. Energy Information Administration. (2026, August 31). U.S. Dry Natural Gas Production.; U.S. Energy Information Administration. (2026, August 31). Petroleum & Other Liquids.
Global X analysis derived from: International Atomic Energy Agency. (2025). Energy, Electricity and Nuclear Power Estimates for the Period up to 2050.; U.S. Department of Energy. (2023, December 1). At COP28, Countries Launch Declaration to Triple Nuclear Energy Capacity by 2050, Recognizing the Key Role of Nuclear Energy in Reaching Net Zero.
Bloomberg Intelligence. (2025, October 23). X-energy Leads Small Nuclear Development.; BloombergNEF. (2026, May 19). New Energy Outlook 2026.; Kaufman, A. (2026, September 18). Nuclear Is Cheaper Than We Think It Is. Heatmap.; L, Jennifer. (2026, April 22). What Is SMR? The Ultimate Guide to Small Modular Reactors. CarbonCredits.com.; NuScale. (2025, March 3). 2025 Annual Report.; NuScale. (n.d.). NuScale Power Module. Accessed September 21, 2026.; U.S. Department of Energy. (2023, March). Pathways to Commercial Liftoff: Advanced Nuclear.; U.S. Energy Information Administration. (2025, August 11). Five Countries Account for 71% of the World’s Nuclear Generation Capacity.; WattThe?!. (n.d.). SMR vs. Traditional Large Reactor Cost Comparison Calculator. Accessed September 21, 2026.; World Nuclear Association. (2025, January 6). World Energy Needs and Nuclear Power.; World Nuclear Association. (2025, October 1). Small Modular Reactors.; World Nuclear Association. (2026, July 29). Small Modular Reactor (SMR) Global Project Tracker.
Amazon News. (2025, October 16). How Amazon Is Helping to Build One of the First Modular Nuclear Reactor Facilities in the United States.; Chapman, M. (2026, January 9). Meta Lines Up Massive Supply of Nuclear Power to Energize AI Data Centers. AP News.; Kairos Power. (2025, August 18). Google, Kairos Power, TVA Collaborate to Meet America’s Growing Energy Needs.
Global X analysis derived from: TradeTech. (2026). FAM 1 Mine Data Base, Q2 2026. Demand and supply are in pounds of uranium oxide. The supply gap is about 25 million pounds in 2025 and about 164 million pounds in 2045.
S&P Global. (2023, June 6). Discovery to Production Averages 15.7 Years for 127 Mines.
BloombergNEF. (2026, May 19). New Energy Outlook 2026.
Global X analysis derived from: BloombergNEF. (2026, September 9). Power Purchase Agreements. Totals sum solar, wind, co-located, and other agreements signed from 2020 through September 9, 2026.; Rand, J., Cheyette, A., Talley, C., et al. (2026, July 16). Queued Up: 2026 Edition. Lawrence Berkeley National Laboratory. Installed capacity is as of 2025.
BloombergNEF. (2026, May 19). New Energy Outlook 2026.
Bloom Energy. (2026, June). 2026 Utilities Insights: How Onsite Power Is Becoming Part of the Large Load Strategy.
Bloom Energy. (2026, August 6). Time to Power: The New Competitive Advantage for Manufacturers.; Bloom Energy. (2026, June). 2026 Utilities Insights: How Onsite Power Is Becoming Part of the Large Load Strategy.; Rystad Energy. (2026, June 25). Fuel Cell Investment by Data Centers Set to Grow Tenfold, Reaching $30 Billion by 2030.
BloombergNEF. (2026, February 18). Battery Storage Costs Hit Record Lows as Costs of Other Clean Power Technologies Increased.; BloombergNEF. (2026, May). New Energy Outlook 2026.; Boyer, C., Bourgeois, W., & Bryant, S. (2025, August). Power Solutions for Large Loads: Mastering Electrical Supply for New Industrial Facilities. Mavs Open Press.; Centre for Alternative Technology. (n.d.). Battery Storage. Accessed September 21, 2026.; U.S. Energy Information Administration. (2026, August 26). Electric Power Monthly.; Lazard. (2026, July). Levelized Cost of Energy.; National Laboratory of the Rockies. (n.d.). Utility-Scale Battery Storage. Accessed September 21, 2026.; Ørsted. (2025, September). Energy That Works: South Fork Wind.; Solar Energy Industries Association. (2026, February 4). We Need Solar and Storage to Address the Energy Emergency.; Statista. (2025, May 9). Capacity Factors for Selected Energy Sources in the United States in 2024.; World Nuclear Association. (2026, March 26). Carbon Dioxide Emissions From Electricity.
Rand, J., Cheyette, A., Talley, C., et al. (2026, July 16). Queued Up: 2026 Edition. Lawrence Berkeley National Laboratory. Installed and queued capacity are as of 2025, and the median connection time is for 2025.
International Energy Agency. (2026, February 6). Electricity 2026 Outlook.
Global X analysis derived from: Powerlines. (2026, April). Utility Spending Is Rising: A Review of Utility Capital Expenditure Plans. Transmission and distribution, generation, and other spending are summed over 2026 to 2030.
Global X analysis derived from: Quanta Services. (2026, July 30). Quanta Services Reports Second Quarter 2026 Results.; MasTec. (2026, July 30). MasTec Reports Second Quarter 2026 Results and Updates Full Year 2026 Financial Guidance.; Ruiz, P., & Foster, D. (2026, July 31). Second Quarter 2026 Earnings Release. Eaton.; Powerlines. (2026, April). Utility Spending Is Rising: A Review of Utility Capital Expenditure Plans.
BloombergNEF. (2026, May 19). New Energy Outlook 2026.
Ibid.
Global X analysis derived from: Bloomberg LP. (n.d.). S&P 500 Aggregate Sector Weights over Time. Data as of August 31, 2026. Accessed September 19, 2026. Energy, utilities, and grid equipment as defined in the source chart.
Bloomberg. (n.d.). Overlap with the S&P 500. Accessed October 30, 2026.
AI is driving a stack of interlinked technologies, from semiconductors to data centers to energy, shaping the next era of growth and innovation.
AI is driving a stack of interlinked technologies, from semiconductors to data centers to energy, shaping the next era of growth and innovation.
We remain optimistic on the long-term growth potential of electric vehicles, thanks to supportive government policies and improving battery technology.
We remain optimistic on the long-term growth potential of electric vehicles, thanks to supportive government policies and improving battery technology.
Orbital data centers represent a credible opportunity for space tech companies, though economic viability may take time to emerge.
Orbital data centers represent a credible opportunity for space tech companies, though economic viability may take time to emerge.
