The late 90s. It was the best of times… and the best of times. We watched must-see TV like Friends and Seinfeld, hummed along to “Livin’ La Vida Loca,” and worried needlessly about the Y2K bug. The U.S. economy was growing at 4-5% with venture-backed click-and-mortar start-ups popping up like spring flowers.1 Then in March 2000, the market rolled over, setting stage for the lost financial decade that was the aughts, when equities flatlined alongside decelerating economic growth.
The dotcom boom-bust is etched in the ethos of many on Wall Street, adding a layer of unease to the recent tech-fueled equity rally and the hymns of AI prophets. That feeling is natural. Mark Twain was right: History doesn’t repeat itself, but it often rhymes.2 Ignoring history is perilous, but for investors, so too is drawing the wrong lesson.
In this case, the differences between the current market backdrop and that of the late 1990s are palpable, suggesting that AI is no dotcom.
Key Takeaways
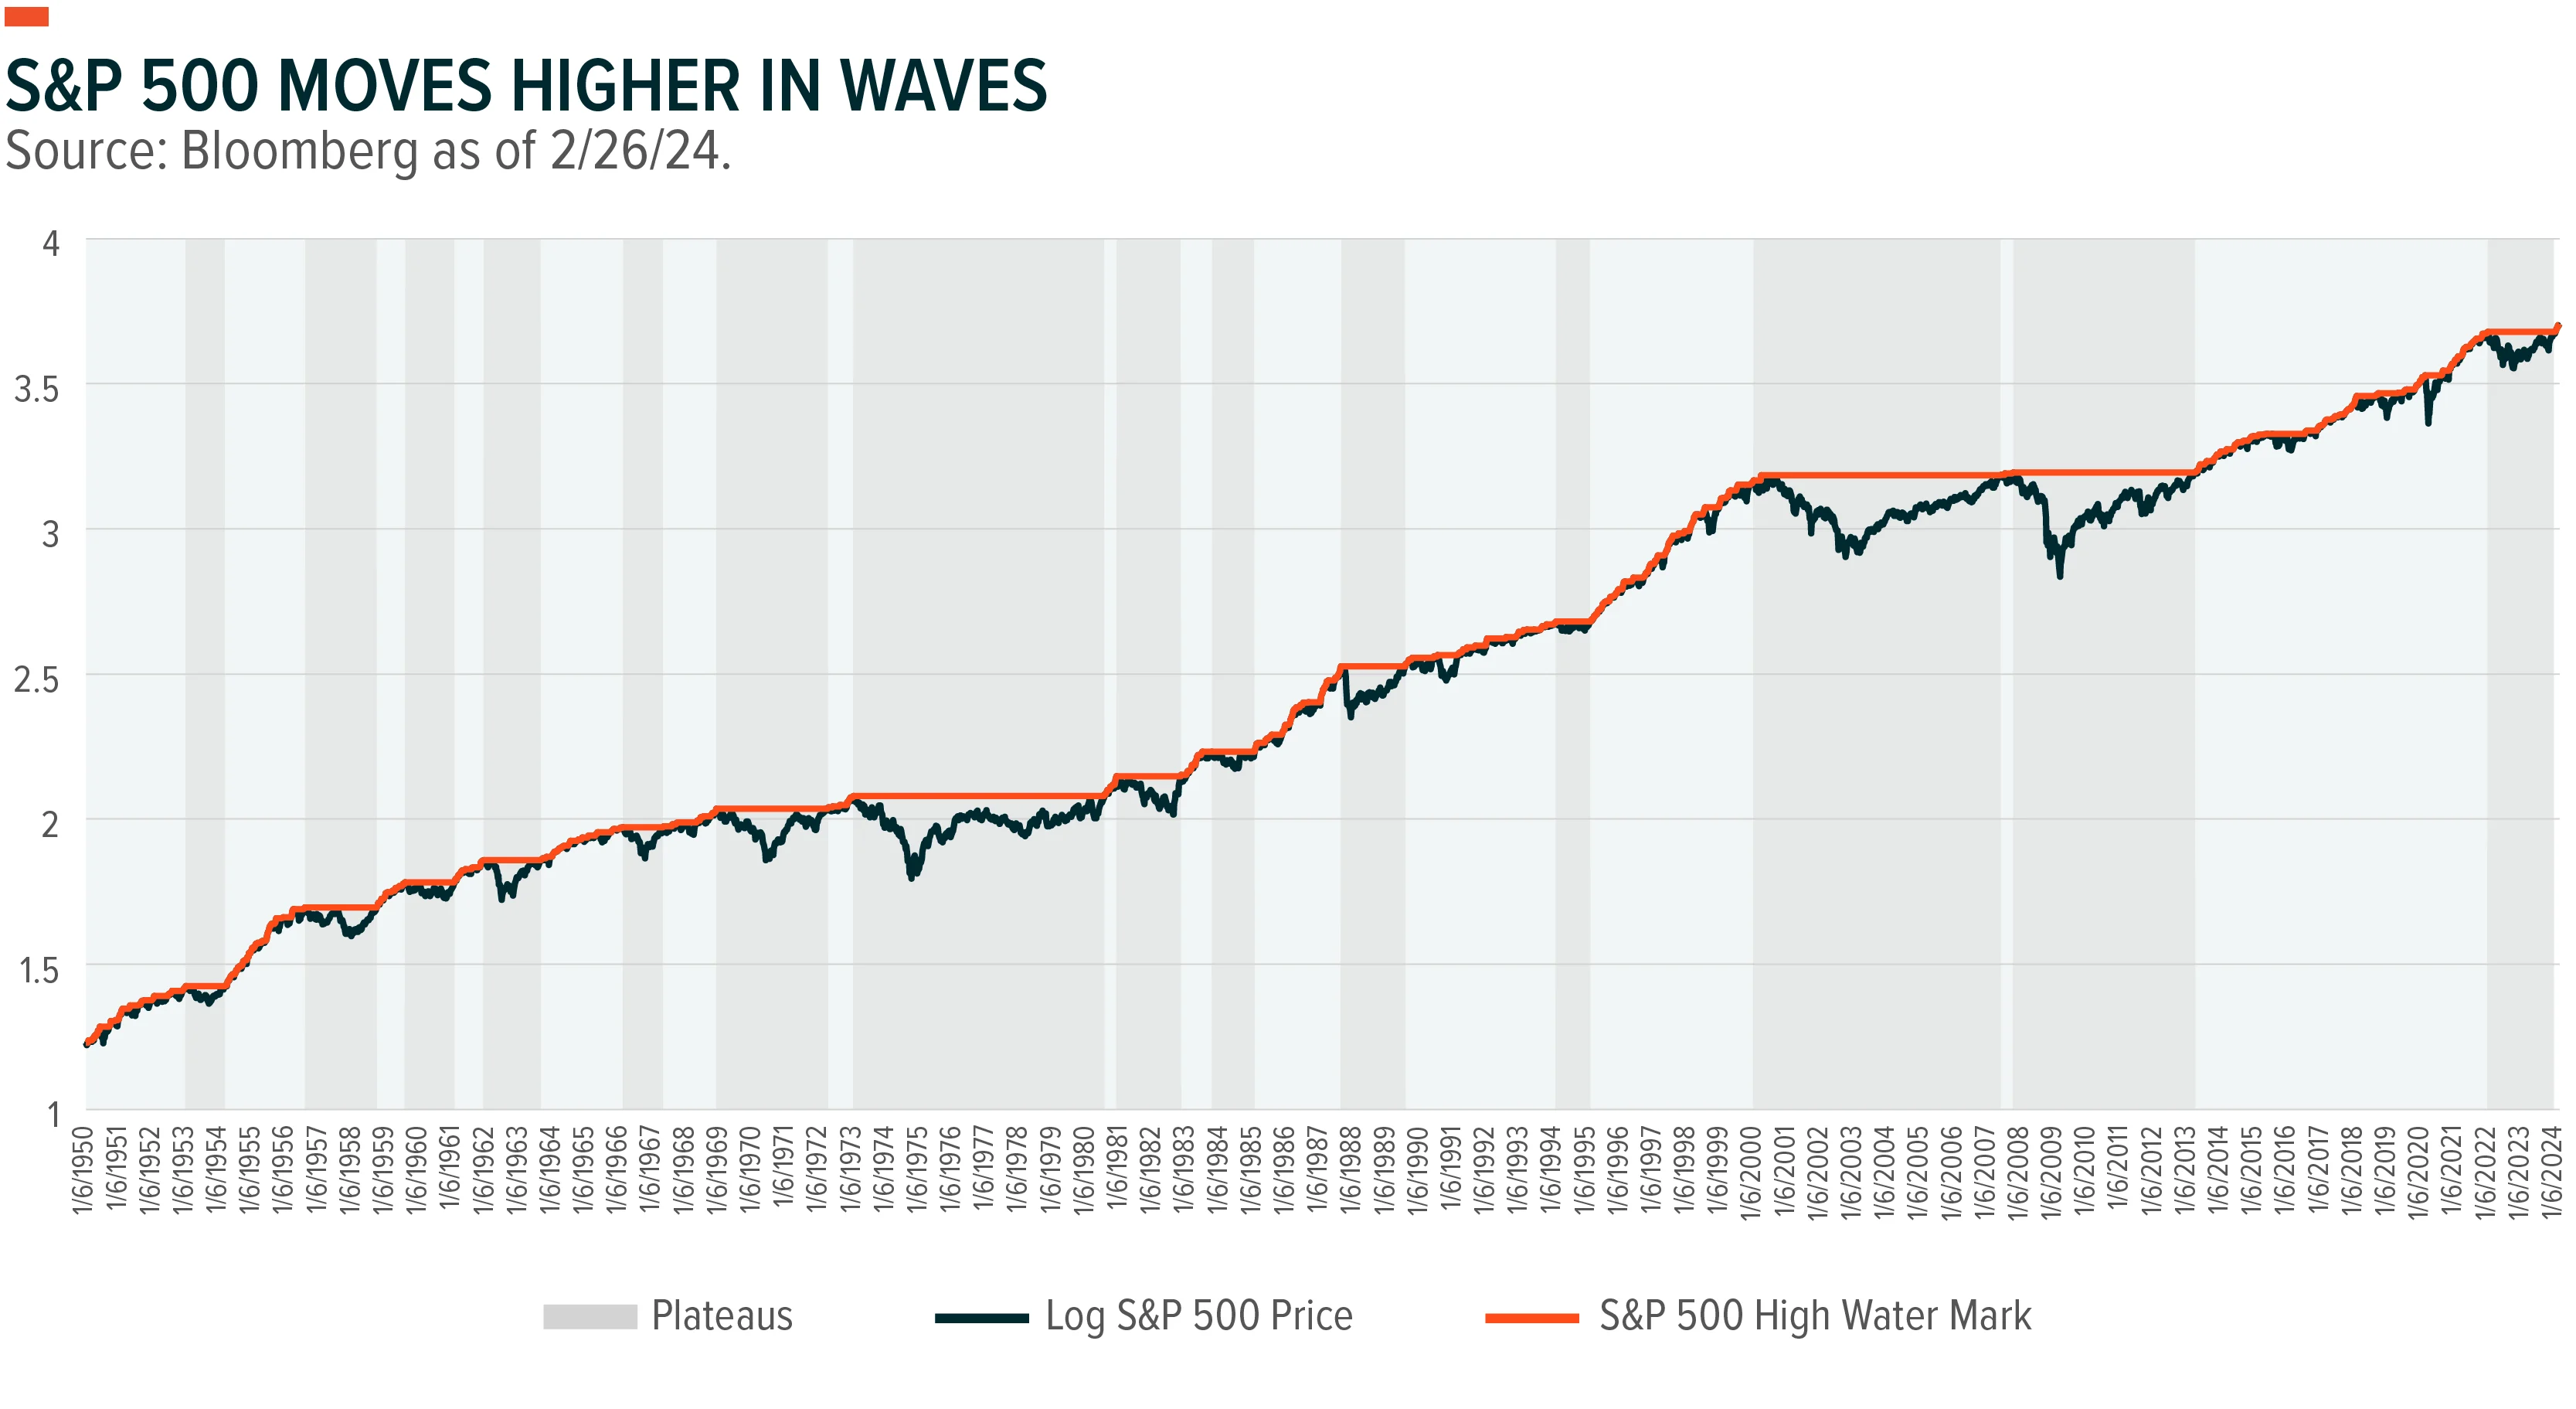
Since 1950, markets go through extended periods of stasis followed by expansion, supporting the argument that the recent rally may still be in the early stages.
Tech’s recent outperformance may evoke memories of the dotcom boom-bust, but this market has a level of quality that was absent in the dotcom era. Valuations are still well below late 90’s bubble levels, corporate profitability is near all-time highs, and balance sheets are strong.
Several technology themes, including AI, Robotics & AI, Internet of Things, and Cybersecurity score higher than the S&P 500 on quality factors with limited mega-cap exposure.
Dialing Up Historical Market Expansions
Yes, U.S. equity markets have rallied to start the year. Yes, this rally follows the 2023 move higher off the October 2022 lows. And yes, over the past 16 months the S&P 500 is up 41% and the Nasdaq 100 is up 67%.3 At first glance, these gains seem uncharacteristically impressive, almost bubble-like, but there is value in looking at historical patterns, including those before the now-archaic days of dial-up internet.
Since 1950, equity markets tend to move higher in fits and starts. The S&P 500 remains in stasis for extended periods and then expands to new highs before leveling off, usually triggered by a sell-off. During this period, the S&P 500 reached a highwater mark 14 times and then plateaued for at least 12 months (see chart).4
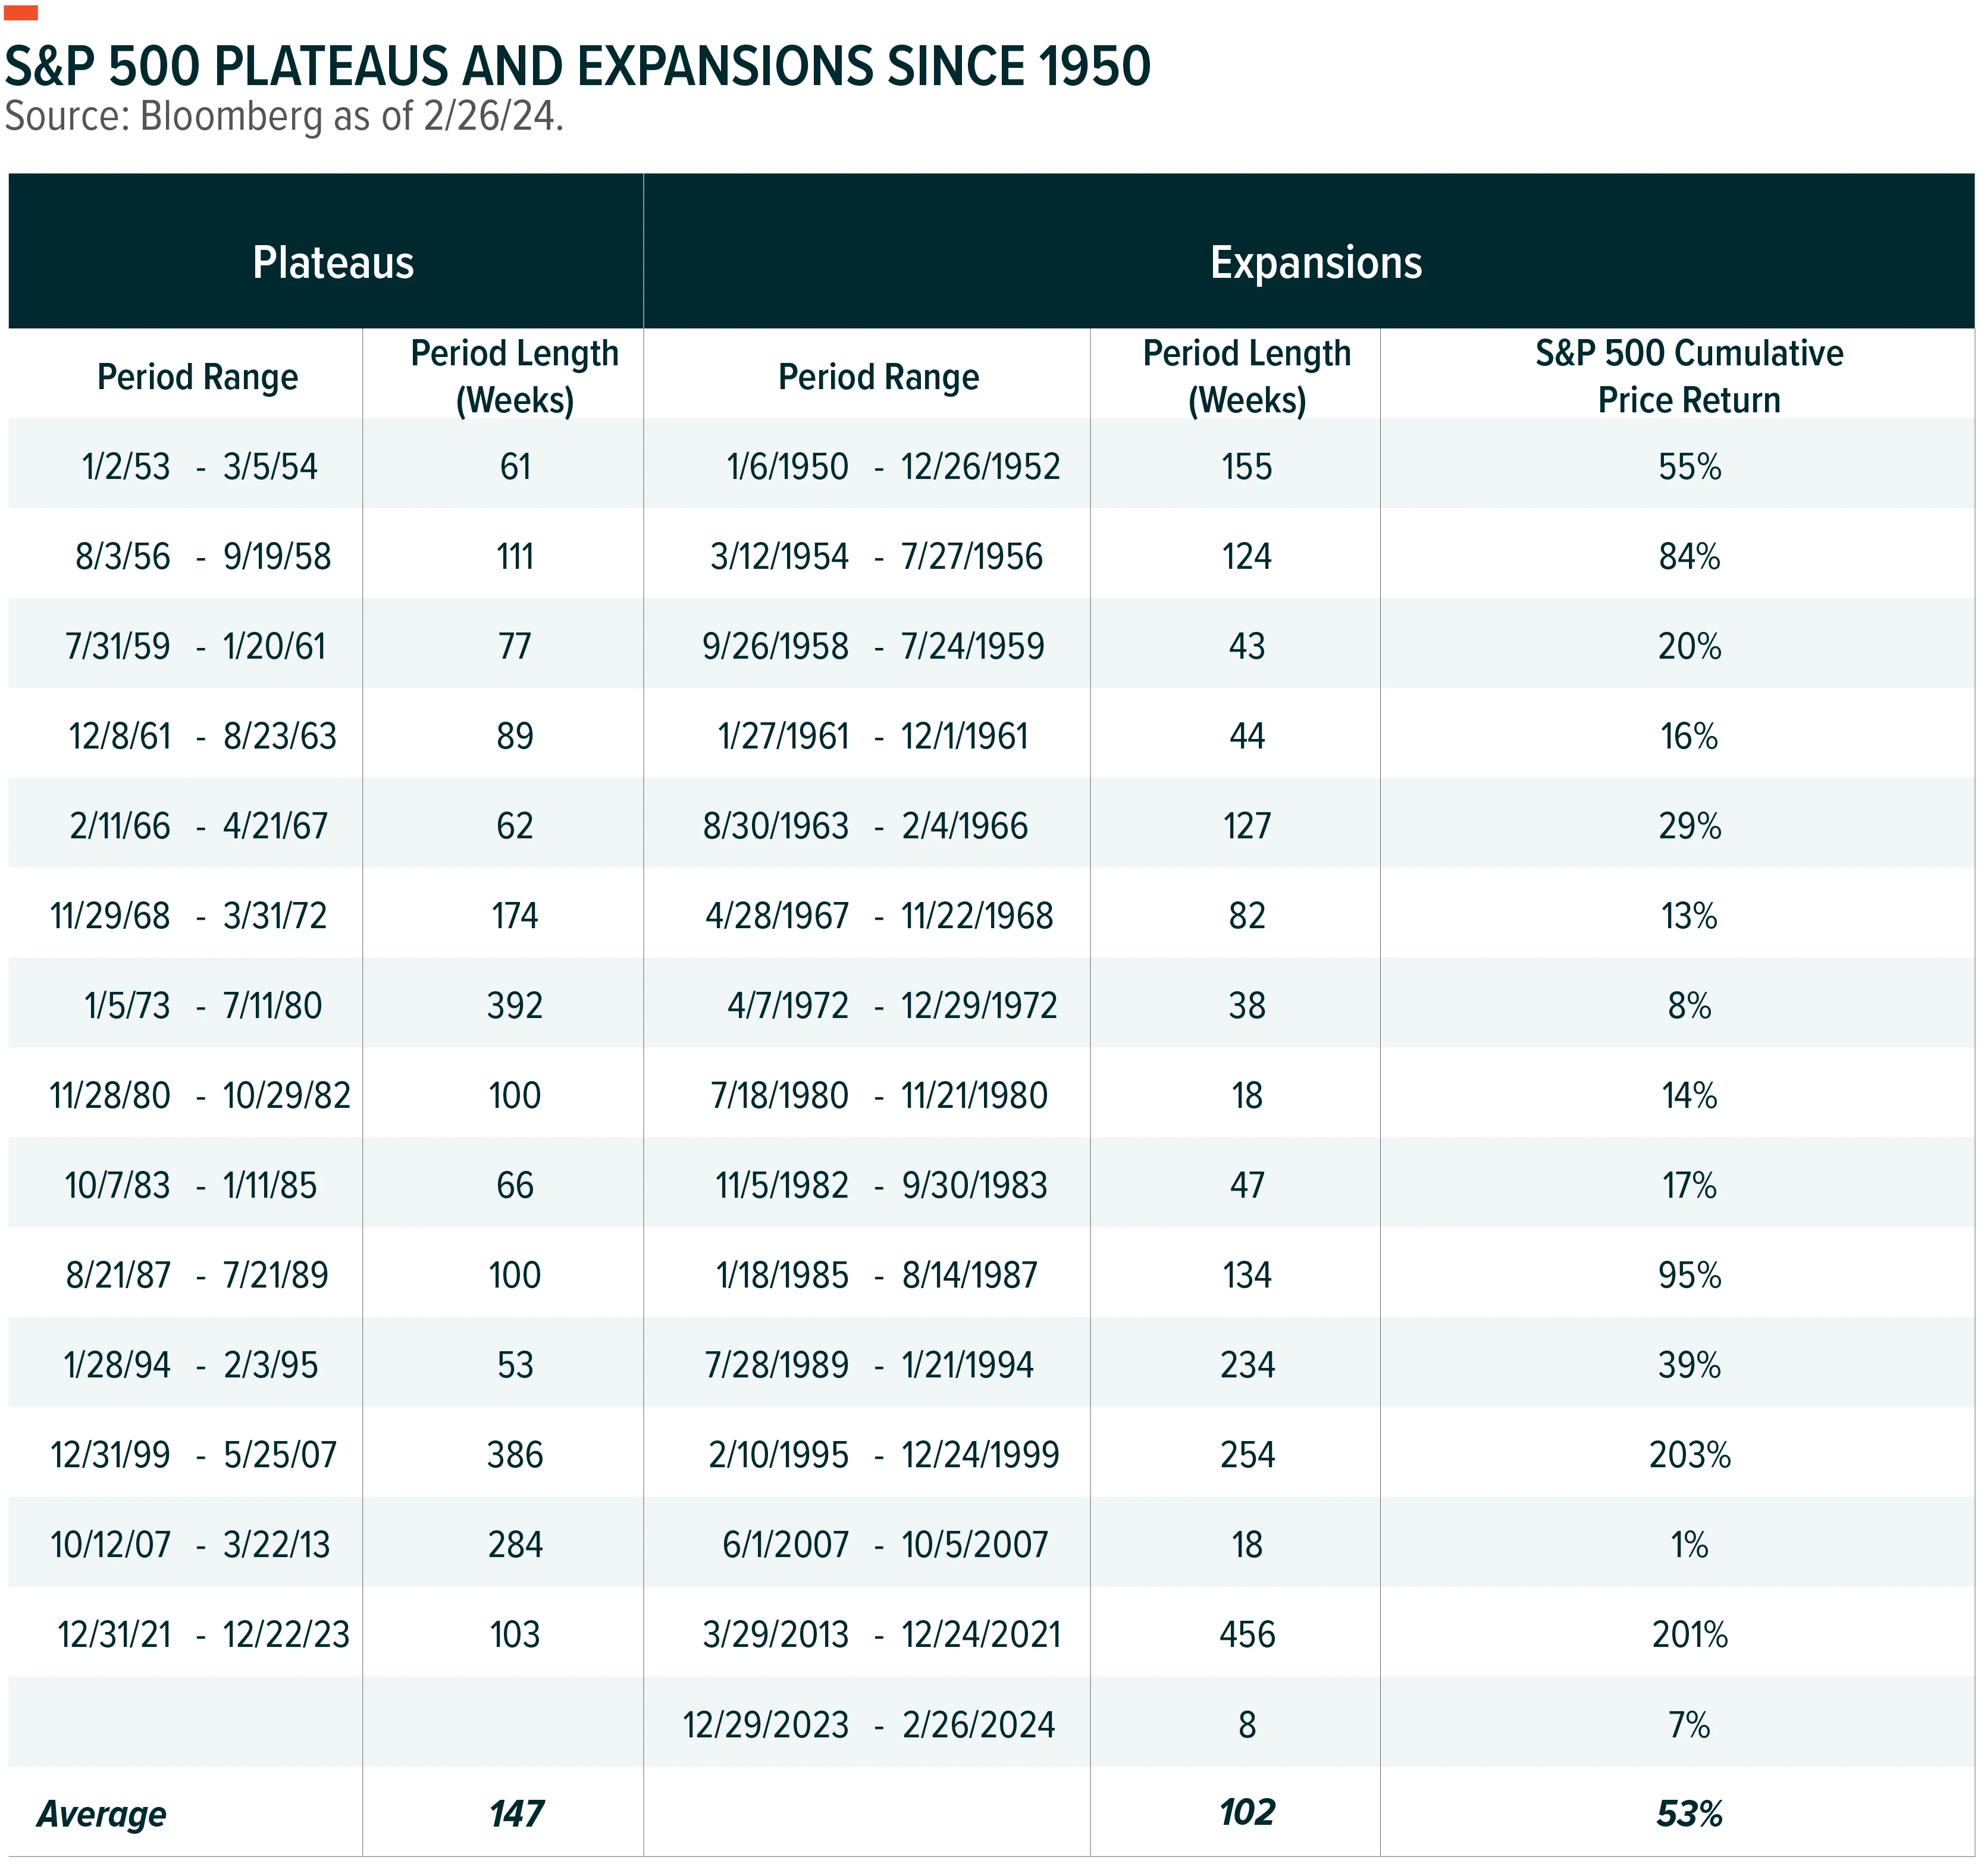
As for the current expansion, markets may just be getting off the launchpad. The average length of the plateau is 147 weeks, or almost 3 years (see table).5 The most recent stagnation started in December 2021 and lasted almost 2 years. Expansions are typically a little shorter, averaging 119 weeks, or just over 2 years. The latest expansion started just 8 weeks ago when the S&P 500 hit a new highwater mark. Since then, the S&P 500 is up 7%, well below the average expansion of 53%. The expansion in the late 1990s lasted over 250 weeks where the S&P 500 appreciated 203%. Historical patterns are not necessarily predicative, but they can be informative.
The Market Ain’t Partying Like It’s 1999
Sometimes, though, attempting to find patterns that don’t exist can lead investors astray. A tech-led rally fueled by AI excitement evokes obvious analogies with the dotcom bubble. Perhaps because, for those of us of a certain vintage, the boom-bust was a career-shaping event. Or perhaps because some of us were still studying analogies for their SATs back then. While there are surface-level commonalities, this market’s different and healthier than the market investors faced in the late 1990s.
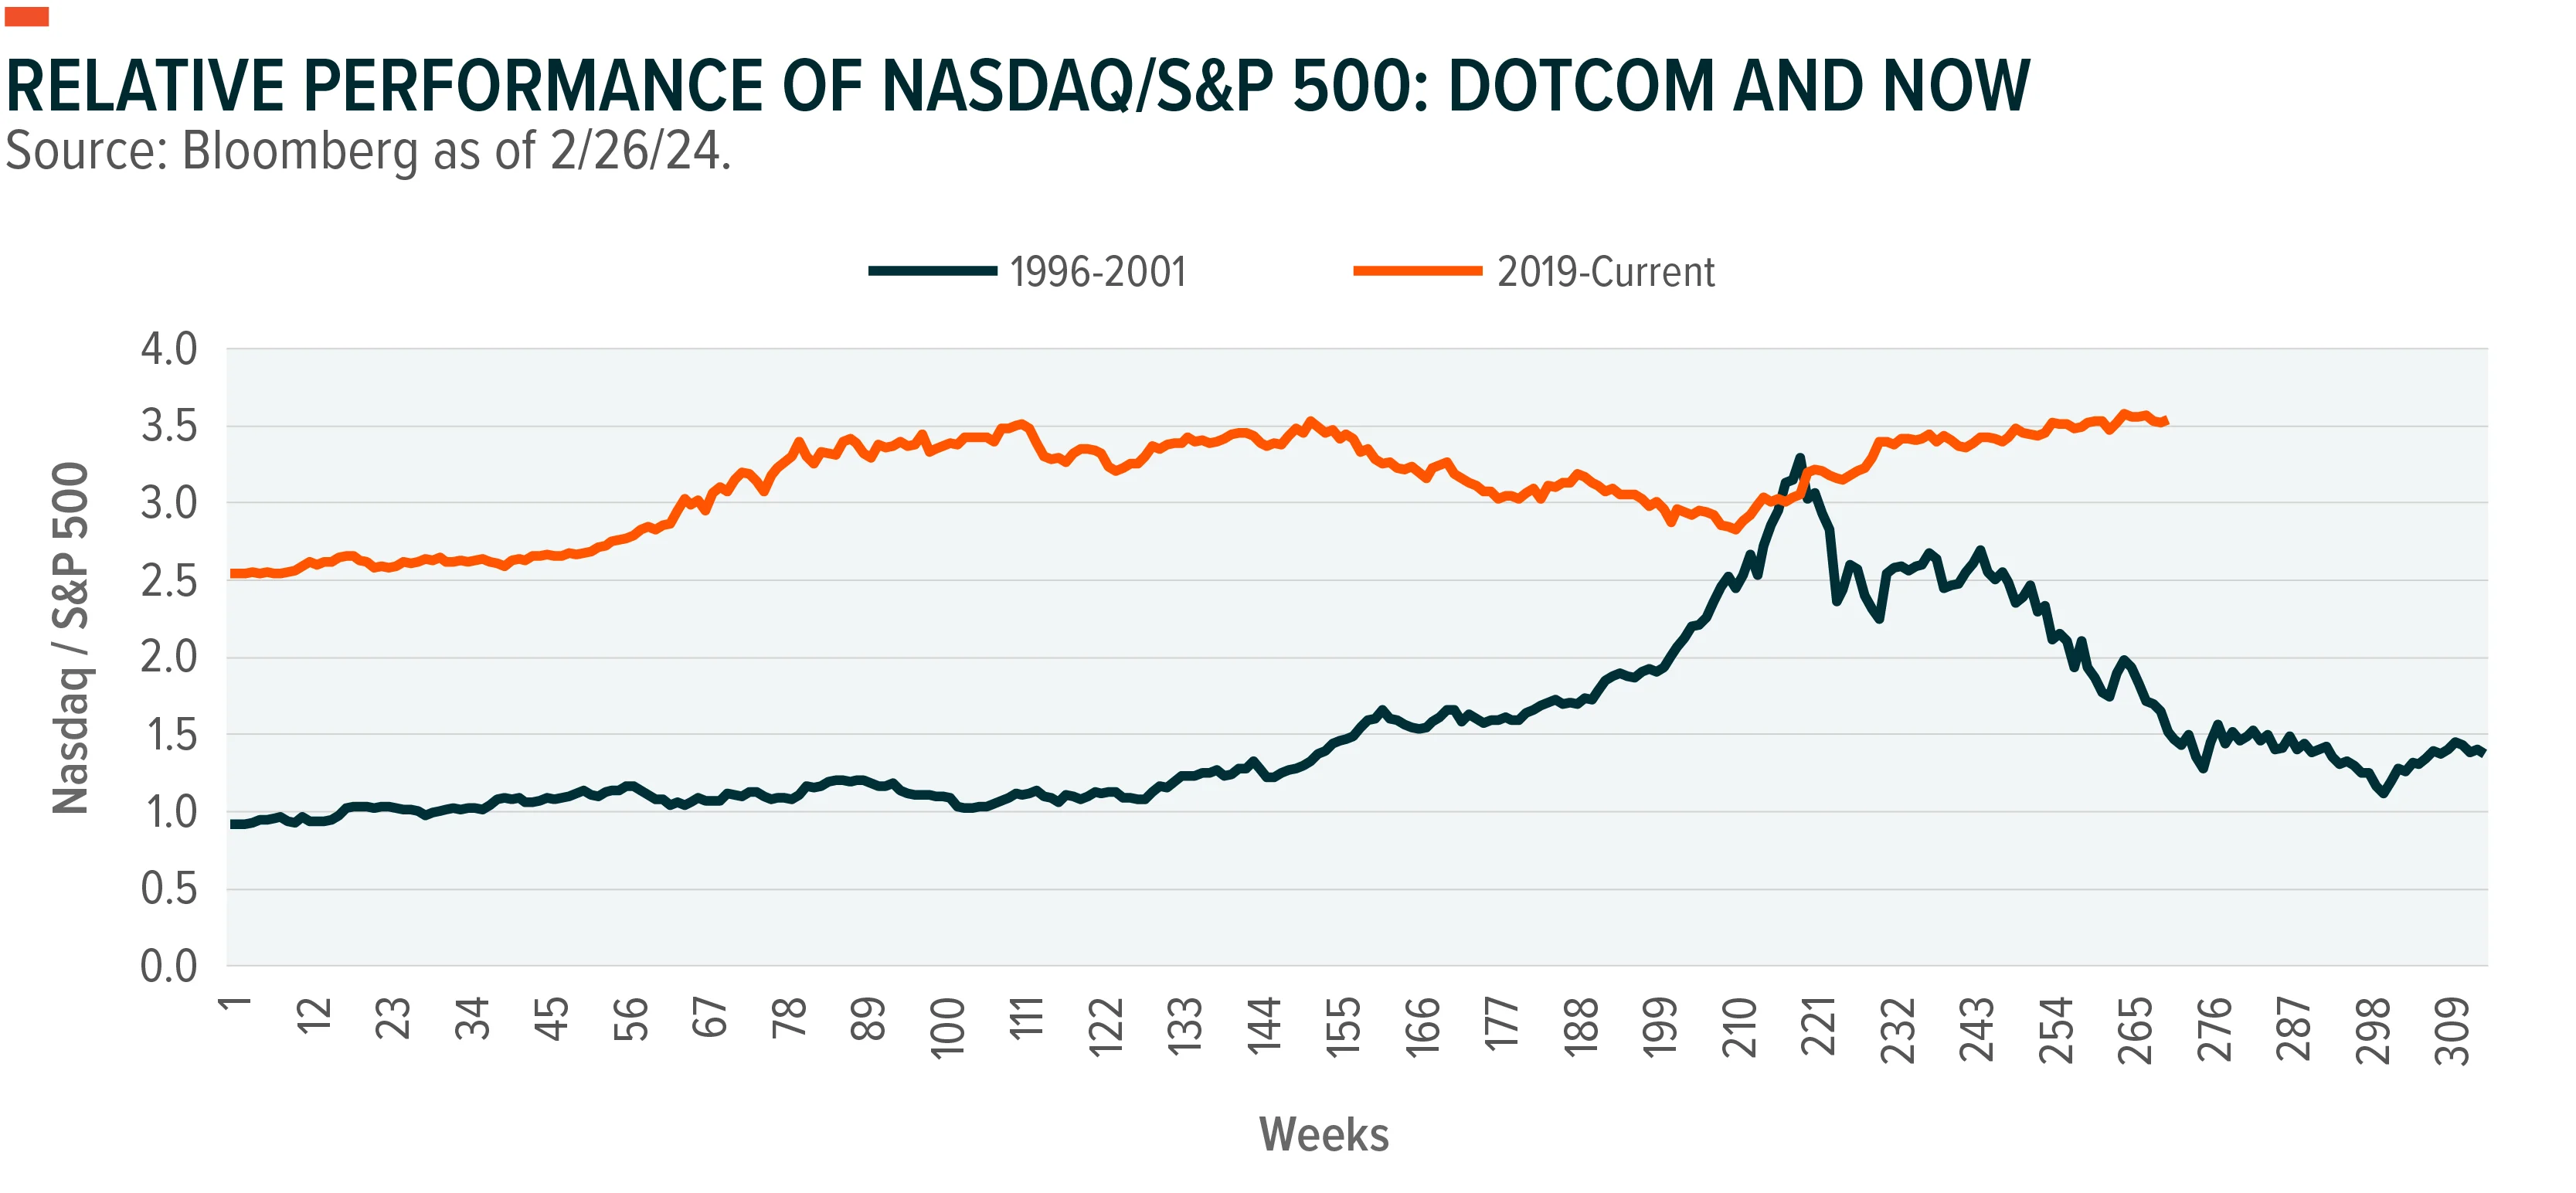
Tech is an important catalyst in the recent rally, just as it was 25 years ago, but the magnitude of its outperformance is not equivalent (see chart). From 1996 to the market peak in March 2000, the Nasdaq 100 rose 701% compared to the S&P 500 at just 146%.6 That more than sixfold difference is not the situation today, with the Nasdaq 100 up 182% compared to the S&P 500 at 102%.
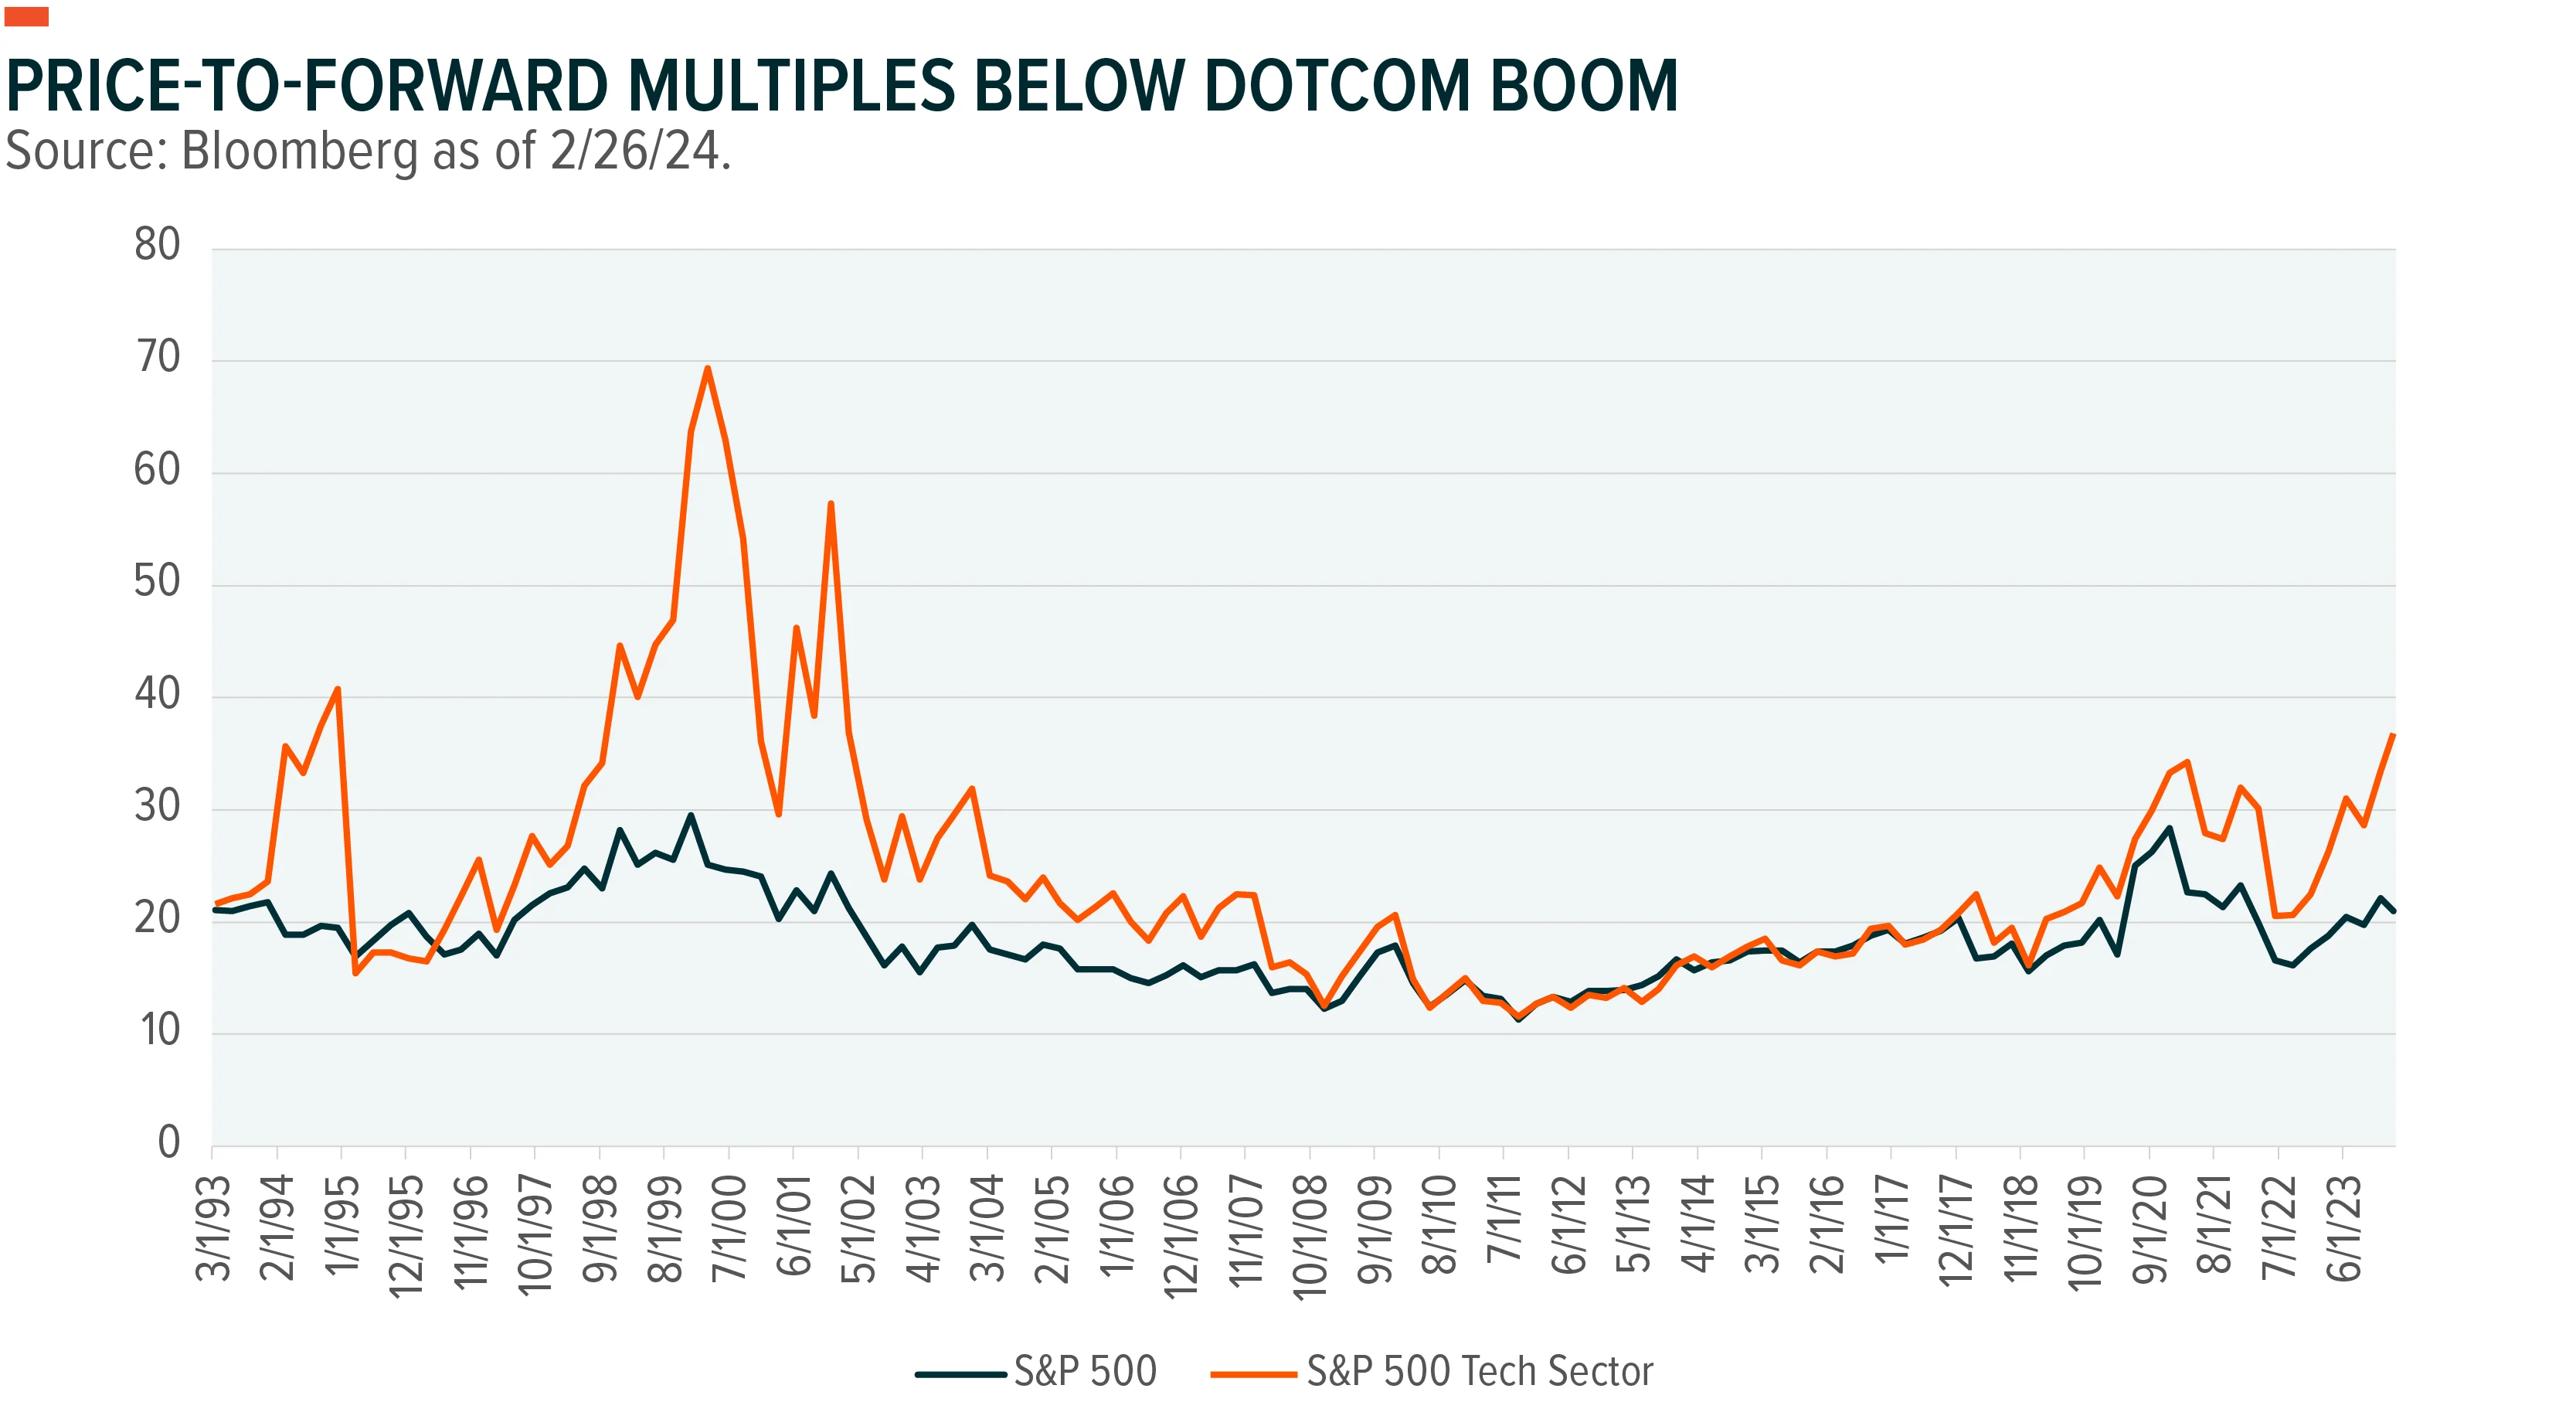
Similarly, while today’s valuations seem elevated (see last month’s Inflection Points for more), they do not mirror the dotcom’s exuberance.7 The S&P 500 Information Technology Index reached valuations of 70x price to forward earnings in Q1 2000.8 The S&P 500 peaked out near 30x the prior quarter, a roughly 40-point differential. The current differential is 16 points, with the S&P 500 at 21x compared to the Tech sector at 37x. The Tech sector premium is clearly widening, but valuations are not nearly as stretched or as disconnected.
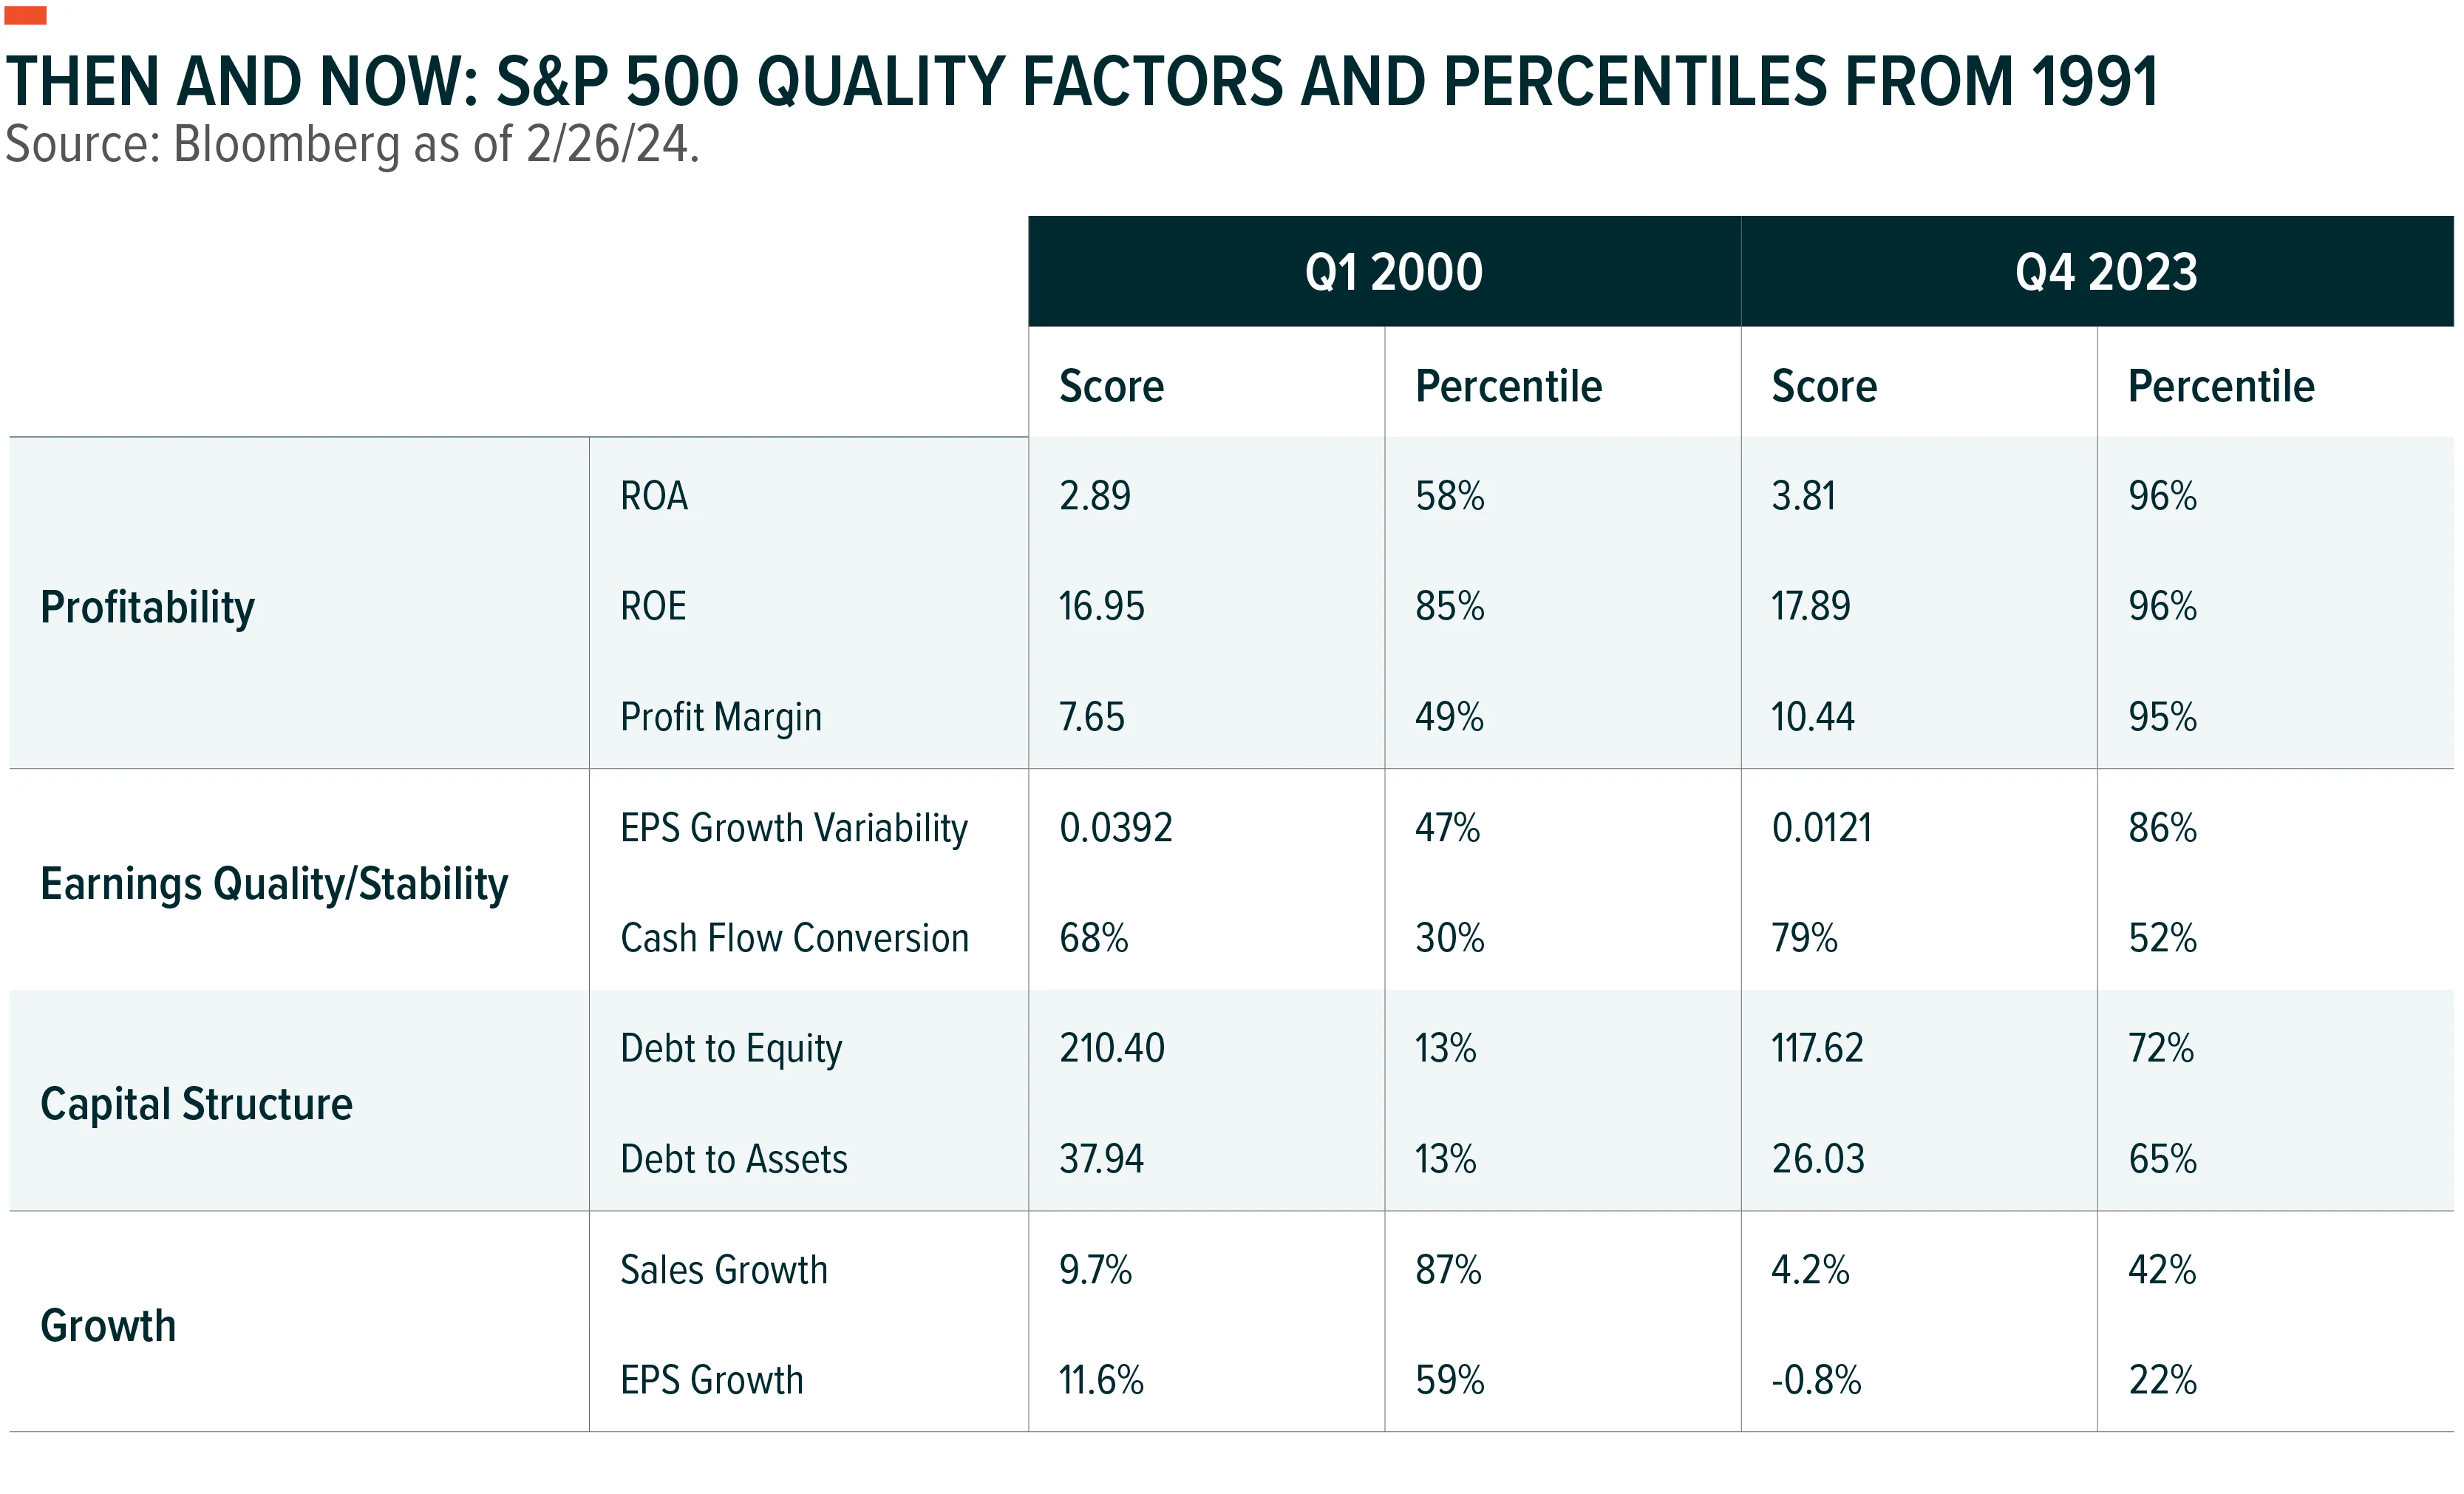
Beyond price and valuation, S&P 500 companies are performing better on metrics associated with quality investing (see chart). There is no single definition of quality, but most factor analyses use some variation of profitability, earnings quality or stability, capital structure, and growth.9 Today, quality fundamentals for three of the four measures are superior to those at the top of the dotcom bubble in Q1 2000. The S&P 500 has meaningfully higher profitability, better quality and stability in earnings, and a more conservative capital structure.10 The only area where dotcom scored better was growth, which is not surprising given the decelerating U.S. economy with modest yet persistent inflation.
Differences in market expectations are key as well. Expectations about the transformational nature of the internet led to unsustainable valuations and the eventual bust. That is only part of the story though. The internet did usher in a new era of social and commercial interaction that required a seismic shift in consumer preferences, technological know-how, and digital infrastructure. Only, the changes took decades rather than years.
Important to remember now is that the internet and AI are different technologies. The internet, first and foremost, was a consumer-led technology, and AI is probably not.11 The largest beneficiaries of AI are companies that deploy AI. Practical use of AI to drive efficiency and lower cost does not require shifting behavioral patterns of millions or billions of consumers. AI interfaces are increasingly user friendly, reducing the need for specialized knowledge. Wide adoption will require increased hardware build, but service providers and users have existing capabilities to build upon rather than having to start from scratch. As a result, the time to monetize AI is likely shorter than the internet’s buildout.
That said, it is hard to argue that AI expectations match the exuberance in the dotcom rally. In 1999, the Tech and Communications sectors accounted for 59% of the IPO market cap, versus just 10% in 2023.12 Earnings expectations, while perhaps modestly elevated today, are nowhere near levels in the late 1990s. From 1998–2000, Tech sector EPS growth expectations were at 123%.13 Currently, forecasted 2-year EPS growth is 42%. In 2000, Tech delivered profit margins of 10% compared to 21% at the end of 2023, with less earnings variability and higher cash conversion. AI might be buzzy, but fundamentals seem to be leading the zeitgeist rather than the other way around.
We Don’t Need No Matrix for More Gains
Interest in AI isn’t new. It’s waxed and waned in one form or another for almost 75 years. So maybe what we’re seeing right now is just a massive hype cycle that culminates in a “trough of disillusionment” after AI’s benefits fail to fully materialize.14
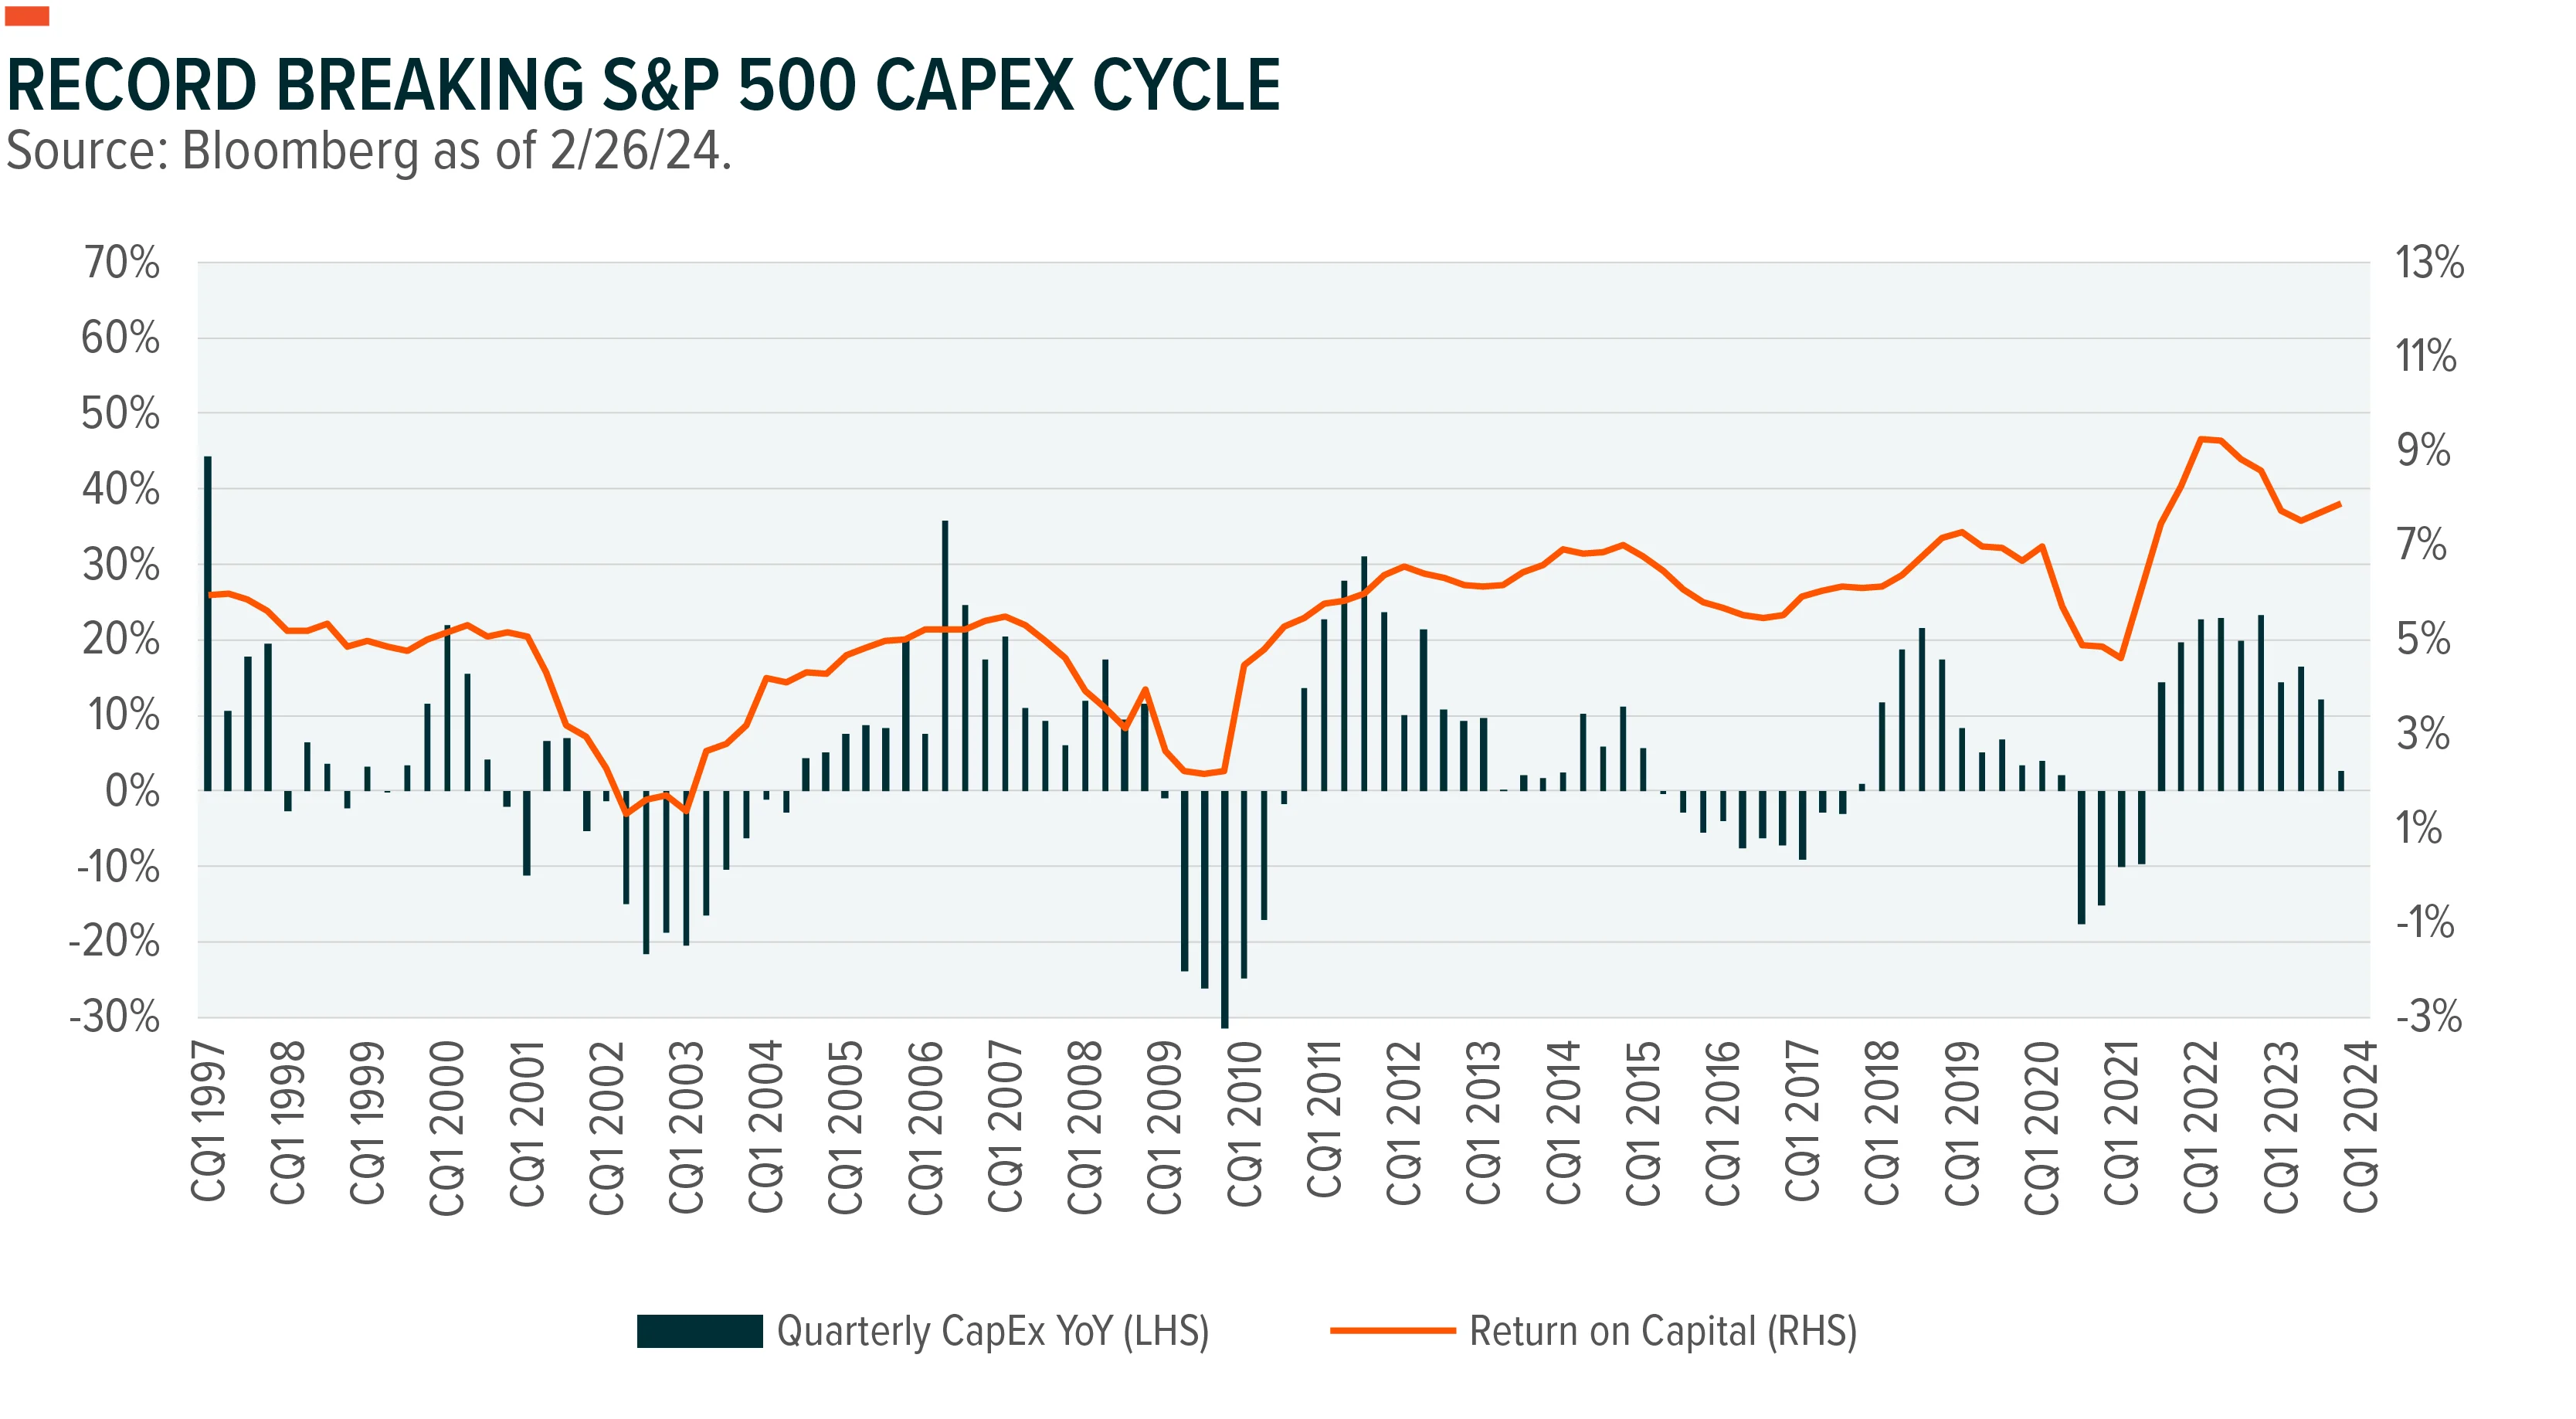
Even in that unlikely scenario, AI might not need to realize full potential for material economic benefits that propel further market gains. For example, perhaps companies spend $1 trillion on AI and realize $16 trillion in cost savings over the next 10 years.15 Companies have been spending, with capital expenditure growing by double digits for the longest streak since 1990 (see chart). Current expectations do not completely factor in that type of step change. S&P 500 EPS is expected to grow only 22% by 2025, below the 30-year average of 31%.16 There’s also ample cash, to the tune of $6 trillion, still sitting on the sidelines. Flows to money markets have leveled off, and a reversal could add fuel to the equity markets.
The AI boom does not seem like a replay of the dotcom boom-bust, but in any case, prudence is warranted. High-quality themes and companies offer a way to add exposure to AI while considering risk. Interestingly, quality is no longer limited to oldline, stodgy industries like manufacturing. The market decline in 2022 and the higher interest regime helped impose capital discipline among many growth companies, raising the possibility of gaining exposure to growth themes and quality simultaneously.
To assess thematic quality, we evaluated the 25 investment themes regularly tracked in Inflection Points on the same quality metrics as the S&P 500. We ranked each of the indexes based on profitability, earnings quality, capital structure, and growth, and we summed the average ranks to derive a quality score. Six of the themes delivered quality scores that exceeded the broader the S&P 500, and all are associated disruptive technological growth (see chart).17
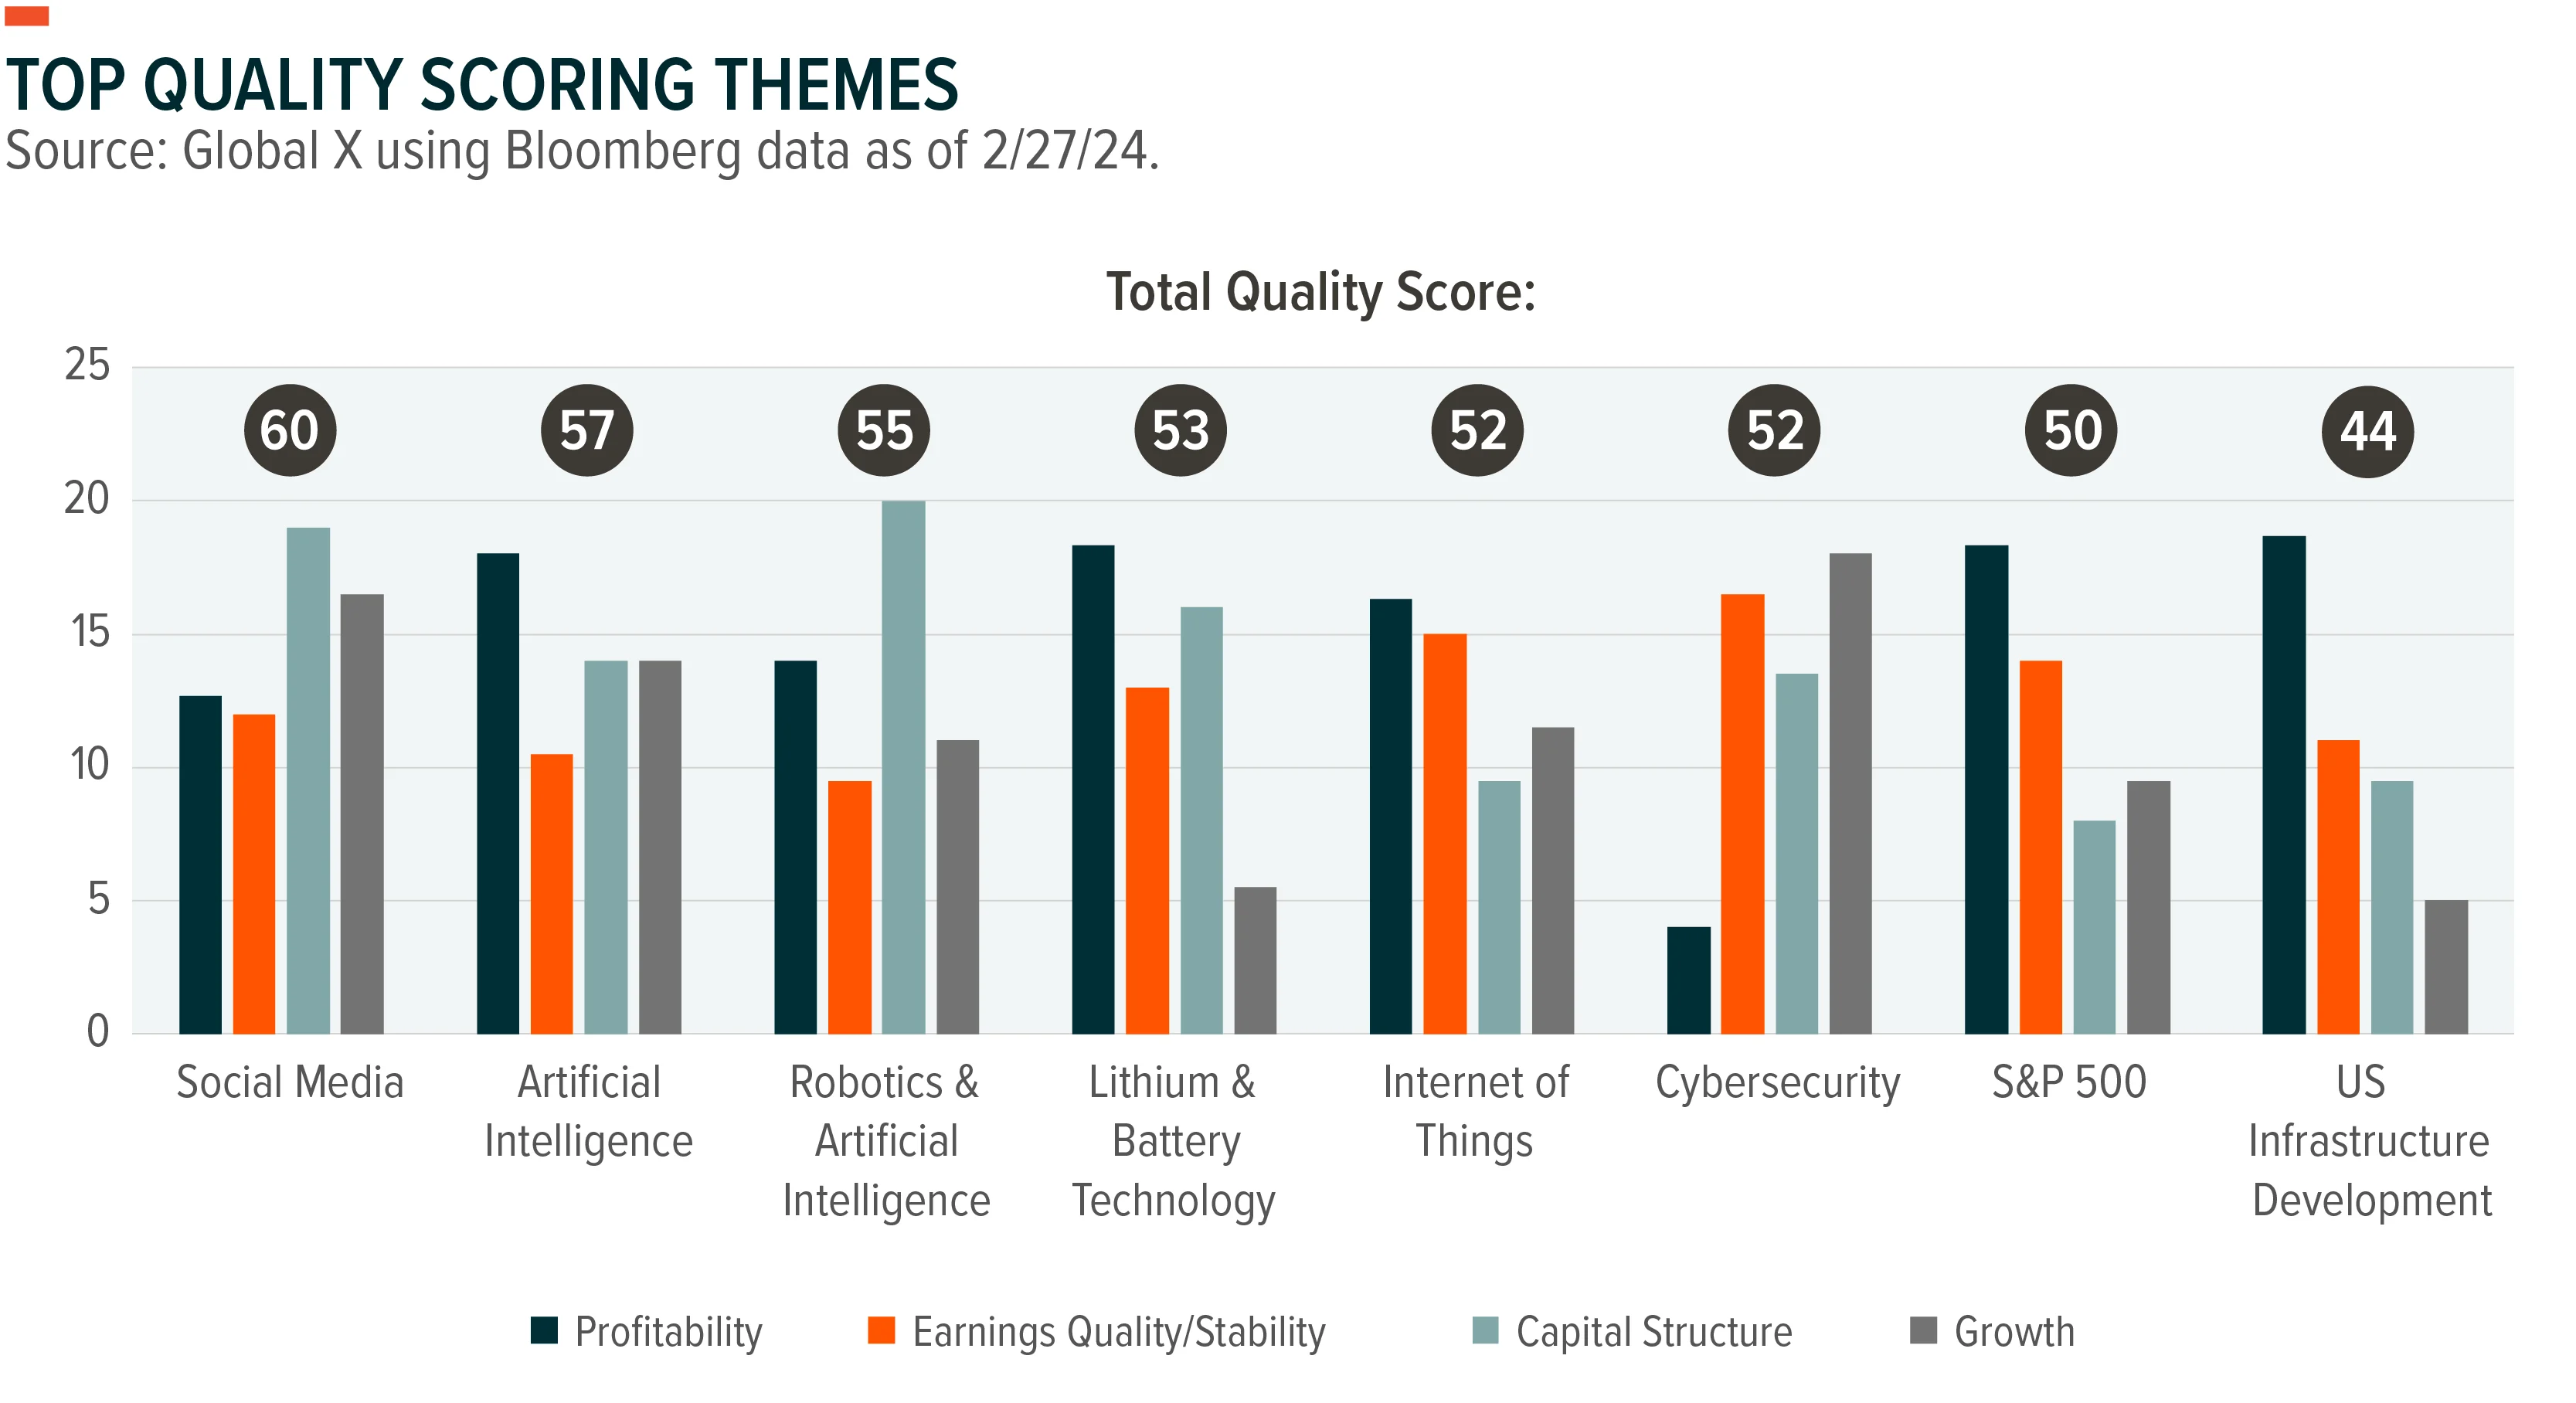
Social Media was well-balanced across factors and scored the highest, but three AI-related themes also had quality scores better than the broad index. AI, Robotics & AI, and Internet of Things scored consistently across factors and outperformed on profitability, which was not characteristic of many dotcom stocks. The software-focused AI theme was relatively balanced across the factors, Robotics & AI displayed a disciplined capital structure, and Internet of Things delivered on earnings quality and stability. Lithium and Battery Technology and Cybersecurity rounded out the list of top performers.
Exposure to growth often comes with tradeoffs, but these high-quality themes are closely aligned with megatrends that are likely to define economies and markets for decades, including demographic shift, automation, digitalization, green energy, and geopolitical volatility. With AI increasingly prominent in all of them, what we’re seeing now might be the rare case where quality and trendy come in the same package.
Inflection Point Theme Dashboard