Thought LeadershipMacroeconomicInternational
2026 Outlook
M
Multiple authors
Dec 4, 20250 min read
Get the latest news and updates from our team.
Copyright © 2026 Global X. All rights reserved.
SEI Investments Distribution Co. (1 Freedom Valley Drive, Oaks, PA, 19456) is the distributor for the Global X Funds.
Check the background of SIDCO and Global X's Registered Representatives on FINRA's BrokerCheck.
Scott Helfstein
Multiple authors
Editor’s Note: Inflection Points is a monthly series intended to explore the underlying trends, dynamics and opportunities shaping the thematic investing landscape. Click here to receive future updates via email.
I started the year with strong conviction that the market’s most likely path was higher. This view was quite contrarian given persistent inflation and interest rates rising, among other headwinds. Key factors like labor, leverage, and liquidity were quite likely to deteriorate throughout the year as we are seeing in recent data, but they were favorable to start the year.1 My optimism was driven by the strength in the underlying economy paired with a good deal of cash on the sidelines. I still believe those two observations are intact, though the Silicon Valley Bank (SVB) failure and the resultant instability in the bank sector have fears of a credit contraction rising. A credit crunch could be the exogenous event that finally proves the bears right. So could the manufacturing slowdown or the coming debt ceiling debate.2 That said, a look into the data offers some reassurance and I remain cautiously optimistic about the market’s trajectory even if financial conditions tighten further. For investors, vigilance, not panic, remains critical in this environment.
Key Takeaways
The biggest banks seem well capitalized, but recent challenges to mid-sized institutions could lead to a modest credit contraction and add to concerns about slowing economic growth.
Technology and growth stocks, perceived to be at risk in a credit contraction, actually show better growth with lower leverage levels than the broader market.
Equity markets as forward-looking valuation tools are typically resilient when credit contracts, but investors may want to look at areas with lower leverage levels, including themes such as Robotics & Artificial Intelligence (AI) and Lithium & Battery Technology.
March was a bumpy month for banks. Traditionally, rising rate environments are good for banks because higher rates mean better net interest income. That old adage hit a wall, at least for Silicon Valley Bank, which mismatched duration of assets and liabilities. Solvency concerns triggered a run on SVB’s deposits, further reducing short-term capital, and then spread to other medium-sized institutions with similar business profiles like First Republic and Signature Bank. Swift measures from Washington seemed to contain the risk of contagion in the banking system.3
An ironic feature of public policies aimed at preventing past crises from happening again is that they usually have a way of setting conditions for the next crisis. For example, 2010’s Dodd-Frank Act, which aimed to shore up systemically important financial institutions, ended up producing well-capitalized large banks. To make that happen, more stringent capital requirements pushed big banks out of more speculative or risky businesses.4
This dynamic created opportunities for middle market players like SVB, which in 2007, prior to the Global Financial Crisis, had just $7 billion in assets. By 2022, SVB had over $200 billion in assets.5 Asset growth of 25% annually is impressive, but the regulatory environment that cast mid-sized banks as less important also encouraged risk-taking at some institutions. For example, a new set of concerns involves commercial real estate values and loans, which comprise a meaningful portion of regional bank balance sheets.6 Commercial real estate risk is not new in the COVID-19 era. Early on in pandemic, when offices and stores were empty, a friend said to me that the real estate industry was in a state of “pretend and extend.” By that, my friend meant pretending that asset values were not permanently impaired while extending favorable terms to survive the pandemic.
Only now, amid broader concerns about balance sheets, is commercial real estate lending gaining significant attention. While commercial real estate values could weaken, the market is smaller than U.S. residential lending and usually capitalized at higher rates. These recent real estate concerns are distinct from the problem that brought down SVB. The two are only loosely related at best. More broadly, the most important banks in the system held up well amid the SVB-induced market volatility, and they seem to be in good shape.7 Based on history, though, regulatory measures aimed at fixing this issue are likely to create new headaches somewhere down the line.
Quite simply, credit contraction is bad for economic growth. A 1% decline in private credit in the U.S. correlates with a 1.3% decline in GDP growth going back to 1971.8 Less capital availability adversely impacts the economy and reduces liquidity, which may be behind the Fed decision to maintain the terminal rate.9
While credit contraction is associated with slowing in the real economy, the impact on equity markets is not as straightforward. When credit contracts, U.S. equities actually perform quite well. In 31 quarters where credit contracted since 1971, the S&P 500 averaged a 5.8% return compared to the average quarterly return over that time of 2.1%.10 The growth-oriented Nasdaq Composite faired even better, averaging a 7.9% return compared to a quarterly mean return of 3.0%.11
The deviation between equity performance and credit contraction Is likely tied to the market’s forward-looking nature. Equity values typically discount events before they occur, which may have happened with the selloff in 2022. The relative outperformance of growth in periods of credit contraction should not be surprising, as growth stocks typically have lower leverage than the broader market.
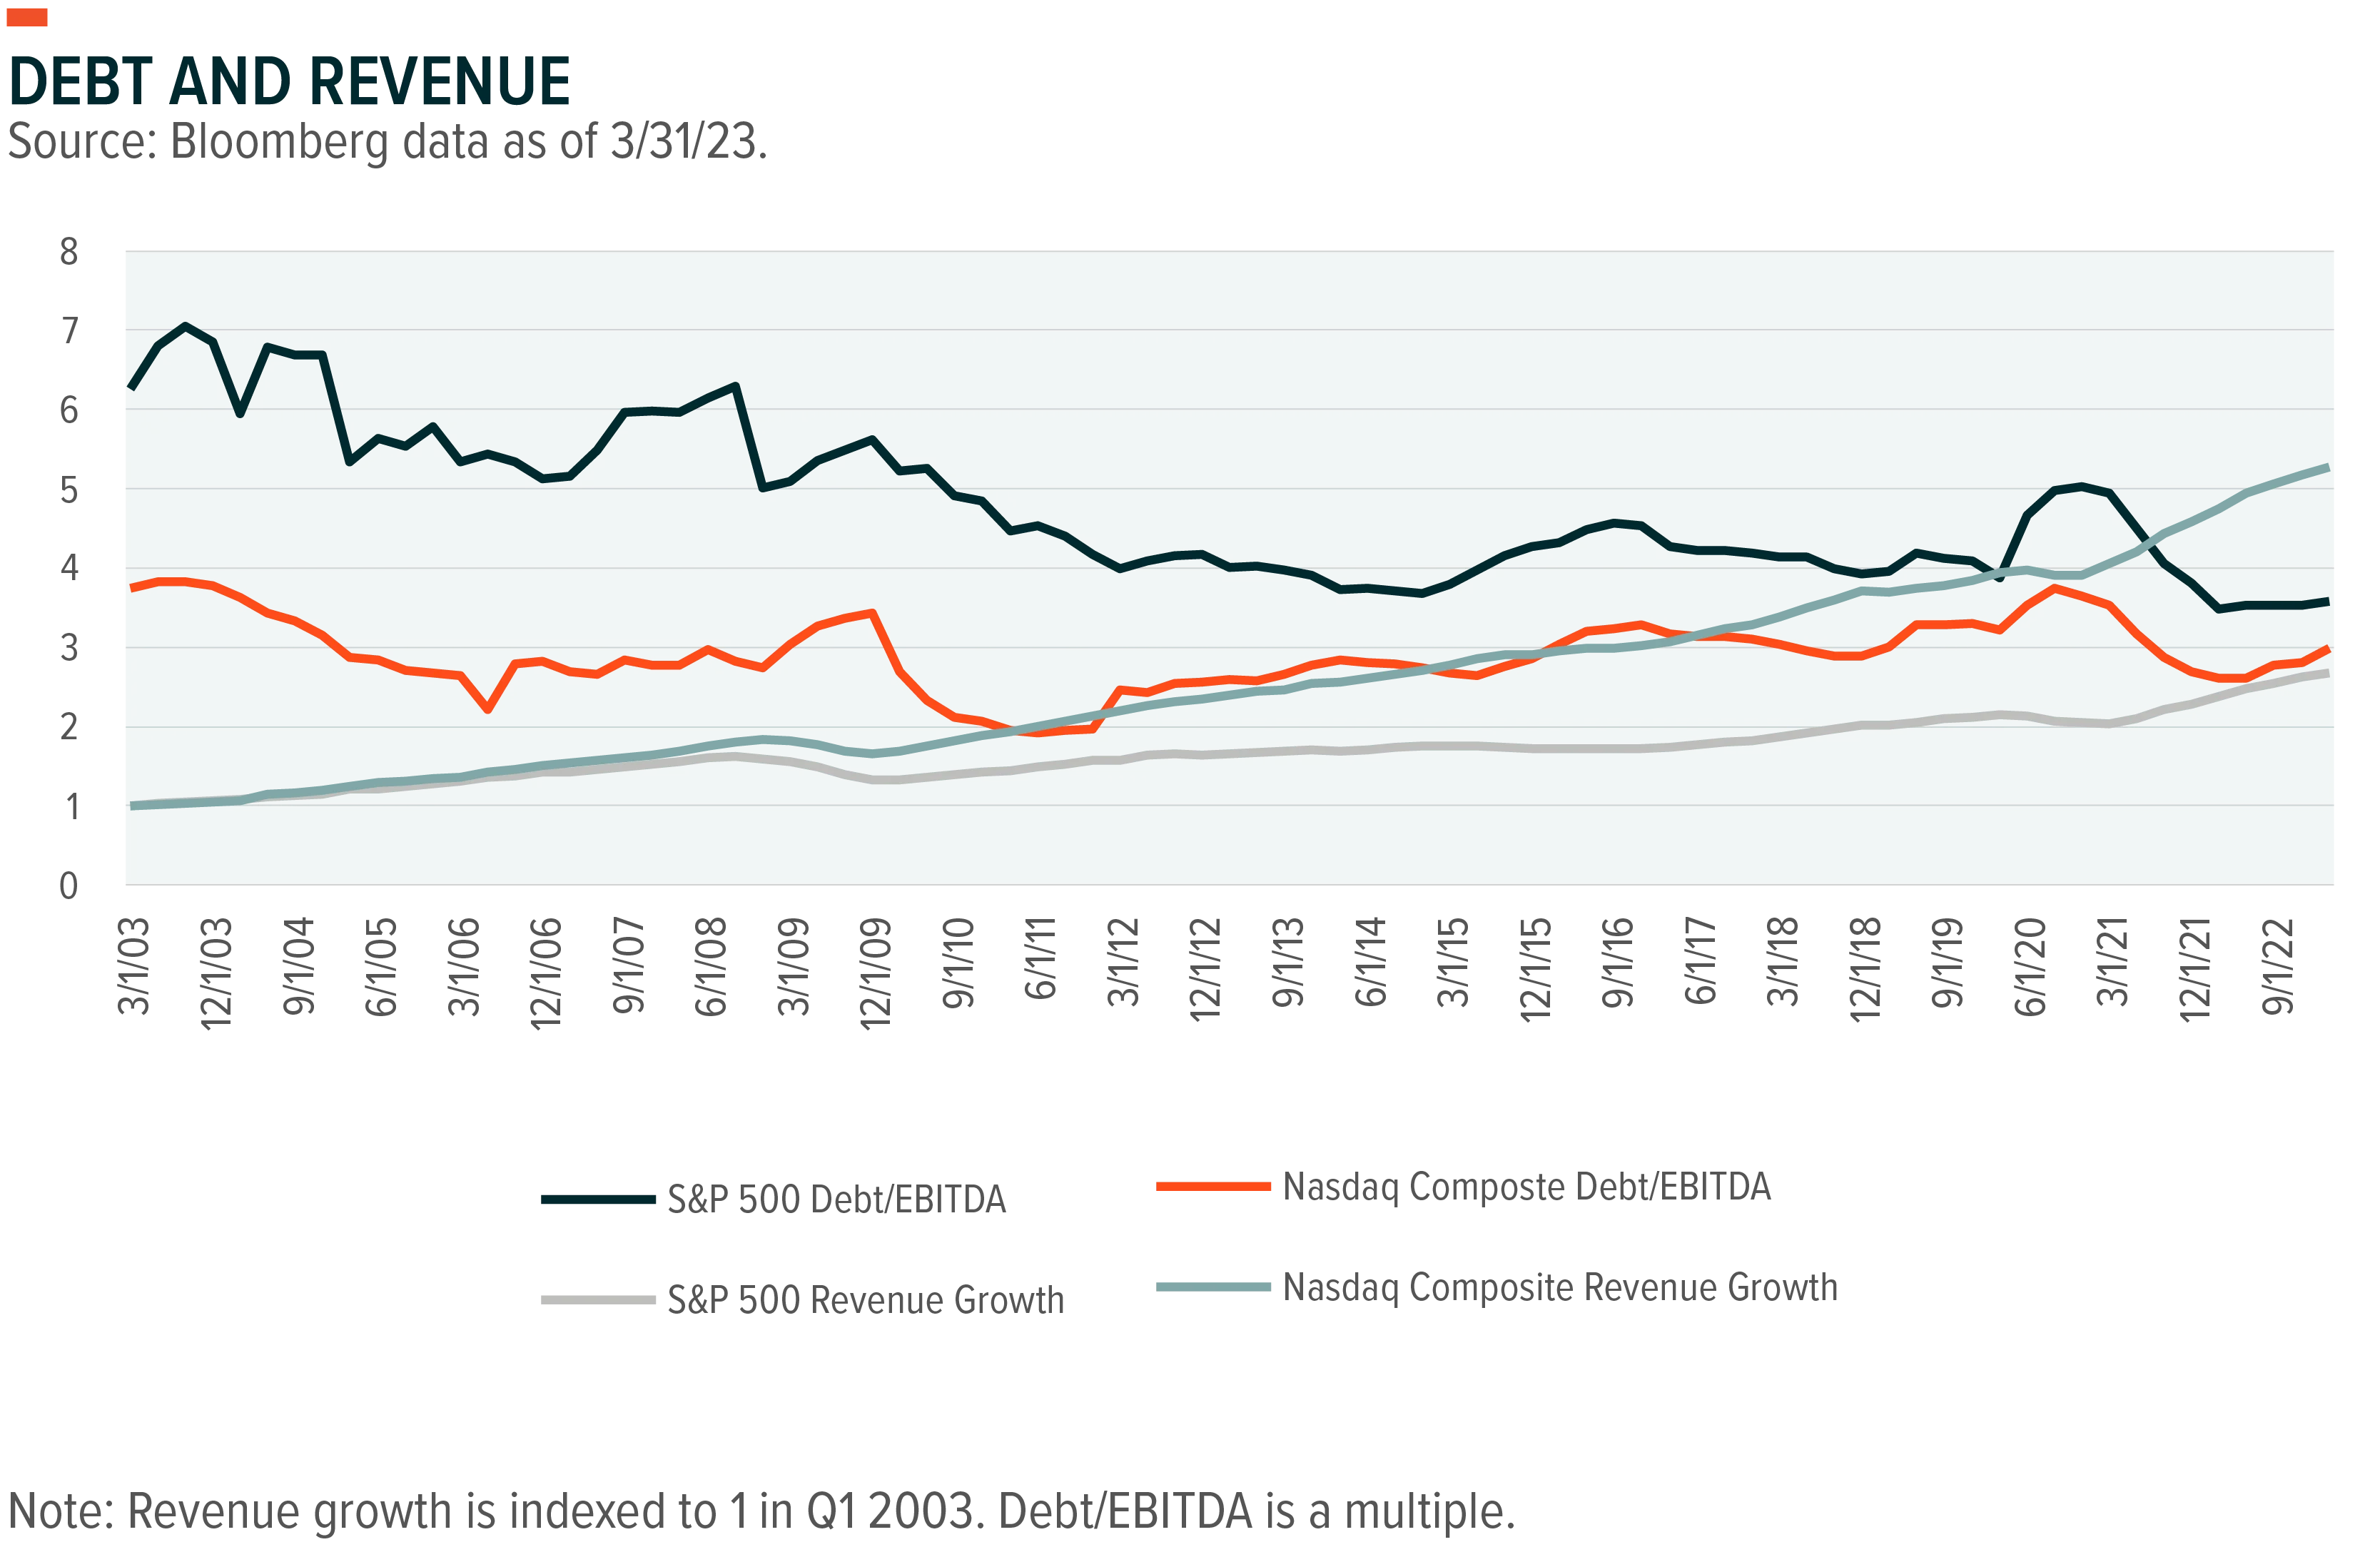
SVB was a bank of choice in Silicon Valley, a hub of tech investment. Along with layoffs and general weakness in big tech, SVB’s failure raised concerns that the credit contraction could adversely impact technology and growth investment.12 The Nasdaq’s outperformance relative to the S&P 500 tells another story. Growth companies are usually not debt fueled (see chart). The Nasdaq generated returns well in excess of the S&P 500 over the last 20 years with less debt. During this period, Nasdaq companies’ total debt-to-EBITDA levels were typically 30-50% below S&P companies’. Growth companies are unlikely to be immune from the credit contraction, but the credit contraction might not be as tech-focused as some market participants think.
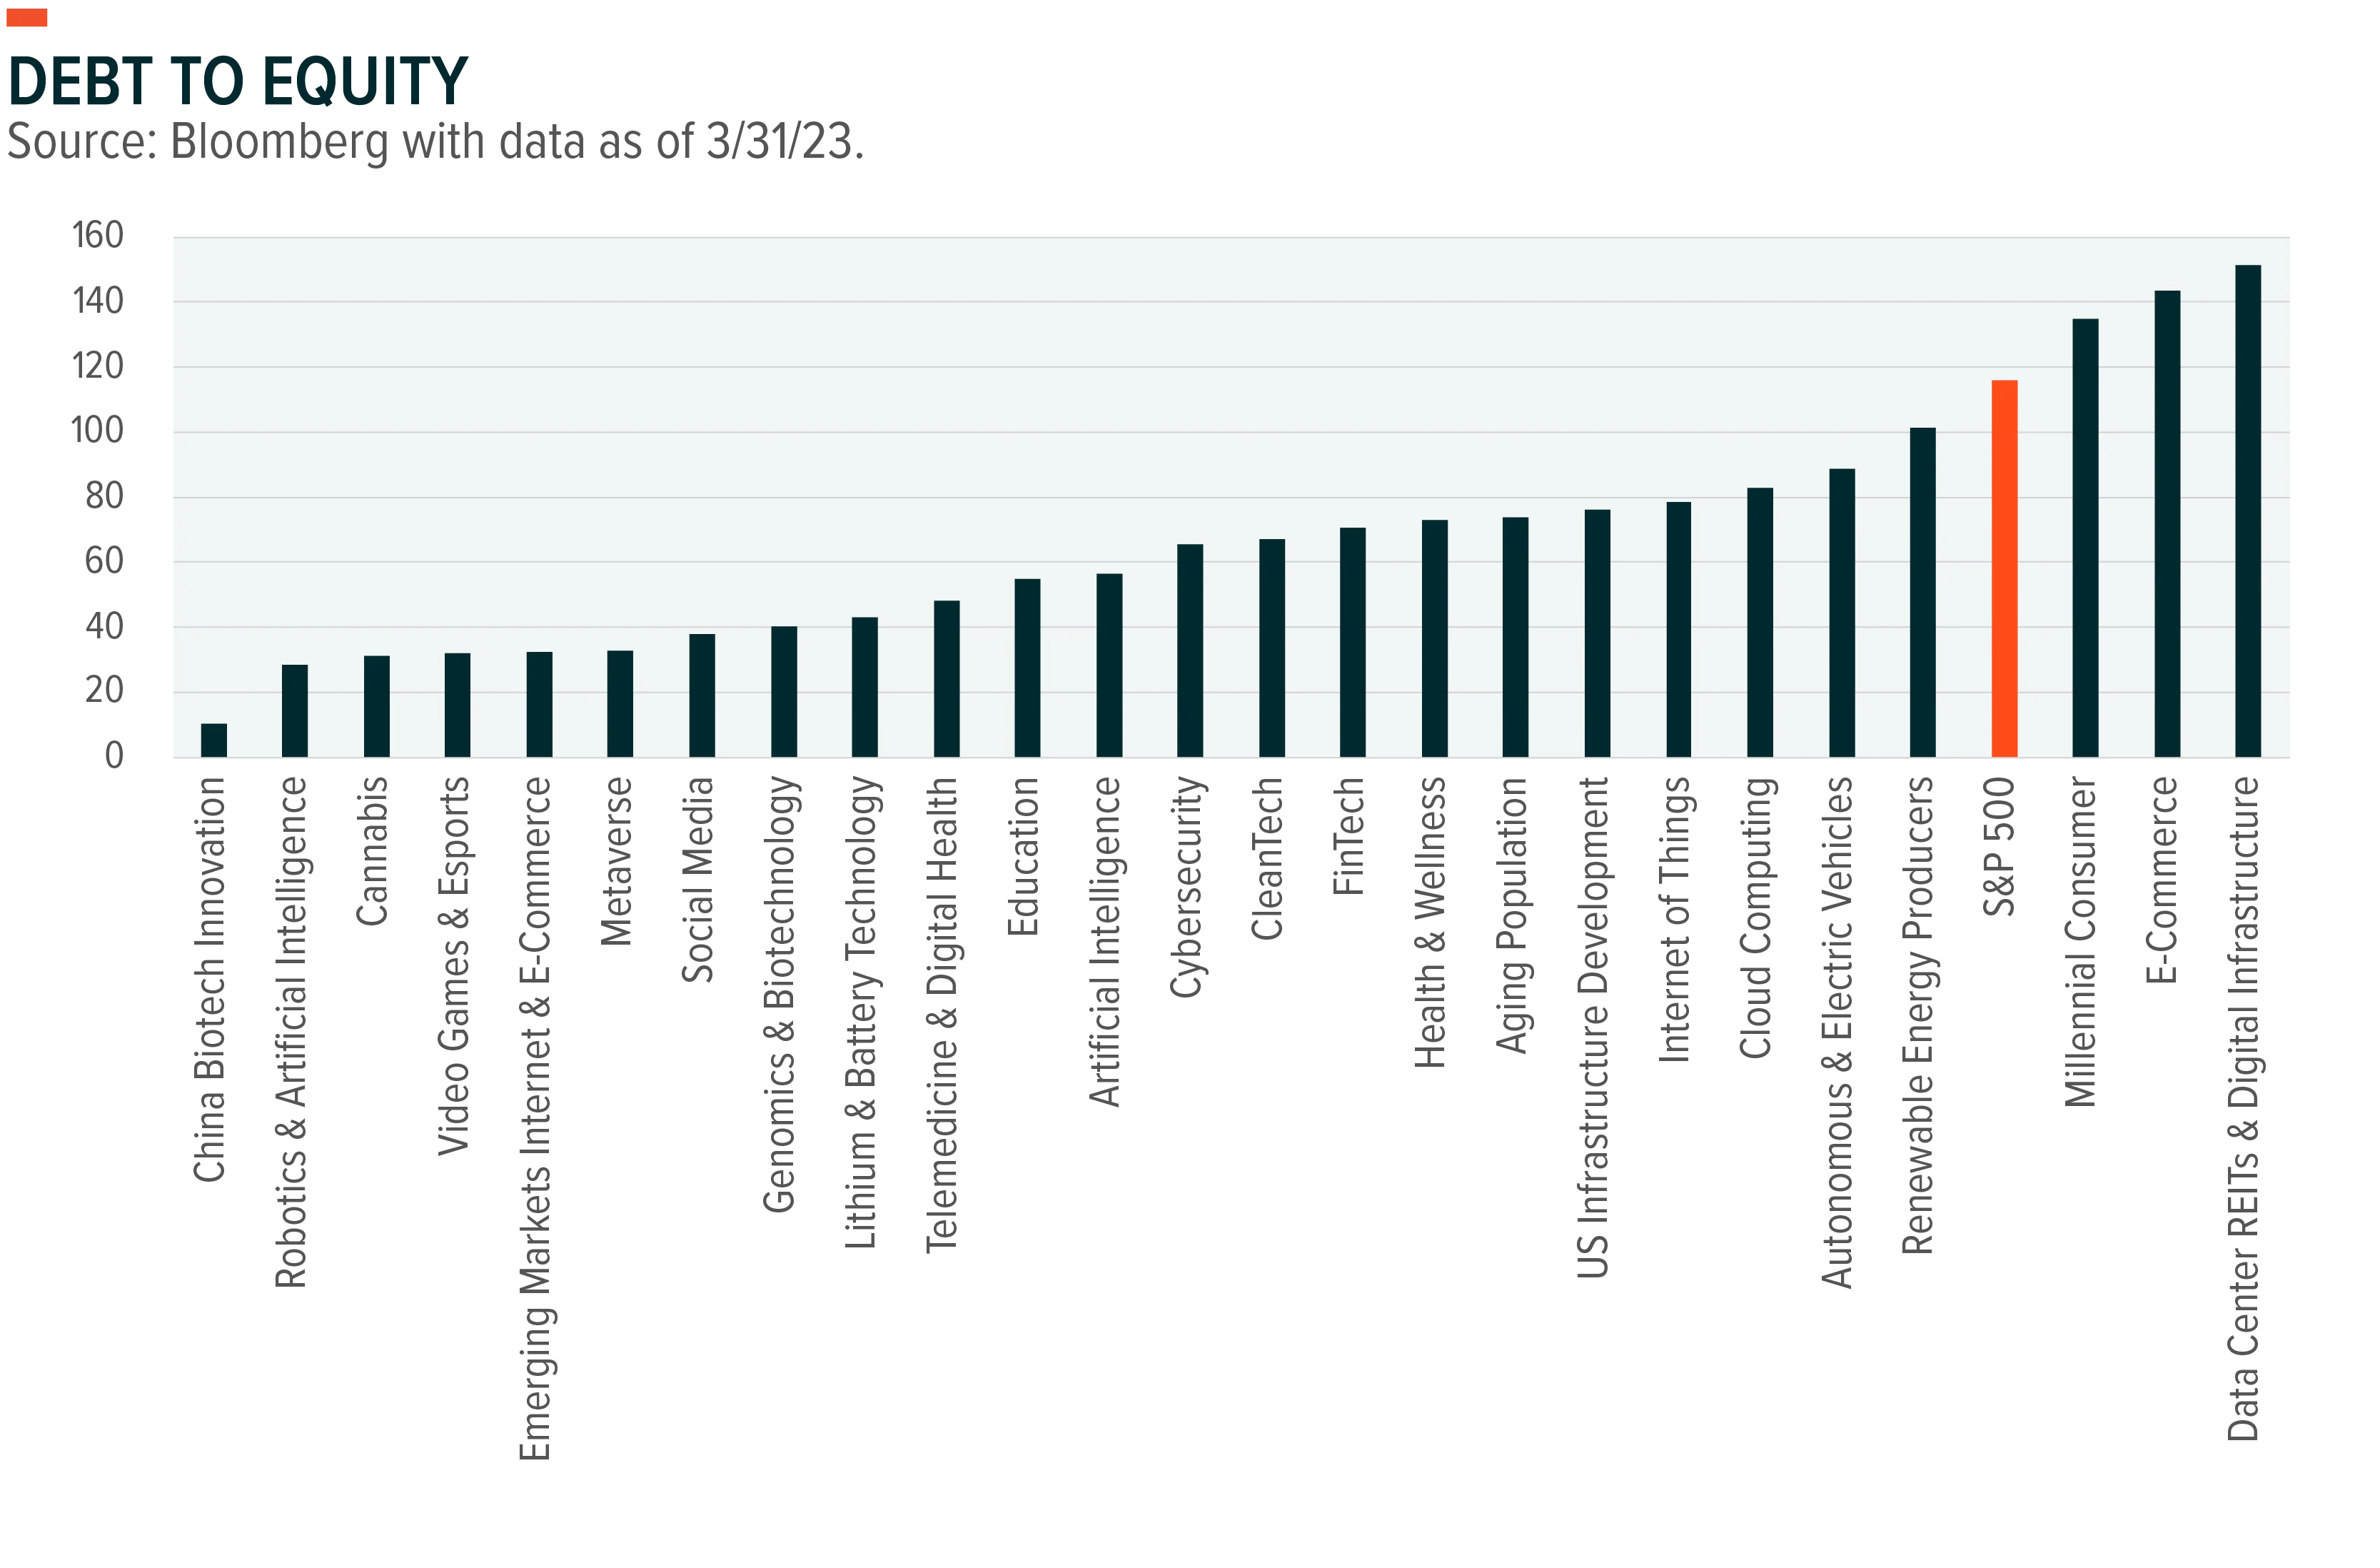
Just as the companies in the Nasdaq index typically have lower debt levels compared to the S&P 500, the same is true across many interesting themes. Robotics & AI theme companies have a debt-to-equity ratio of 28%, compared to the S&P 500 at 116% (see chart). Lithium & Battery Tech-related companies, which have meaningful allocations to the Materials sector, have a debt-to-equity ratio of only 48%. Companies focused on U.S. Infrastructure also have less debt and better net debt to EBITDA than the broader set of S&P 500 companies.
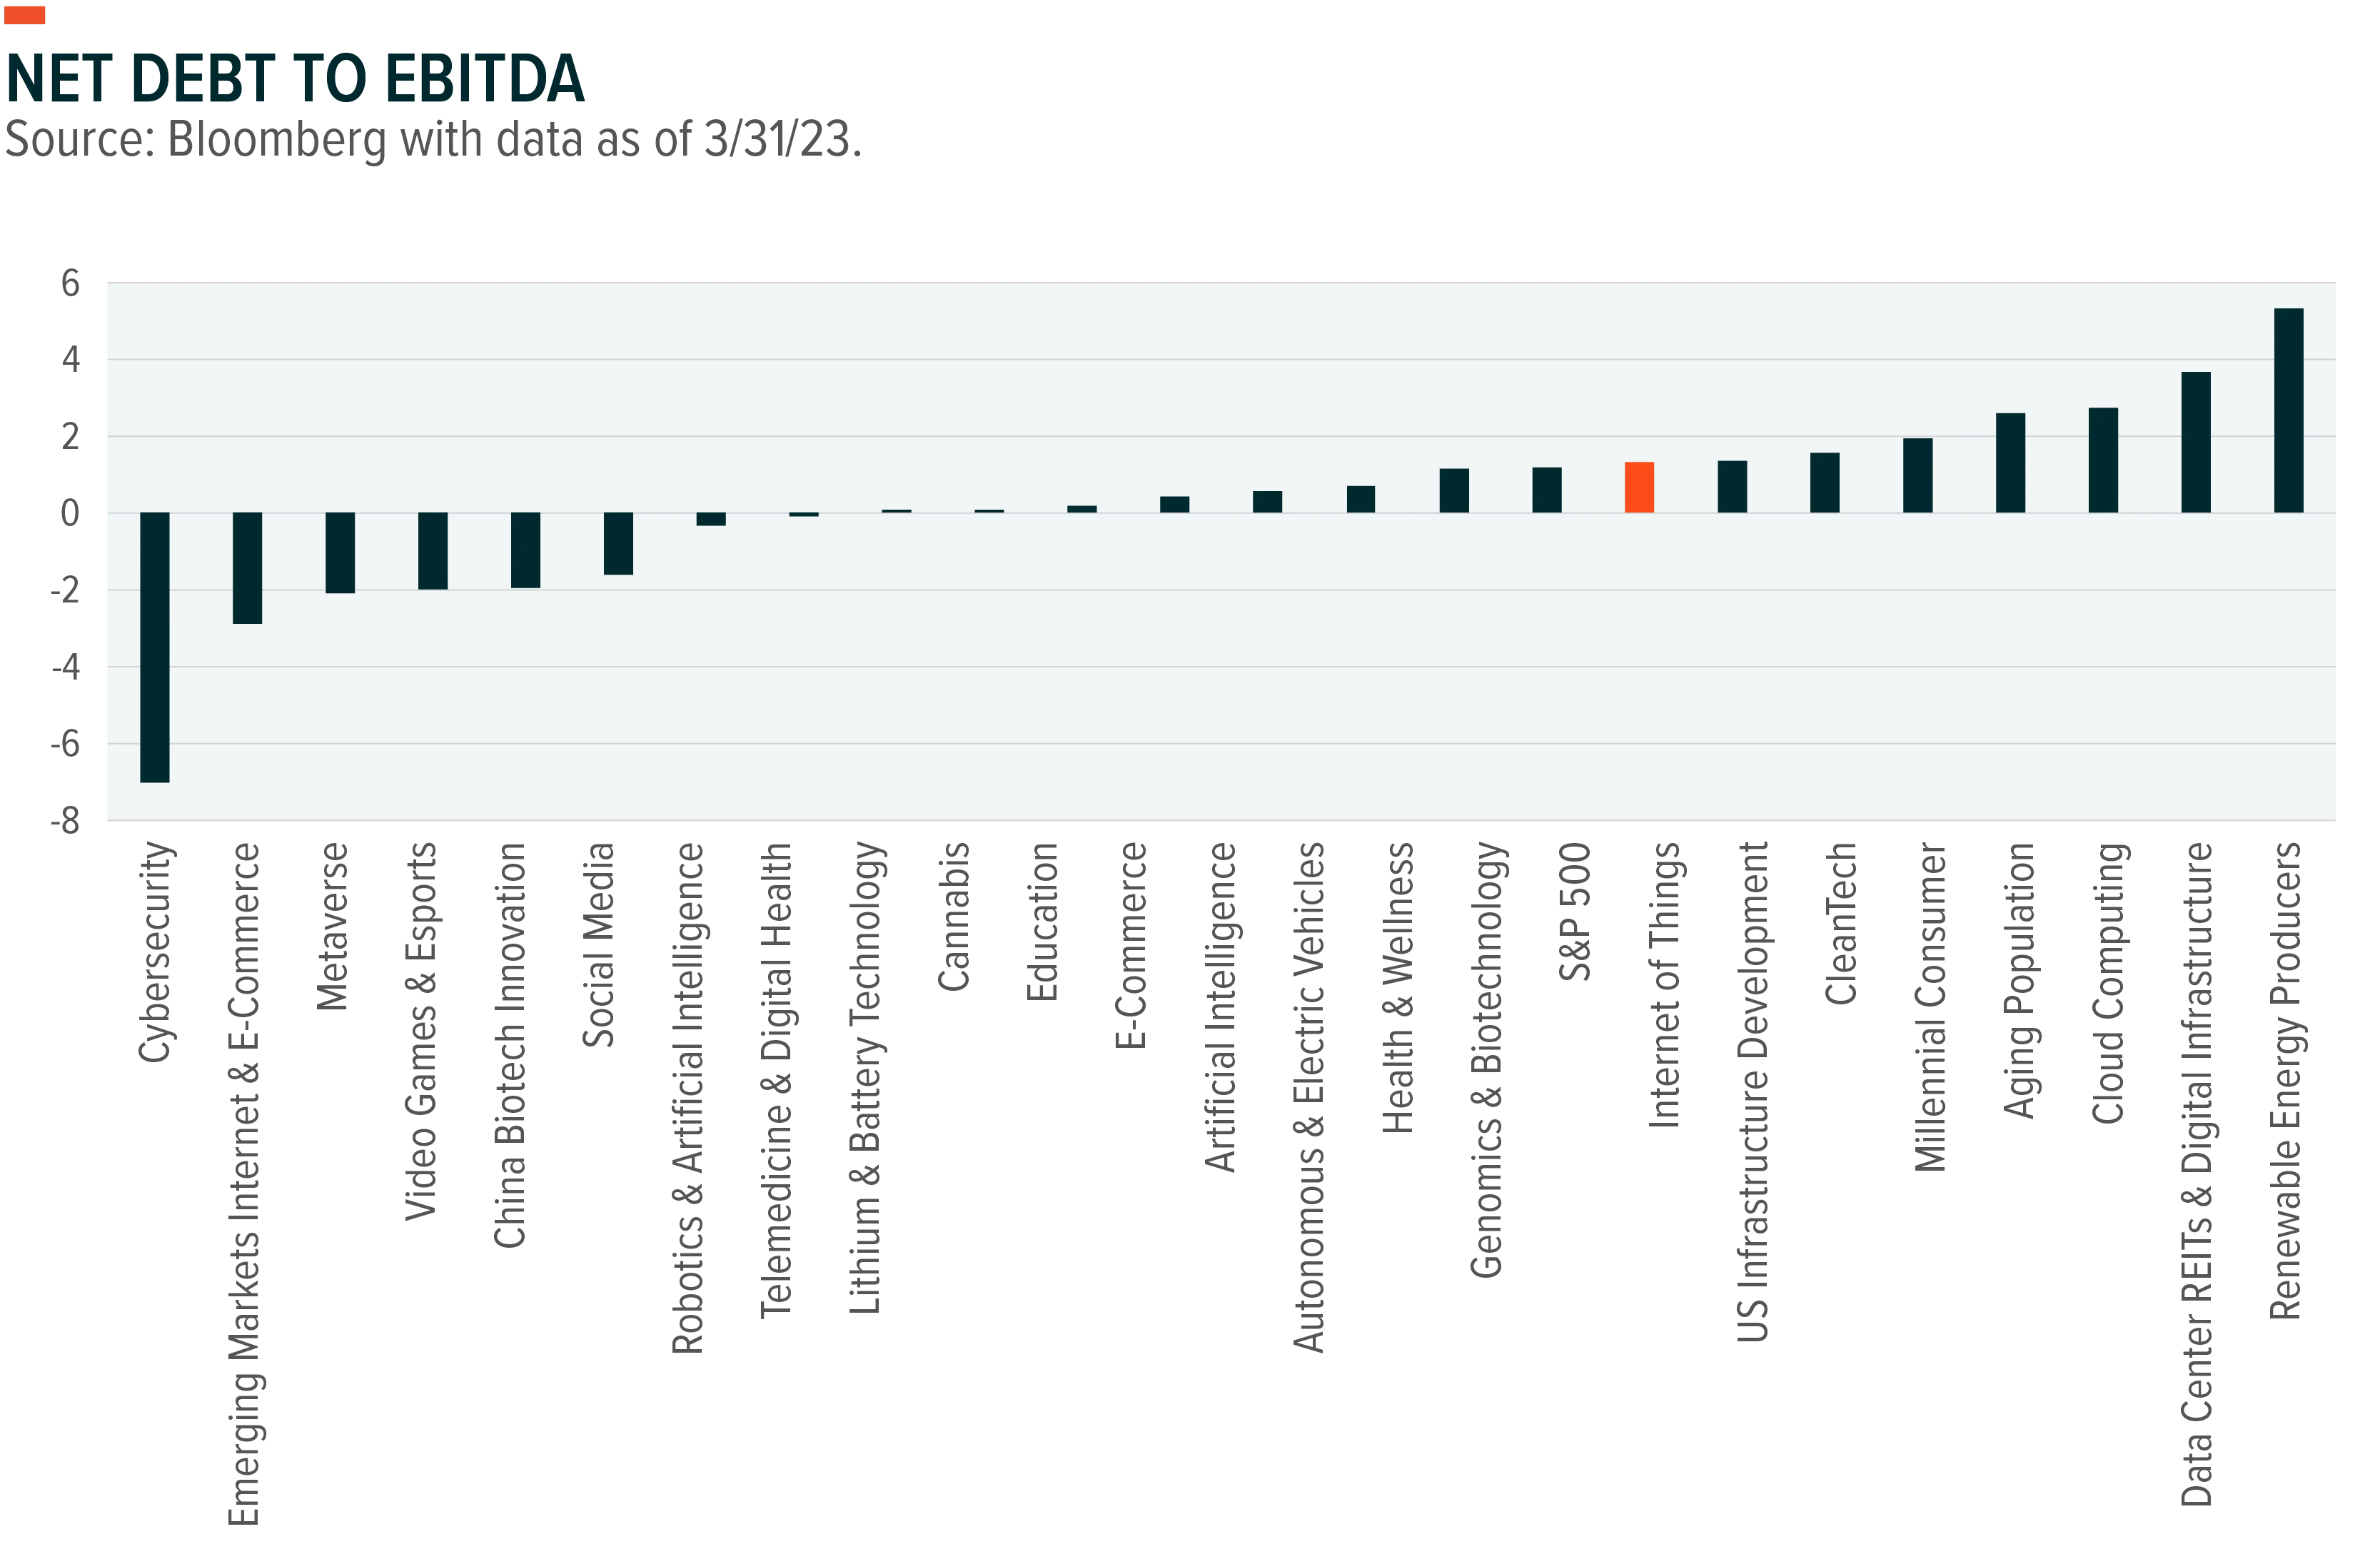
Array of themes exist that investors could look at with relatively low levels of debt on the balance sheet as well as relatively strong EBITDA coverage (see chart). Companies with high levels of EBITDA to debt are likely profitable and less likely to access financial markets under duress at higher rates. Finding themes with lower leverage levels might make sense if fears of credit contraction intensify.
Helfstein, S. (1 December 2023). Inflection Points: Top 5 Risks Keeping Us Awake. Global X ETFs. https://www.globalxetfs.com/inflection-points-december-2022/. Helfstein, S. (17 January 2023). Inflection Points: Regime Change, Recession, Reality Check. Global X ETFs. https://www.globalxetfs.com/inflection-points-january-2023-regime-change-recession-reality-check/.
Institutue for Supply Managementt. (3 April 2023). March 2023 Manufacturing ISM Report On Business. https://www.ismworld.org/supply-management-news-and-reports/reports/ism-report-on-business/pmi/march/.
Allyn, B. and Gura, D. (13 March 2023). The U.S. takes emergency measures to protect all deposits at Silicon Valley Bank. NPR. https://www.npr.org/2023/03/12/1162975615/the-u-s-takes-emergency-measures-to-protect-all-deposits-at-silicon-valley-bank.
Haubrich, J.G. (May 2020). A Brief History of Bank Capital Requirements in the United States.” Federal Reserve Bank of Cleveland, Economic Commentary 2020-05. https://doi.org/10.26509/frbc-ec-202005.
SVB Financial Group, Annual Report, February 29, 2008.
Le Dain, M. (19 March 2023). The Larger Hidden Risk To The Market After SVB. Forbes. https://www.forbes.com/sites/markledain/2023/03/19/the-larger-hidden-risk-to-the-market-after-svb/?sh=6c3d12757302.
Betz, B. (23 March 2023). Citigroup CEO says banking system ‘pretty sound’ after failures of Silicon Valley Bank, Signature Bank. Yahoo Finance. https://finance.yahoo.com/news/citigroup-ceo-says-banking-system-220001806.html.
Global X analysis with information derived from: Bloomberg L.P. (n.d.) [Data set]. Retrieved on March 31, 2023.
Cox, J. (22 March 2023). Fed hikes rates by a quarter percentage point, indicates increases are near an end. CNBC. https://www.cnbc.com/2023/03/22/fed-rate-hike-decision-march-2023.html.
Global X analysis with information derived from: Bloomberg L.P. (n.d.) [Data set]. Retrieved on March 31, 2023.
Ibid.
Goswami, R. and Levy, A. (9 March 2023). Silicon Valley Bank’s struggles spell further trouble for beleaguered tech startup market. CNBC. https://www.cnbc.com/2023/03/09/silicon-valley-banks-struggles-signal-more-trouble-for-tech-startups.html.
The Global X 2026 Outlook is presented in two parts: Macroeconomic by Scott Helfstein and International by Malcolm Dorson.
The Global X 2026 Outlook is presented in two parts: Macroeconomic by Scott Helfstein and International by Malcolm Dorson.
Kevin Warsh’s nomination as the next Fed Chair rattled markets, but we believe simply labeling him an inflation hawk is too simplistic.
Kevin Warsh’s nomination as the next Fed Chair rattled markets, but we believe simply labeling him an inflation hawk is too simplistic.