
Product ResearchCoreEquity
Introducing NYSX: A Modern Tool for Evolving Markets
M
Multiple authors
Mar 26, 20266 min read
Get the latest news and updates from our team.
Copyright © 2026 Global X. All rights reserved.
SEI Investments Distribution Co. (1 Freedom Valley Drive, Oaks, PA, 19456) is the distributor for the Global X Funds.
Check the background of SIDCO and Global X's Registered Representatives on FINRA's BrokerCheck.
Global X Research
Multiple authors
U.S. dollar-denominated Emerging Market (EM) debt has matured into a vital component of many core asset allocations. EM bonds offer more than just incremental return potential—they may also enhance portfolio resilience by providing a compelling blend of potentially higher yields, portfolio diversification, and exposure to fast-growing economies. As credit fundamentals continue to improve across many Emerging Markets, the case for a dedicated allocation to EM debt grows stronger. That said, the asset class boasts both risks and opportunities. Prudent active management may outshine passive approaches by selectively targeting the most compelling opportunities. As the Global X Emerging Markets Bond ETF (EMBD) recently hit its 5-year track record (June 1, 2025), we mark this milestone with a dive into why we believe Emerging Markets debt (EMD) deserves consideration in most core asset allocations.
Higher Yield Potential: EM debt typically commands a yield premium over Developed Market debt due to perceived higher risks. Historically, U.S. dollar-denominated EM bonds have provided a higher yield for global investors, especially during stable or easing U.S. monetary policy regimes. As we transition out of the fastest rate-hiking cycle in four decades, EM debt stands to benefit as risk premiums decline and liquidity improves.
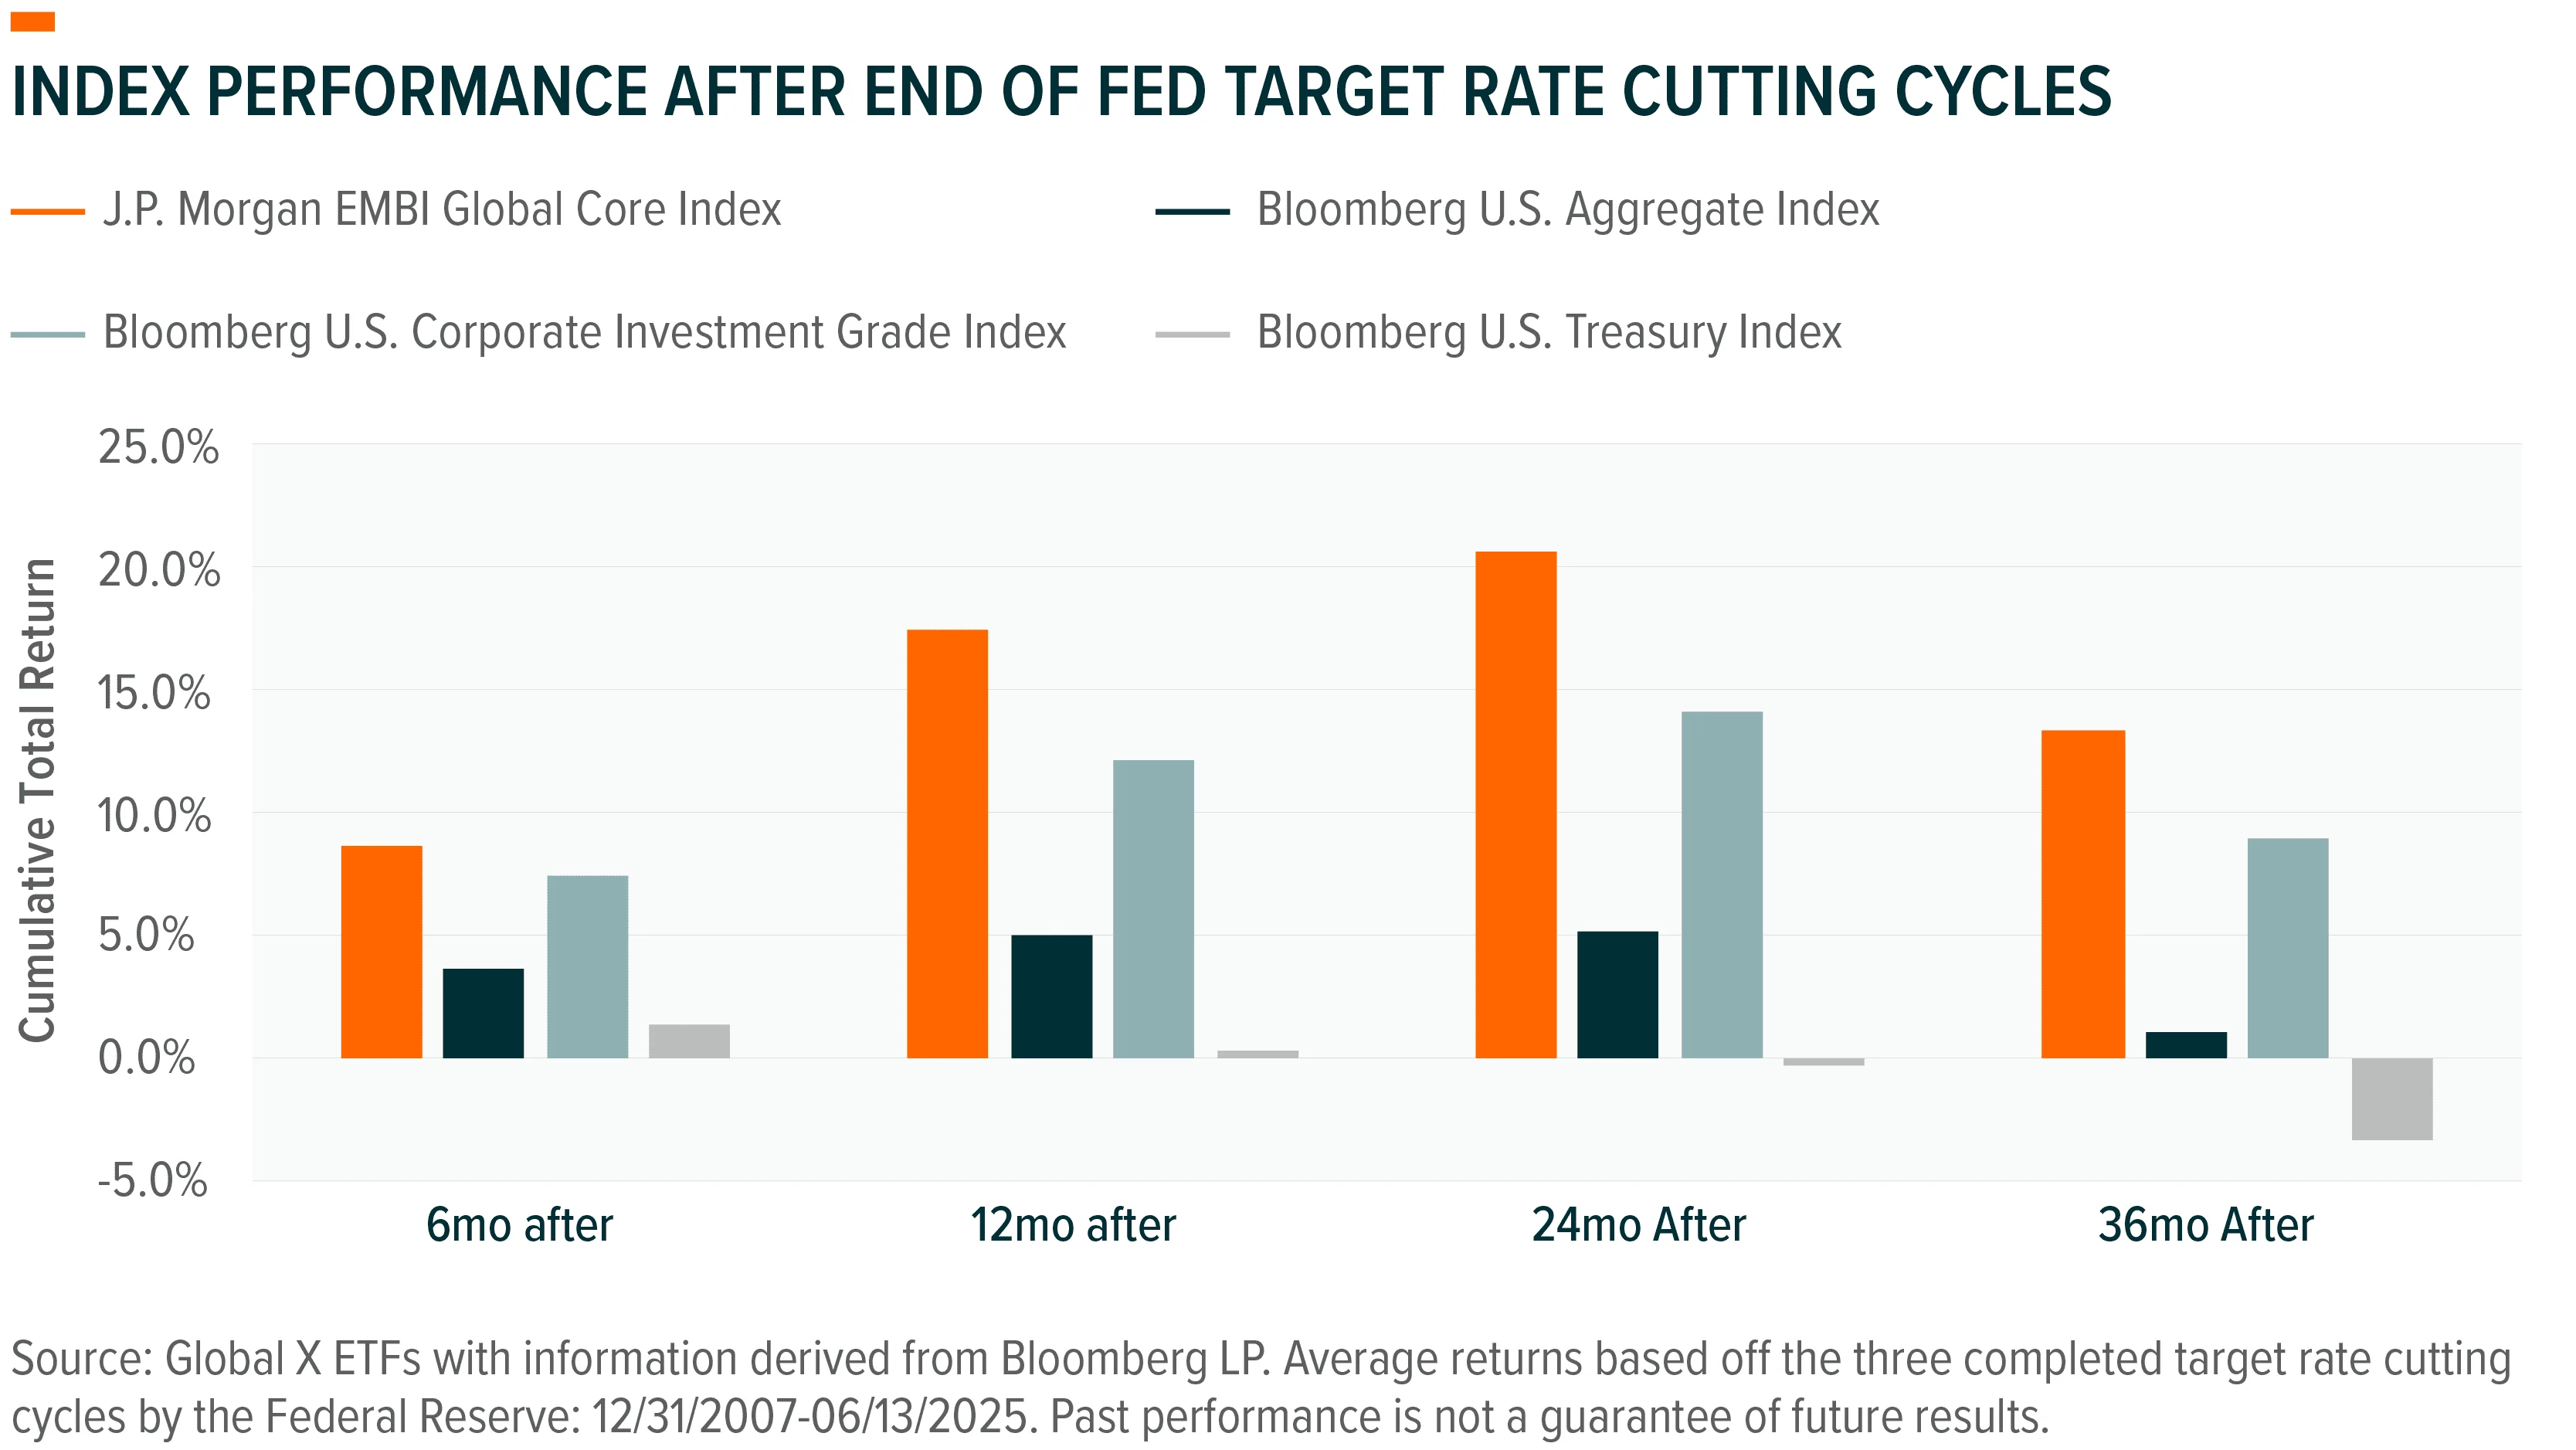
Performance Around Fed Tightening Cycles: Historical data show strong performance for EM debt in the one, two, and three years following the end of U.S. Federal Reserve (Fed) target interest rate cutting cycles, with average cumulative returns of 17.4%, 20.7%, and 13.3% respectively These dynamics create a favorable environment for strategic and tactical allocations to EM debt.
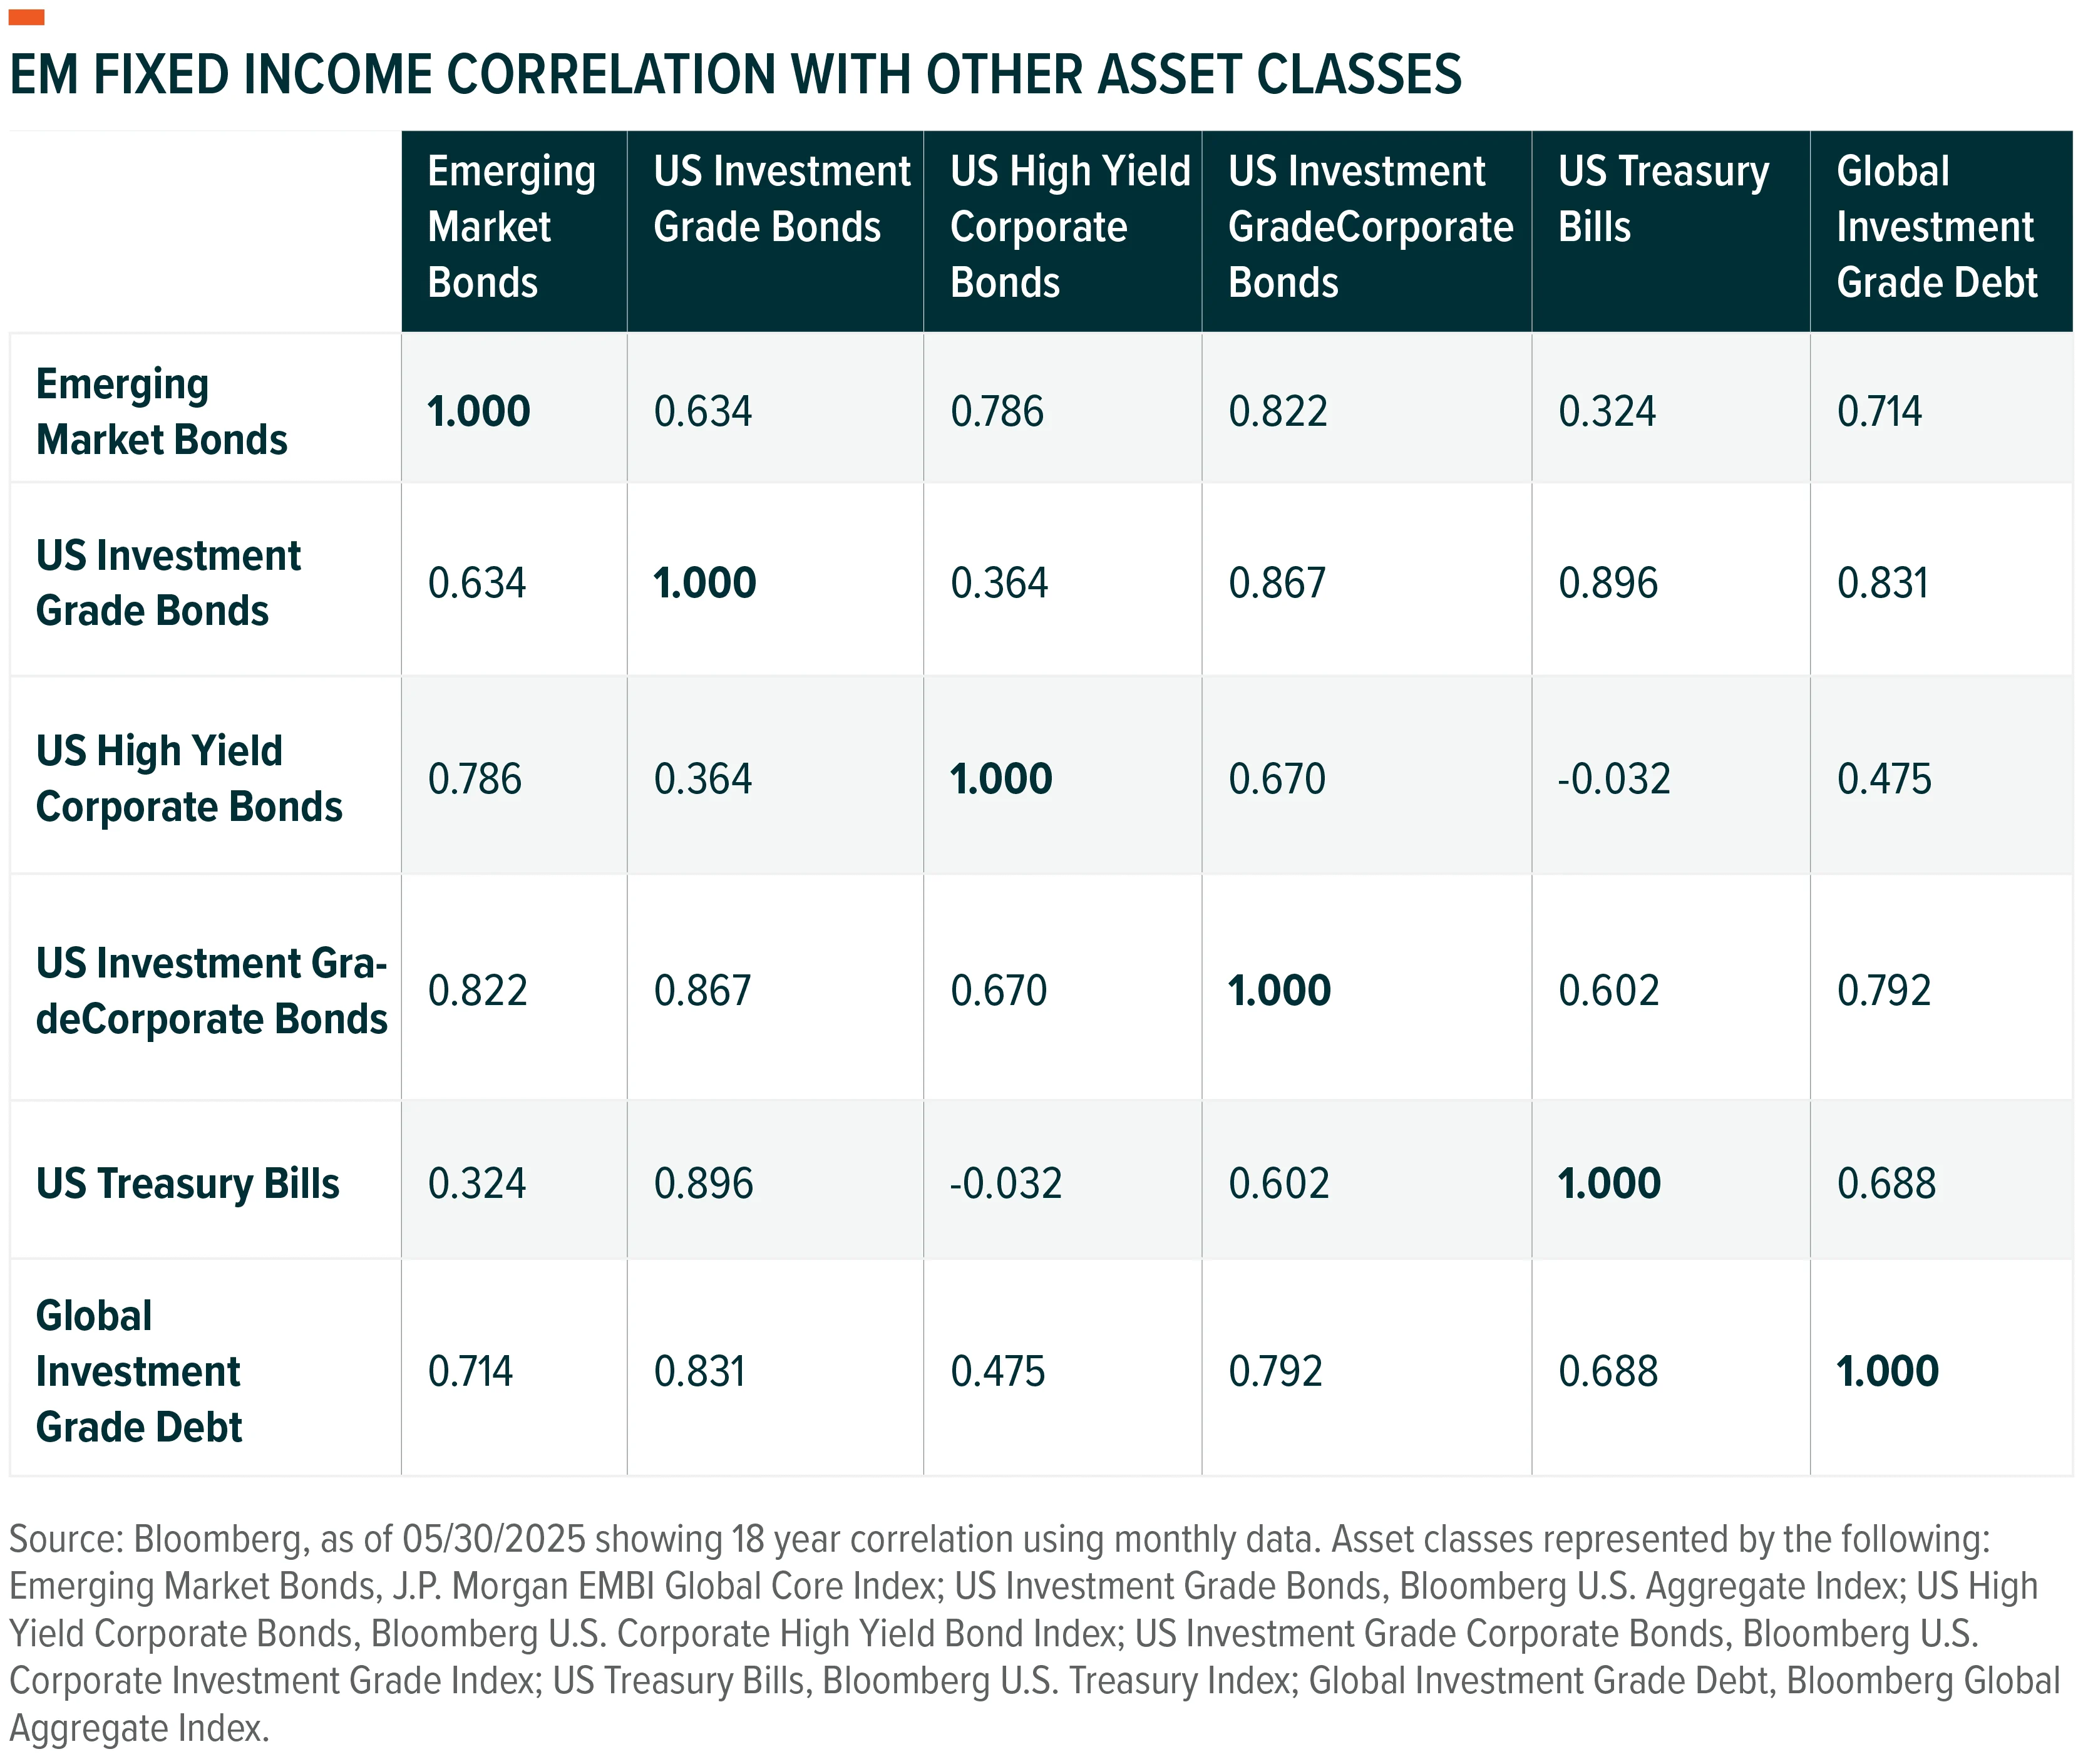
Diversification: Adding EM debt to a core portfolio may enhance diversification across regions, credit qualities, and yield curves. EM debt has historically exhibited a moderate correlation with other fixed income sectors, especially Developed Market government bonds. Over the past 18 years, using monthly data, EMD’s correlations to the Bloomberg U.S. and Global Aggregate Indices is 0.63 and 0.71, respectively. This diversification becomes particularly valuable during periods of volatility in Developed Markets.
While diversification does not ensure a profit or guarantee against a loss, we believe diversifying exposure by combining sovereign debt with high-quality corporate bonds while maintaining disciplined duration and credit risk management can further enhance income generation and return efficiency.
Exposure to Economic Growth in Emerging Markets: Emerging economies generally experience higher GDP growth than their developed counterparts, driven by a lower relative base, favorable demographics, industrialization, and rising consumption. Investing in EM debt may offer indirect participation in these potential growth trends. Real (inflation-adjusted) GDP for emerging economies is expected to grow 3.7% and 3.9% year-over-year in 2025 and 2026, while developed economies are expected to grow 1.4% and 1.5% respectively over the same periods1. As fiscal and monetary policy frameworks in these regions mature, we believe the case for long-term investment strengthens.
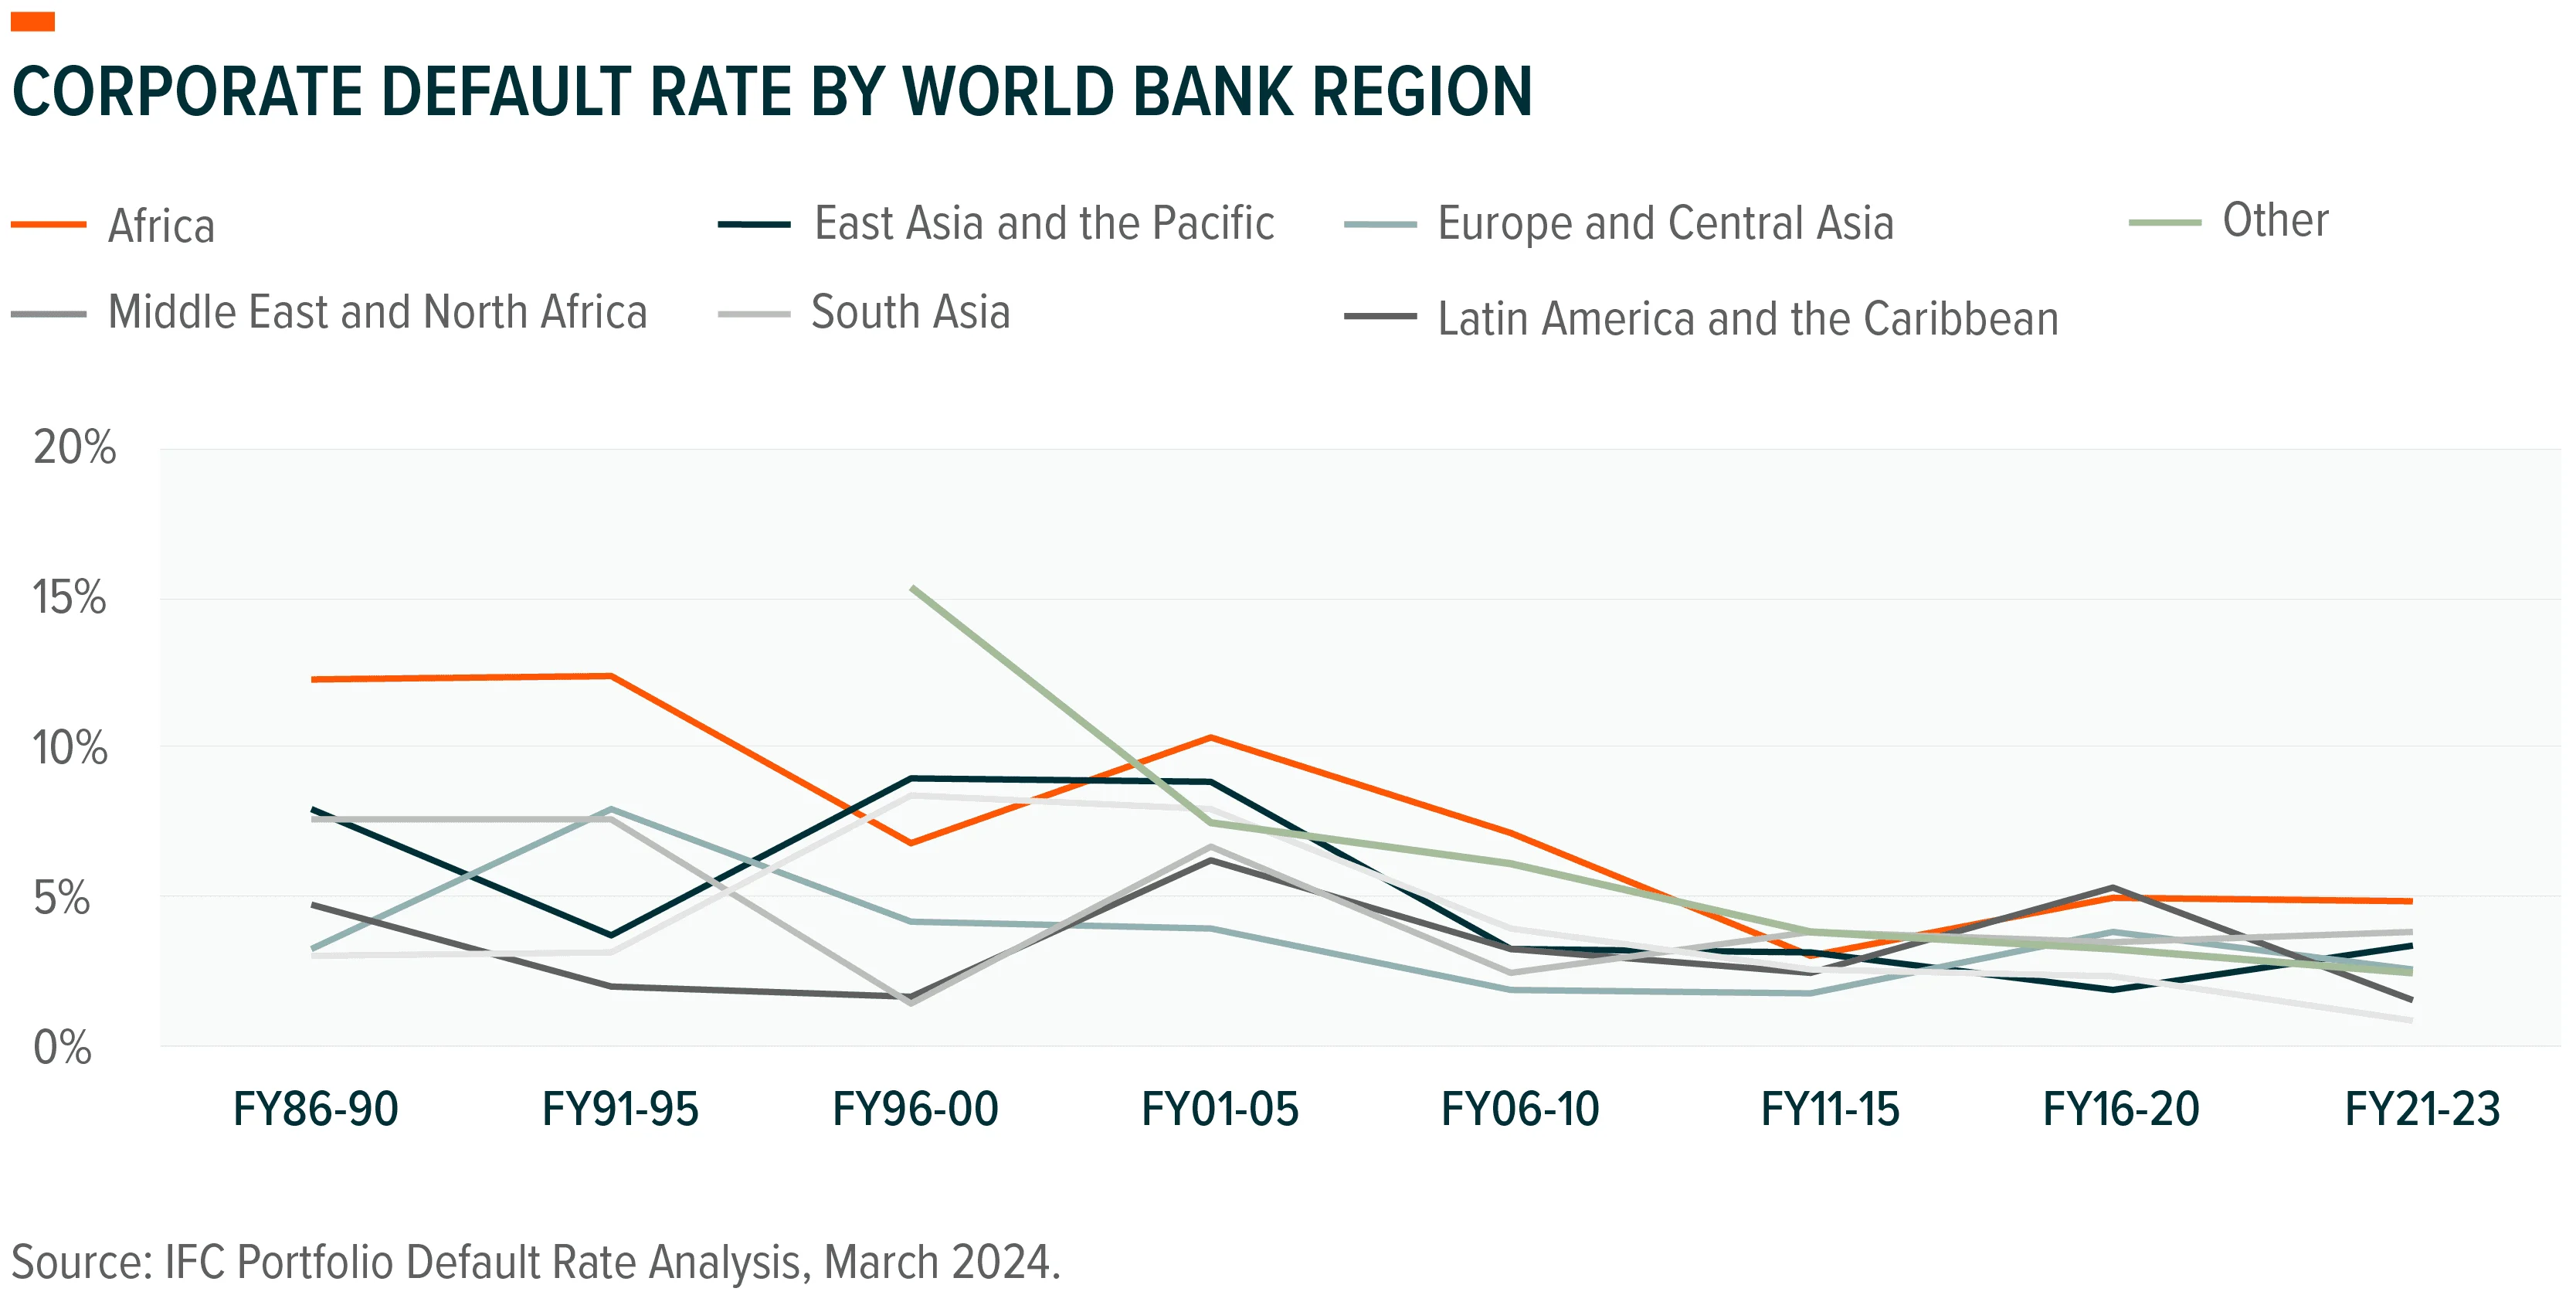
Improving Credit Fundamentals: Enhanced fiscal discipline, declining debt-to-GDP ratios, and healthier current accounts have improved EM fundamentals over the last decade. In 2024, EM corporate bonds recorded a net $70 billion in rating upgrades—their best rebound since 20122. The International Finance Corporation (IFC) private sector default statistics from 1986-2023 for Emerging Markets showed an average default rate of 4.1%, while EM Sovereign debt averaged just 0.7% annually, with the World Bank able to recover over 90% of the amount owed when acting as the creditor3. Emerging Market private sector default rates also were lower than comparable S&P B rated and Moody’s B3 rated global corporates during global crises like the Asian Financial Crisis, South American Economic & Dot-com bubble, Global Financial Crisis, Commodity Price Crisis, and Covid-194. Managers that identify issuers with strong fundamentals while seeking to avoid speculative names with poor refinancing prospects as part of their portfolio construction process may be able to mitigate some downside risk and provide regular income generation.
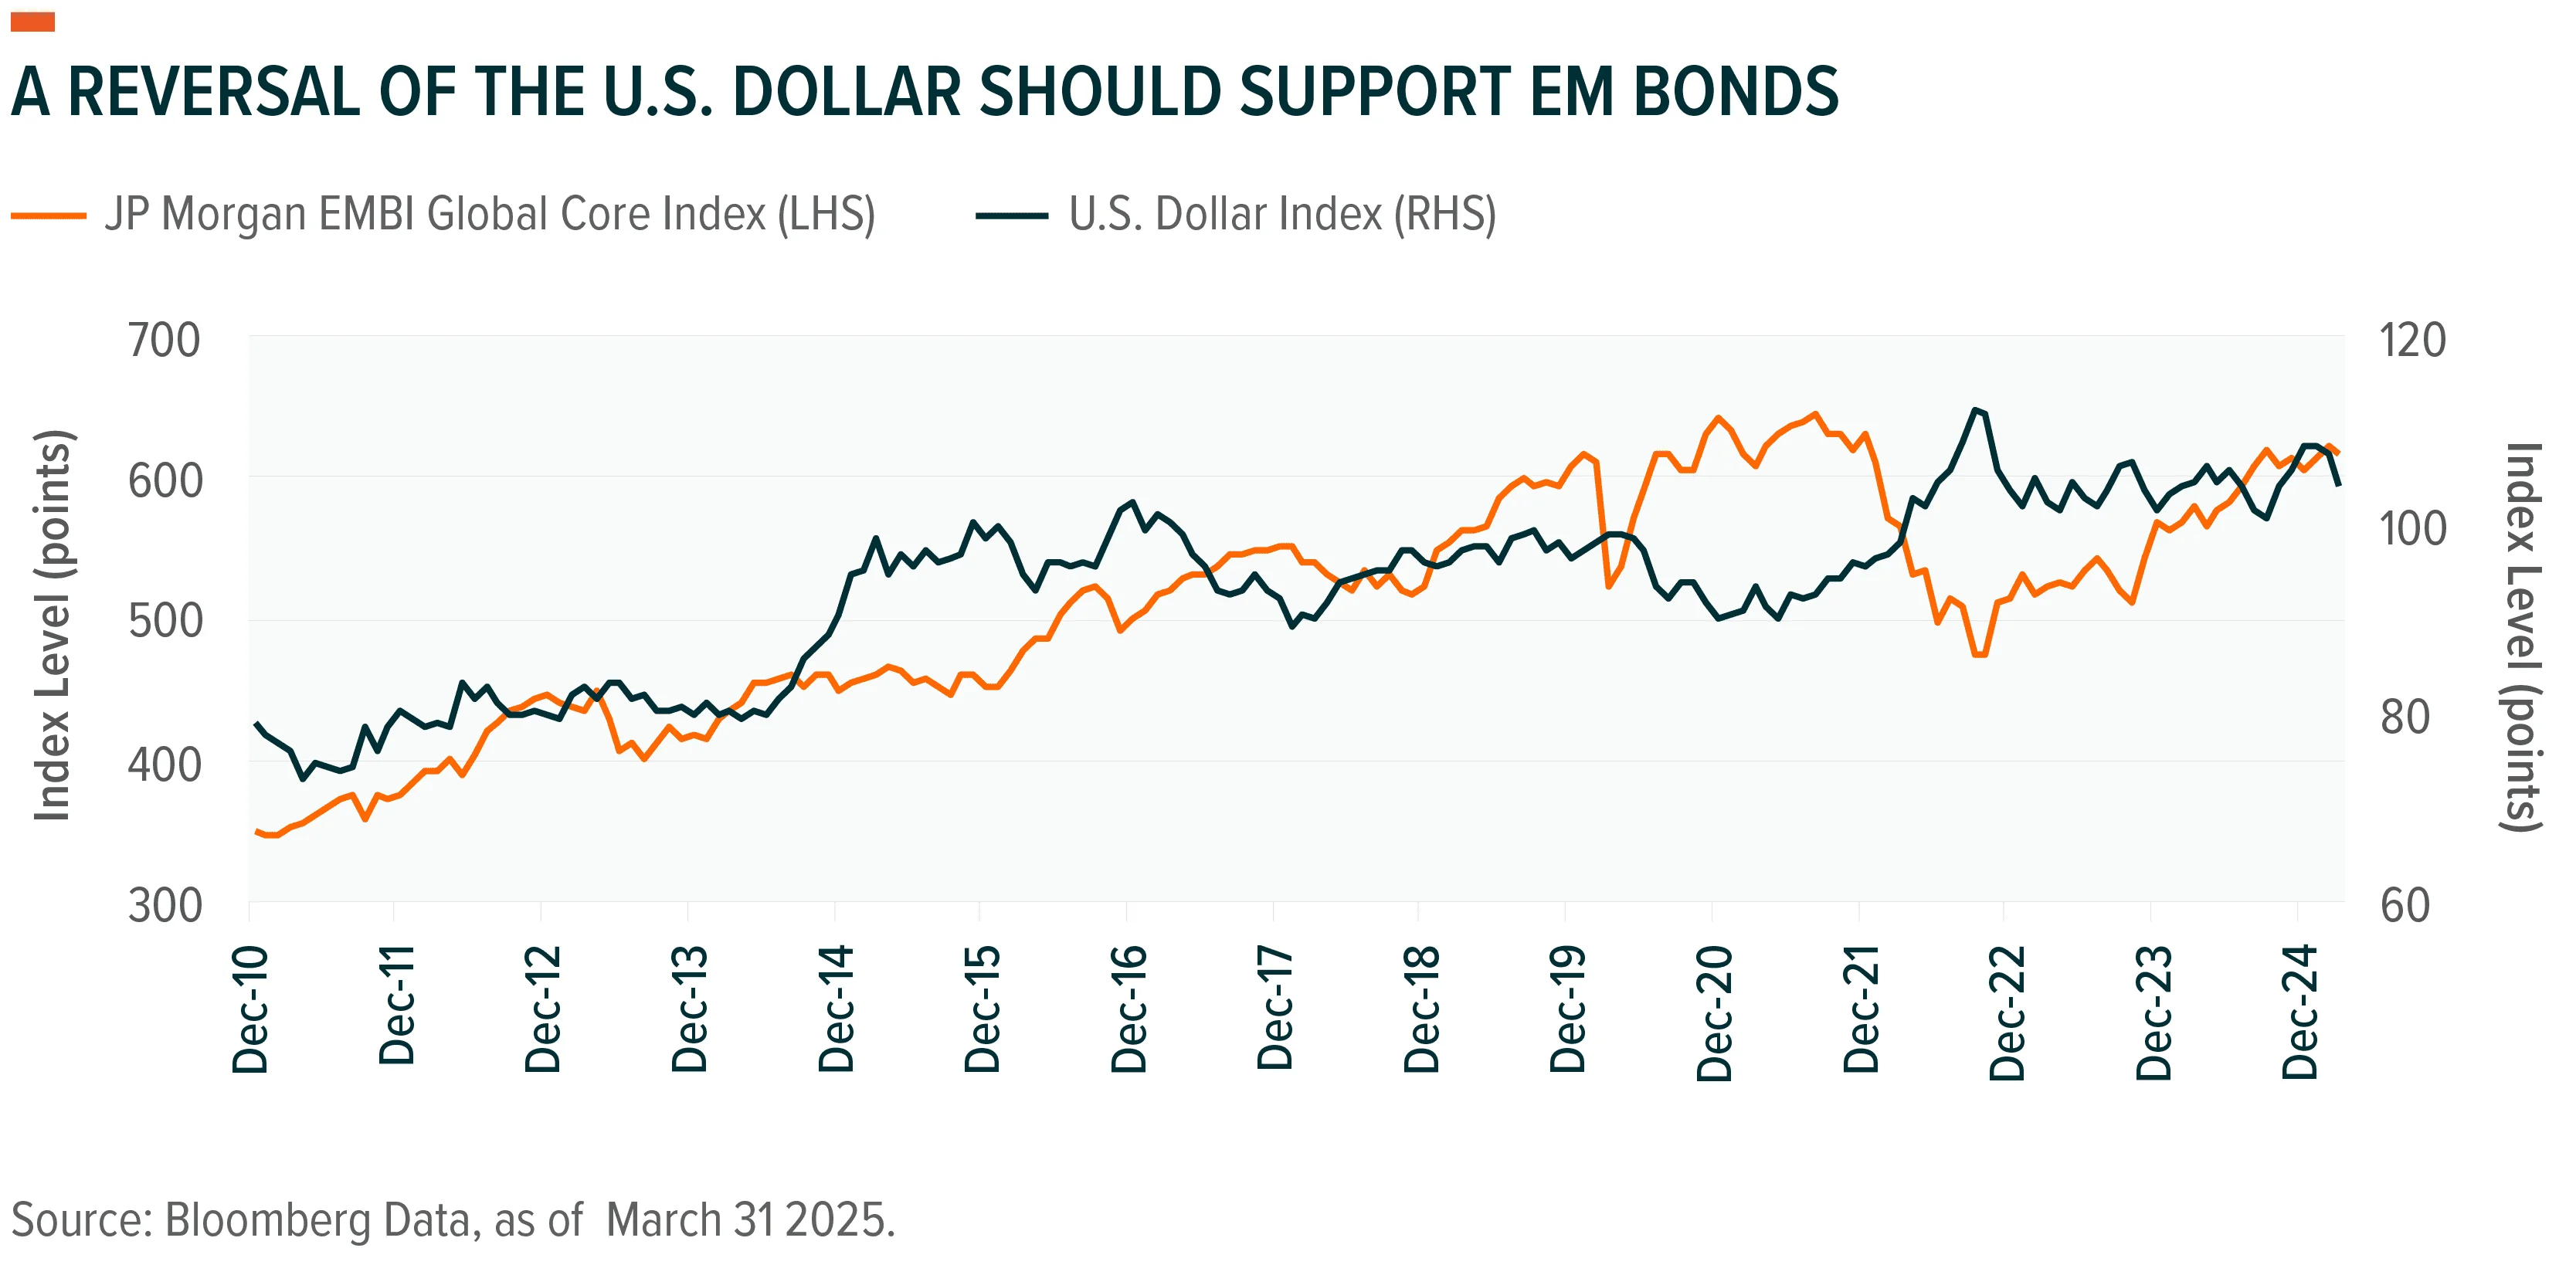
A Weaker U.S. Dollar: Looking ahead, a weaker U.S. dollar could lower external debt burdens for EM issuers and boost commodity-linked revenues, further supporting credit conditions. Over the past 18 years, the U.S. Dollar Index (DXY) has exhibited a -.55 correlation with the JPMorgan EMBI Global Core Index5, signifying negative correlation.
Underrepresentation and Strategic Opportunity: EM debt is often underrepresented in global bond indices and institutional portfolios. In our conversations with clients, we tend to see zero to 5% exposure to EM fixed income. This is below major global bond benchmarks like the Bloomberg Global Aggregate Index, which includes over 16% exposure to EM bonds. Yet EM economies account for nearly 60% of Global GDP.6 We believe this under-allocation presents a strategic opportunity to capture untapped potential sources of yield and return. Despite accounting for a significant portion of global GDP and population, EM assets constitute a disproportionately small share of investor portfolios.
In addition to increasing exposure to a thoughtfully constructed mix of sovereign and corporate issuers, utilizing an active management approach may be able to further enhance return by seeking to optimize security selection and duration strategy.
For investors seeking yield, diversification, and global growth exposure, U.S. dollar-denominated EM debt may be a highly attractive asset class. Supported by improving fundamentals and a favorable macro-outlook, EM debt – especially when accessed through disciplined, research-driven strategies – may offer a powerful complement to traditional fixed income allocations. Investors would likely be well-served by integrating EM debt into their core portfolios—not merely as a tactical play, but as a strategic, long-term allocation.
The Global X Emerging Markets Bond ETF (EMBD) combines active management, a competitive fee of 0.39%, and the liquidity and transparency of the ETF structure. Backed by Global X Management Company, a subsidiary of Seoul-based Mirae Asset Financial Group which has over $600 billion in AUM as of 12/31/2024, EMBD is managed by a dedicated investment team across New York and Asia, supported by macro and quantitative strategists. The fund employs a disciplined, repeatable investment process that blends top-down macro analysis with bottom-up credit and valuation research. EMBD seeks opportunities in both corporate and sovereign EM debt, seeking to leverage market inefficiencies and focusing on risk-adjusted returns. This approach has delivered strong results, with EMBD outperforming its benchmark by almost two percentage points annualized since inception returning 3.32% vs 1.51% for the benchmark.7
Performance quoted represents past performance. Past performance does not guarantee future results. The investment return and principal value of an investment will fluctuate so that an investor's shares, when sold or redeemed, may be worth more or less than their original cost and current performance may be lower or higher than the performance quoted. Performance current to the most recent month- and quarter-end is available at https://www.globalxetfs.com/funds/EMBD.
1. International Monetary Fund. World Economic Outlook (April 2025).
2. Neuberger Berman. (2025, Feb 25). Ratings Renaissance in Emerging Market Corporates.
3. World Bank. (2024, Mar 28). World Bank Group Publishes New Data, Aiming to Boost Investment in Emerging Markets.
4. International Finance Corporation (IFC). (2024, Mar 28). IFC Portfolio Default Rate Analysis.
5. Bloomberg, showing correlation from 12/31/2007-5/30/2025 using monthly data.
6. Bloomberg Global Aggregate Index data as of 05/30/2025 and International Monetary Fund. World Economic Outlook (April 2025).
7. Global X ETFs. EMBD inception date: June 1, 2020. Benchmark: JP Morgan EMBI Global Core Index. Performance reflecting market price returns. Data as of May 31, 2025.
Our new ETF seeks to provide a modern approach to accessing companies shaping today’s technology ecosystem.
Our new ETF seeks to provide a modern approach to accessing companies shaping today’s technology ecosystem.
The first quarter was marred by reduced expectations for Fed rate cuts, higher Japanese government bond yields, and the Iran war.
The first quarter was marred by reduced expectations for Fed rate cuts, higher Japanese government bond yields, and the Iran war.