
Key Takeaways
We believe Emerging Market (EM) debt has evolved into a higher-quality asset class capable of providing meaningful portfolio diversification, potentially making it more suited as a core allocation than tactical trade.
While a simple market-cap weighting would give its largest weights to the countries that have issued the most debt, active management attempts to find those that are managing that debt best.
The Global X Emerging Markets Bond ETF (EMBD) offers active management with a competitive fee, along with the liquidity and transparency of the ETF structure.
For most of the past three decades, EM debt carried a simple reputation: high yield, high risk, and dependent on a weak U.S. dollar to work. That reputation is outdated. We believe EM debt has evolved into a materially higher-quality, more diversified asset class, with a credit profile, a currency dynamic, and a structural argument for active management that together make the case for a core allocation, not a tactical trade.
Currency: The Dollar Relationship Can Work in Investors' Favor
U.S. dollar-denominated EM bonds let investors participate in dollar weakness without taking on the added volatility of holding local currency directly. A softer dollar lowers the real cost of servicing dollar debt for EM sovereigns and corporates and tends to lift commodity-linked revenue, both of which support credit conditions. Over the past ~20 years, the U.S. Dollar Index (DXY) has shown a -0.55 correlation with the JPMorgan EMBI Global Core Index, a meaningfully negative relationship.¹ In practice, that means EM dollar debt has tended to benefit when the dollar cycle turns, without requiring investors to hold local-currency exposure to get there.
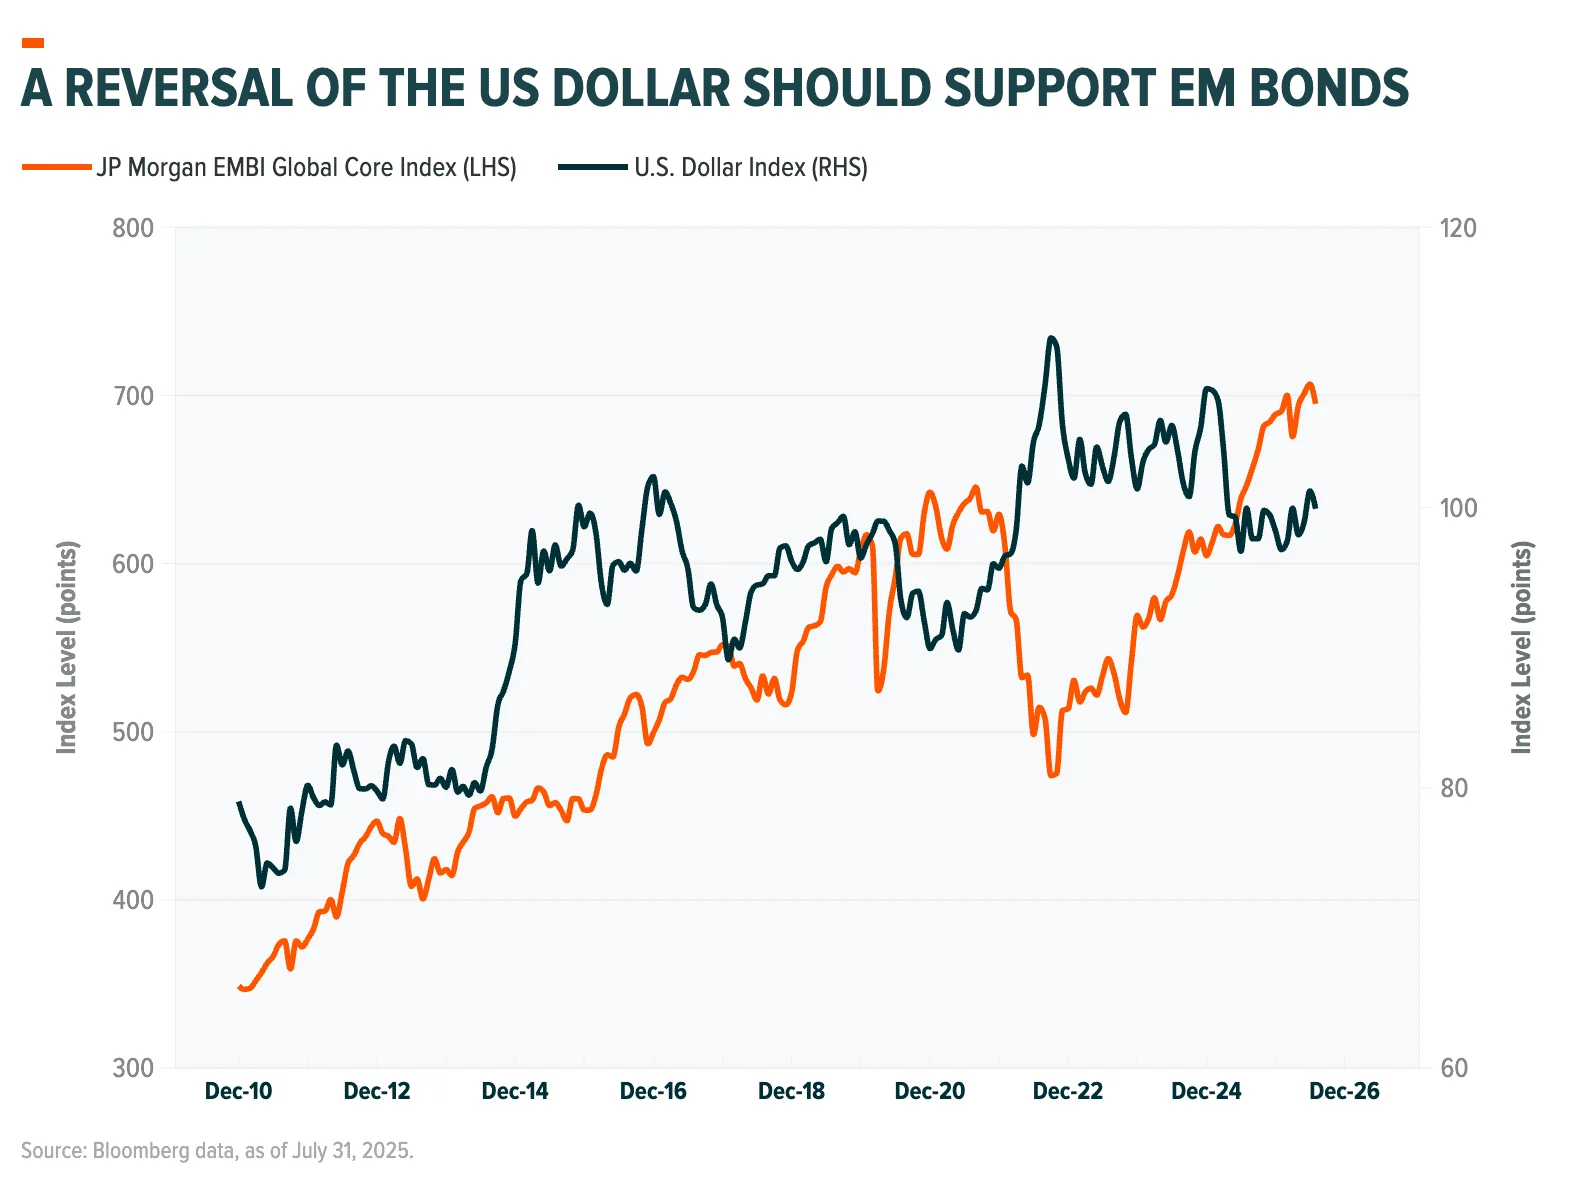
Fiscal comparisons sharpen the point. Mexico's public debt stood near 50% of GDP as of April 2026, while U.S. Federal debt held by the public was close to 100% of GDP at the same time, a gap the Congressional Budget Office projects widening toward 125% by 2036.2,3 Relative fiscal footing, not just the dollar's direction, is increasingly part of the EM debt story.
Credit: A Genuinely Different Market
The credit story has been improving. Fitch Ratings tallies seven Emerging Market sovereign upgrades against just two downgrades so far in 2026, including Argentina, Bolivia, Ecuador, Ghana, and South Africa, continuing a multi-year run of upgrades outpacing downgrades across the asset class.4 The gains reflect reduced fiscal deficits, current account adjustment, and inflation-targeting regimes that have taken hold across a widening set of EM economies. This is no longer a market defined by a handful of serial restructurers.
Why Active Management Still Matters
Simple market-cap weighting would give its largest weights to the countries that have issued the most debt, not necessarily the ones managing that debt best. Thus, passive exposure can inherit this tension at the margin. Active managers can go further, overweighting sovereigns and corporates with improving fiscal trajectories, underweighting structurally impaired credits, and assessing where relative value sits between a country's sovereign bonds and its corporate issuers, a distinction no benchmark makes for you.
Diversification That Actually Diversifies
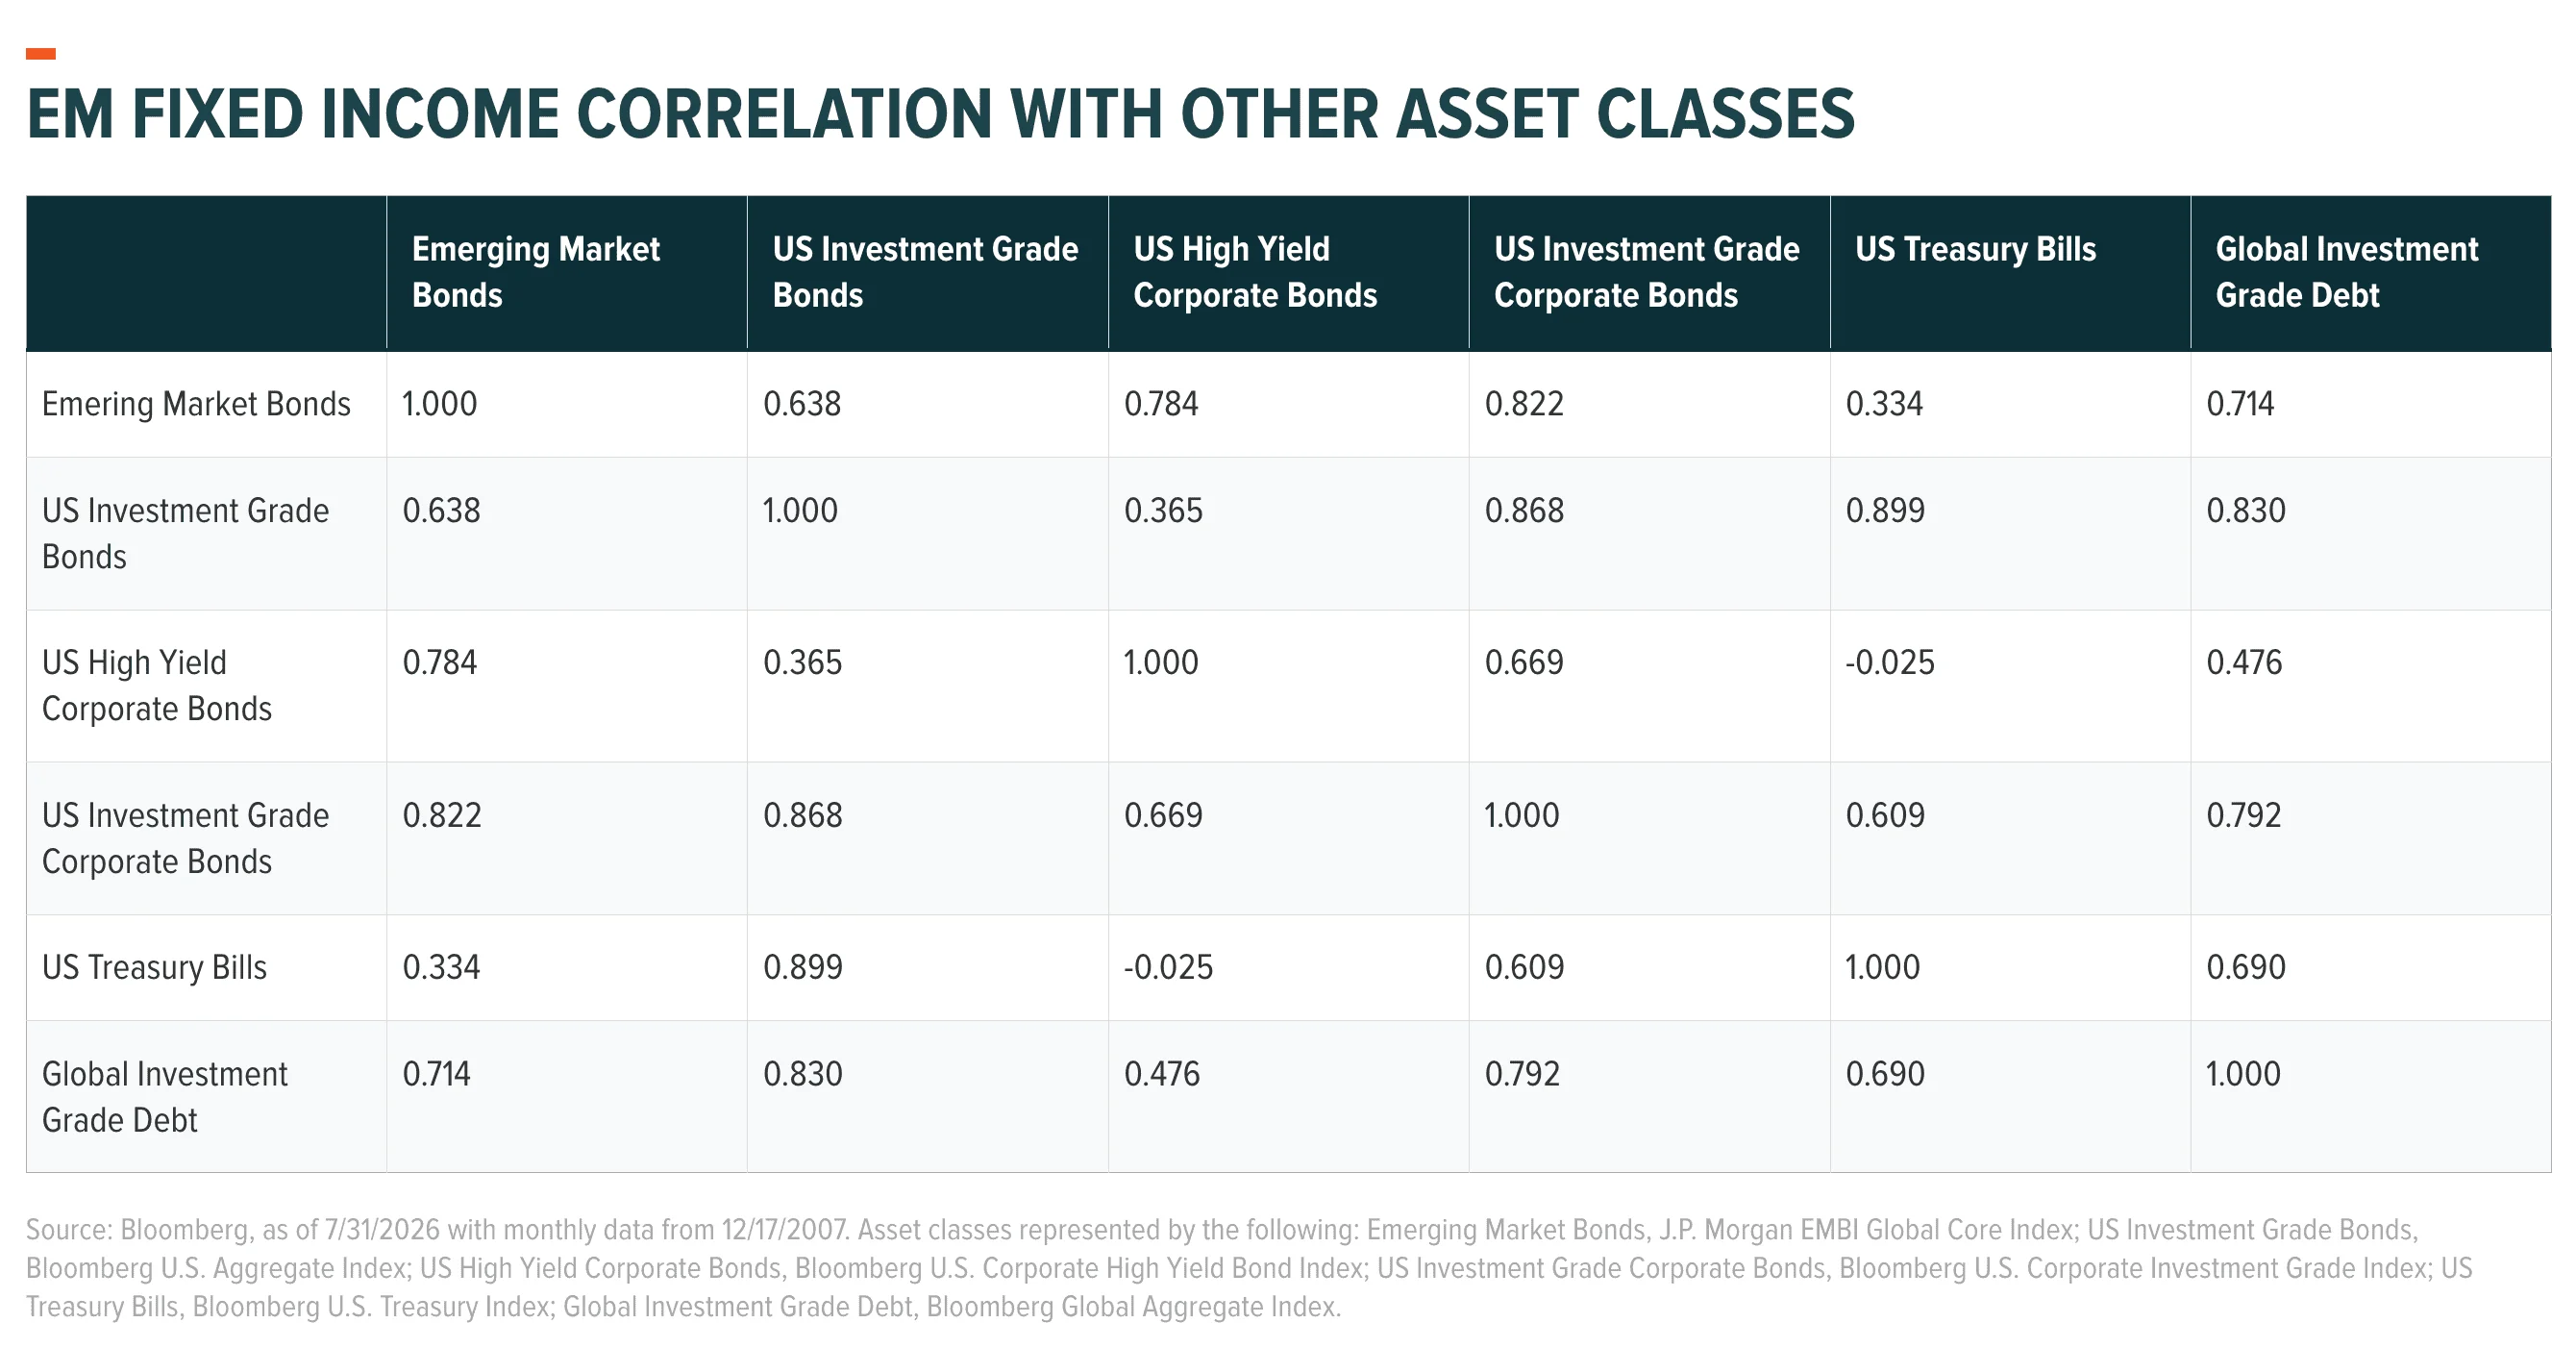
EM debt's correlation profile reinforces the case for diversification. Using nearly 20 years of monthly data, EM bonds have shown just a 0.33 correlation to U.S. Treasury bills, versus 0.82 to U.S. investment-grade corporates and 0.78 to U.S. high-yield corporates.5 That is a meaningfully different return stream than the interest-rate and credit risk carried by core U.S. fixed income exposures such as Treasuries, investment-grade corporates, and high yield, and it means EM debt can dampen, rather than duplicate, the interest-rate and credit risk investors may already carry elsewhere in a portfolio.
EM Debt as the Rate-Cutting Cycle Matures
The Fed held rates steady in July 2026 after a divided vote, and the aggressive easing phase of this cycle looks to be maturing rather than accelerating.6 History offers a useful guide for what that transition has meant for EM debt. Following the three completed Fed easing cycles since 2007, the JPMorgan EMBI Global Core Index outperformed the Bloomberg U.S. Aggregate, U.S. Corporate Investment Grade, and U.S. Treasury indices at every measured interval, six, twelve, twenty-four, and thirty-six months after the cutting cycle ended.7 That pattern reflects the asset class's structurally higher carry and its sensitivity to the same global liquidity backdrop that has historically supported risk assets once a cutting cycle matures, not just while it is underway.
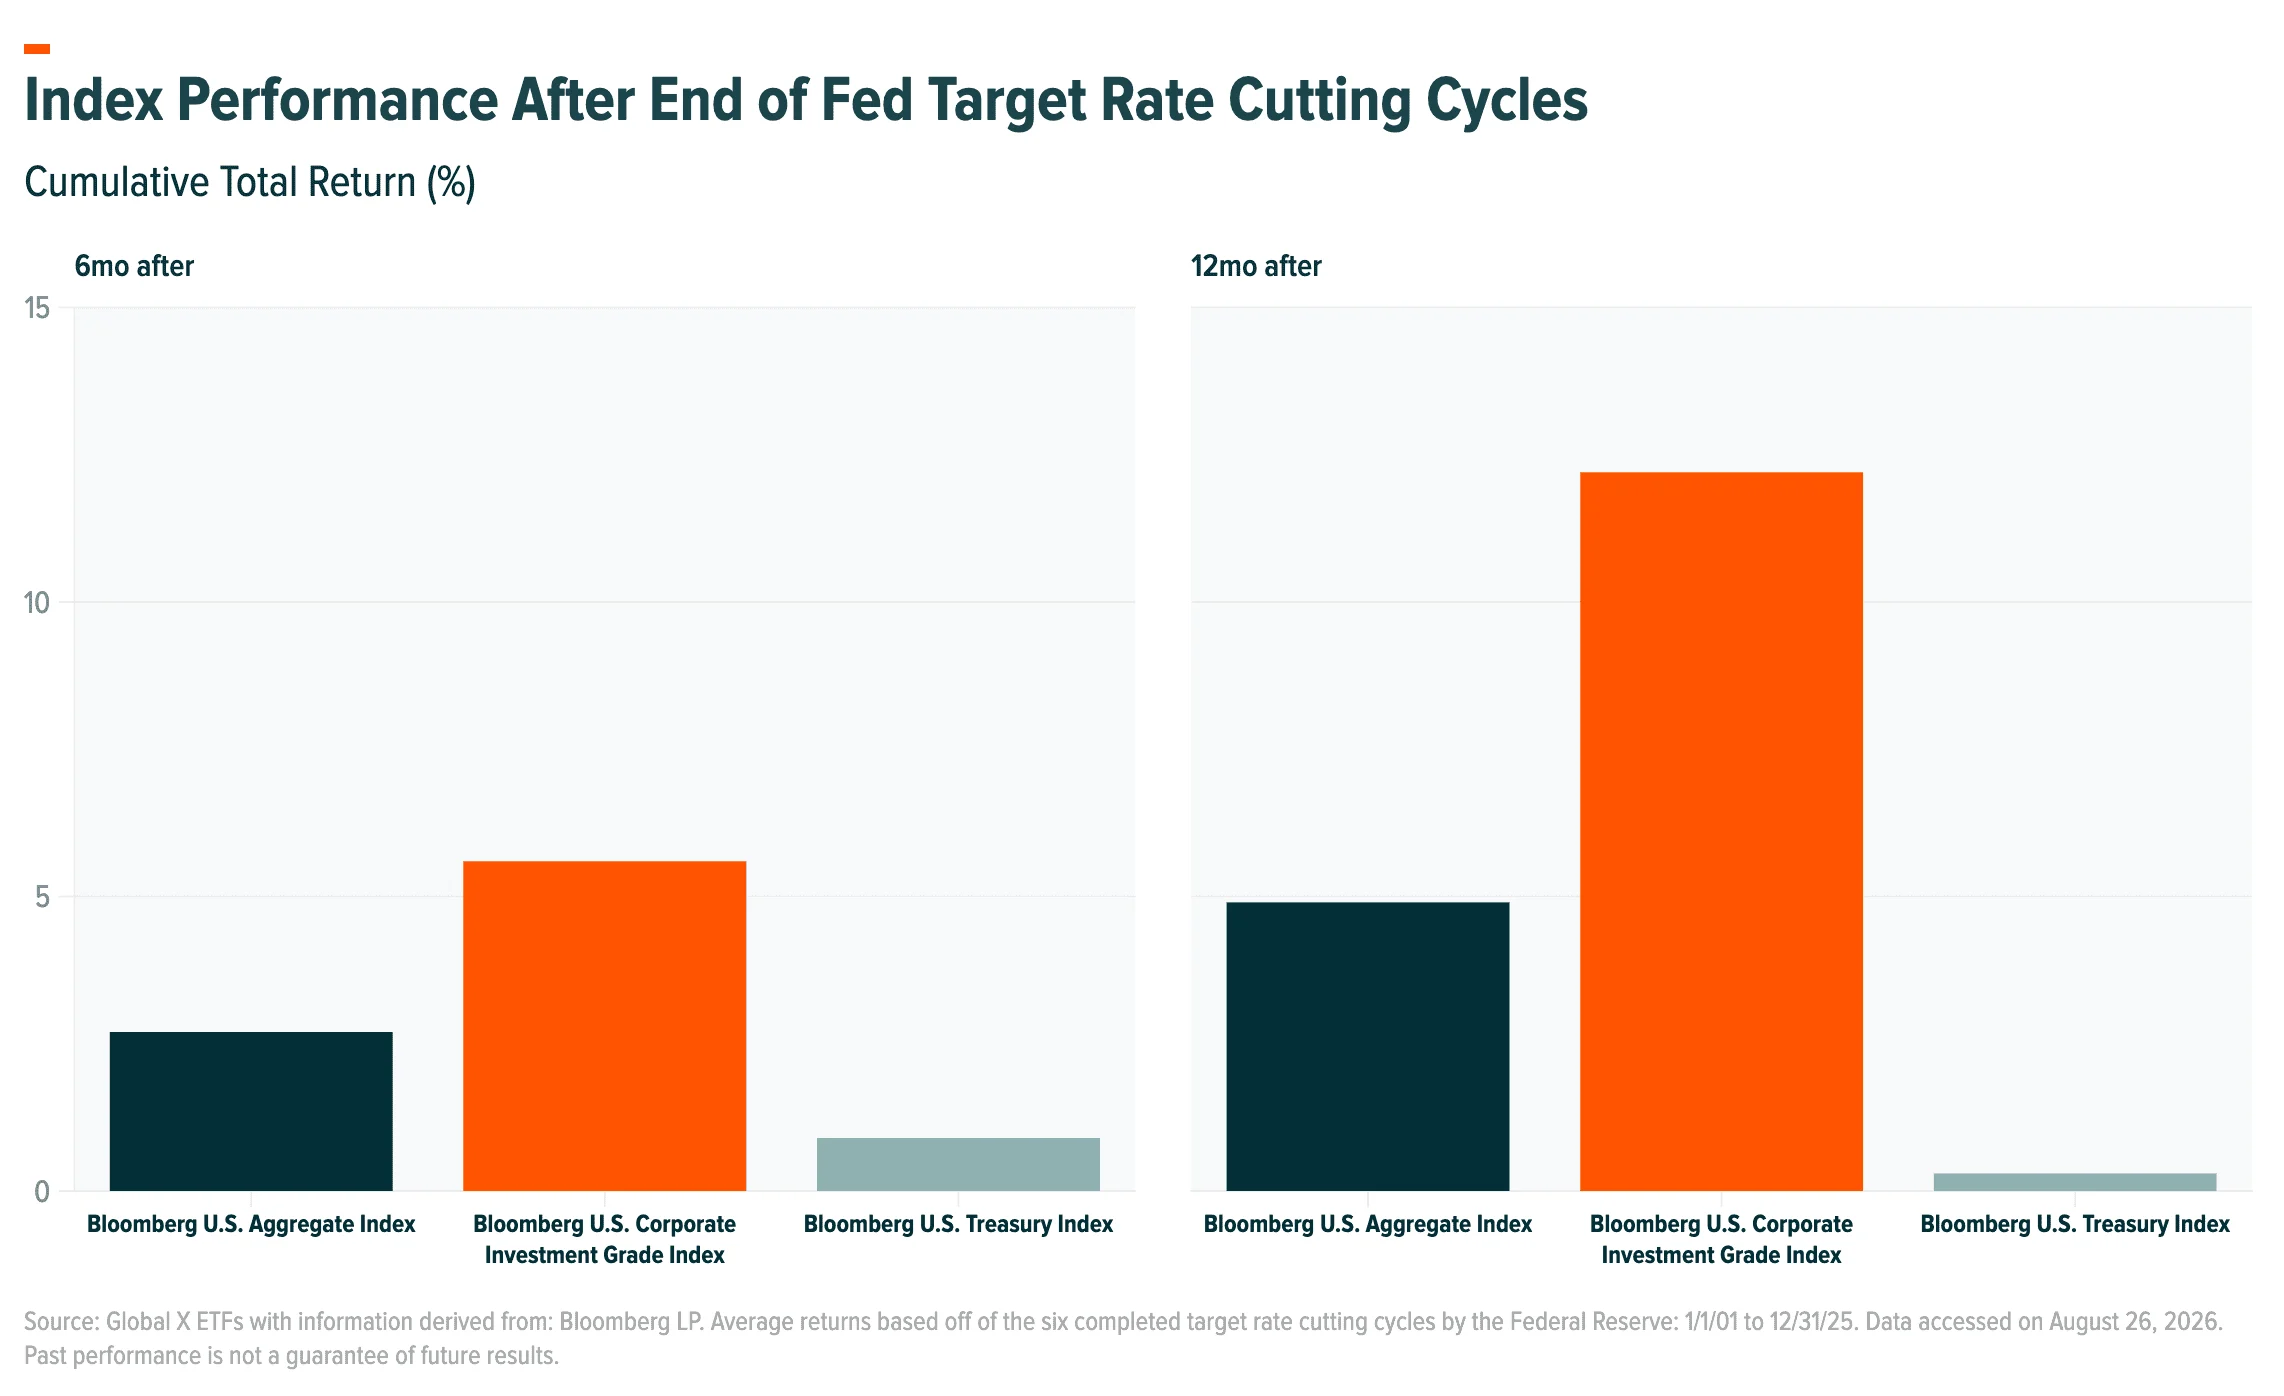
Put together: a dollar-linked but more stable currency exposure, a credit profile that has genuinely improved, a structural case for active management over passive exposure, real diversification benefits, and a historical tailwind once rate-cutting cycles mature. That combination is the argument for treating EM debt as a core allocation, not a trade on the dollar alone.
Why EMBD?
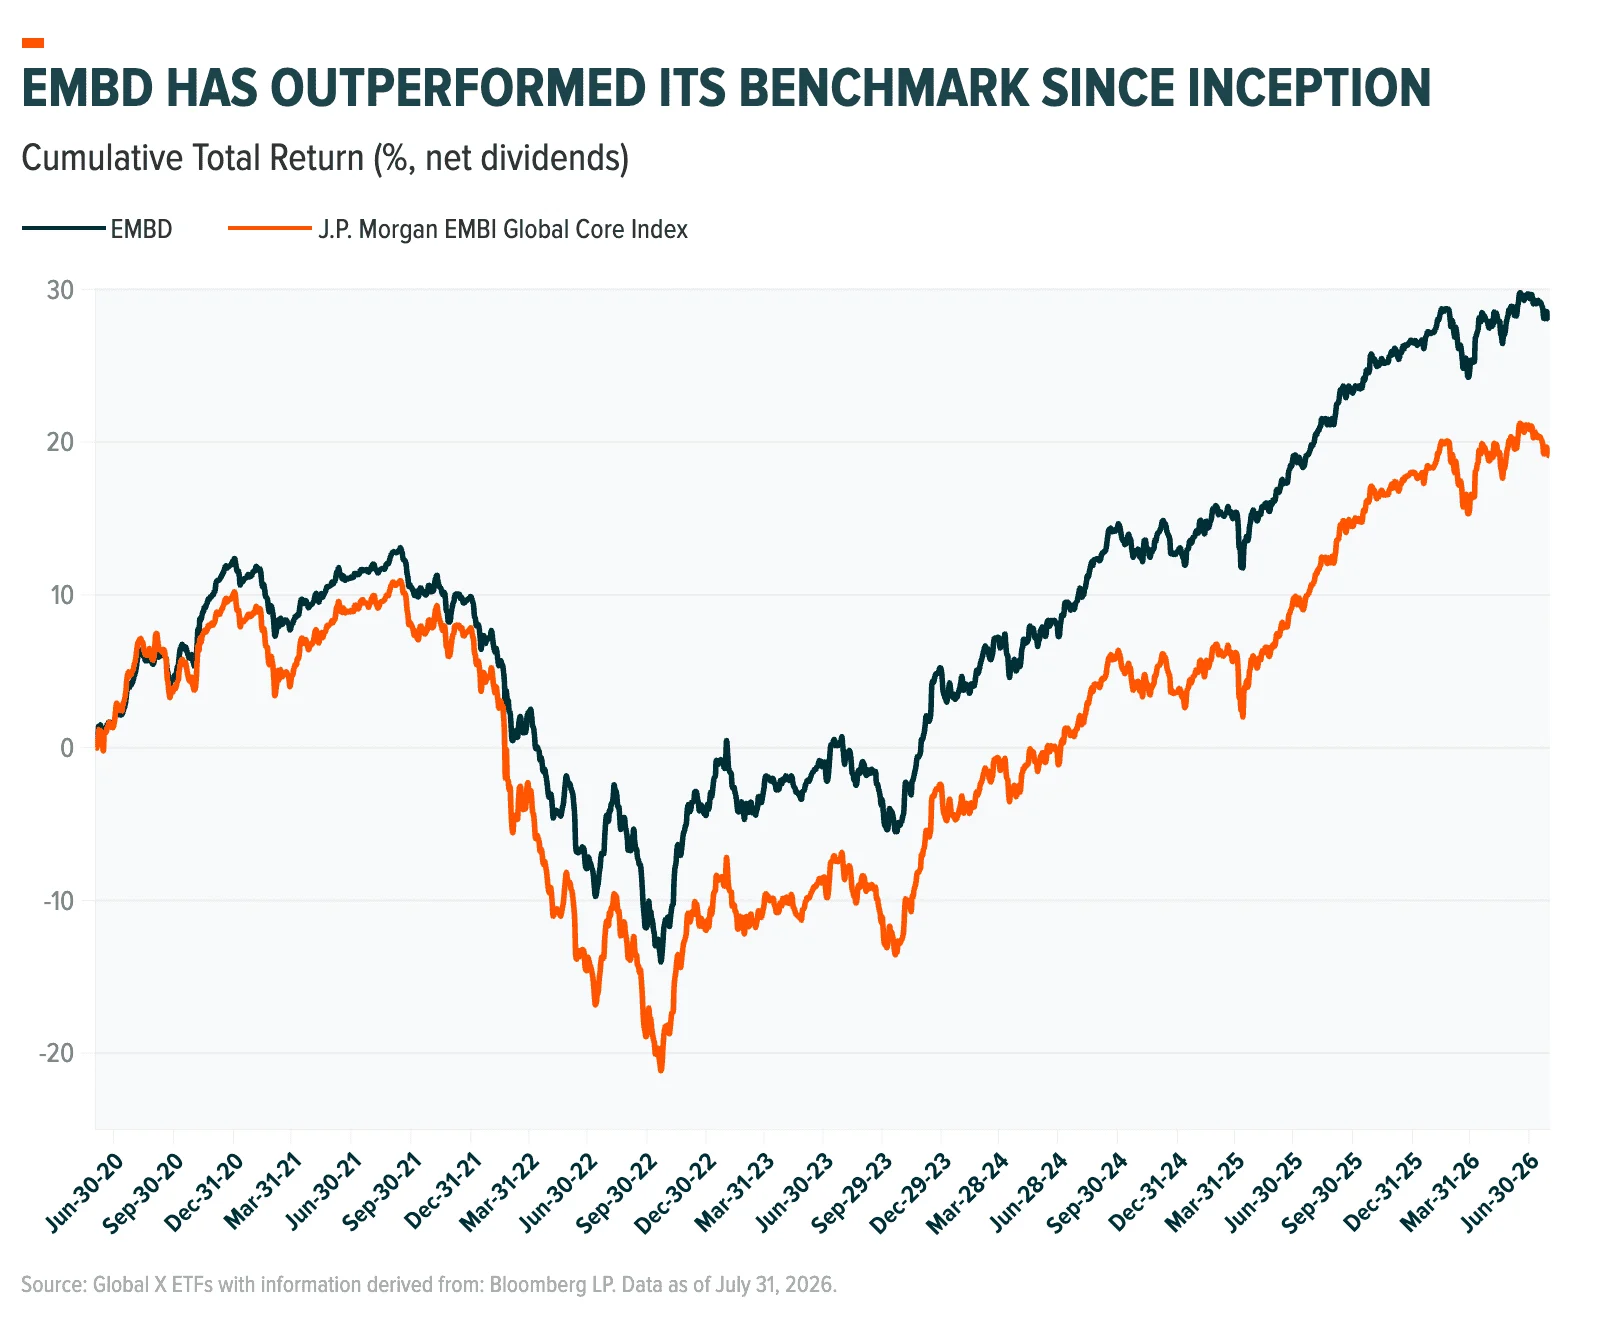
In addition to offering potentially higher yield, diversification, exposure to economic growth potential, and improving fundamentals in EMs, EMBD offers active management with a competitive fee, along with the liquidity and transparency of the ETF structure.8 EMBD is also sub-advised by Mirae Asset Global Investments (USA) LLC and is supported by a dedicated nine-person investment and research team located in New York and Asia. Additionally, we have members from our Macro and Quantitative strategy teams who provide macroeconomic data analysis and statistical scenario analysis for top-down assessment. The fund is managed by two portfolio managers focused on both top-down and bottom-up analysis using a strict, proven, and repeatable investment process. Furthermore, EMBD has outperformed its benchmark since inception, with an annualized total return (based on net asset value) 1.21% higher than the JPMorgan EMBI Global Core Index.9
Related ETFs
EMBD – Global X Emerging Markets Bond ETF
Click the fund name above to view current performance and holdings. Holdings are subject to change. Current and future holdings are subject to risk.