Thought LeadershipEmerging MarketsEquity Income Strategies
Why Emerging Markets? Why EMC?
M
Multiple authors
May 17, 20241 min read
Get the latest news and updates from our team.
Copyright © 2026 Global X. All rights reserved.
SEI Investments Distribution Co. (1 Freedom Valley Drive, Oaks, PA, 19456) is the distributor for the Global X Funds.
Check the background of SIDCO and Global X's Registered Representatives on FINRA's BrokerCheck.
Benjamin Lavine
Benjamin Lavine
Multiple authors
This month’s Through the Systematic Lens title loosely borrows from Shakespeare’s Hamlet. The title plays off one of Hamlet’s most famous lines (“Alas, poor Yorick! I knew him, Horatio.”): the protagonist holds up a skull of Poor Yorick, a court jester from his youth, ruminating on mortality as the final equalizer of us all regardless of social status.
Indulge us as we attempt to draw parallels between the Bard of Avon’s most famous play to today’s investment climate facing a stand-off between 1) the optimism over a secular growth cycle fueled by infrastructure spending (both traditional and AI-demand driven data centers) and 2) the pessimism over rising inflation-adjusted (real) interest rates, partly in response to #1, along with the post-COVID shutdown supply shocks, exacerbated by the Ukraine/Russia and Strait of Hormuz conflicts that don’t appear to be resolving themselves soon. It’s understandable that as the ‘present’ becomes less palatable due to these greater uncertainties, we naturally want to distance ourselves from the current headlines, shifting our gaze to future growth opportunities across advanced computing and scientific breakthroughs. We’d rather imagine what the future holds rather than stare at Poor Yorick’s skull of present times.
The upshot? Acknowledging that 1) a rising nominal economic growth environment met with 2) higher inflation and interest rates may be less conducive for cash generating companies and rate-sensitive sectors (i.e. utilities and real estate), investors may well consider diversifying their existing allocation to the potential ‘future’ by allocating more of their capital to the ‘present’ as embodied by cash flow generation and shareholder distributions. Memento Mori: The future, like our mortality, is coming and is rooted in present times, so pay attention to things that matter today, such as the price you pay, the risks that you undertake, the discipline and flexibility to manage through the ups and downs.1
Corporate financial metrics reflecting present conditions, such as free cash flow generation and shareholder distributions, may provide the strategic grounding and flexibility for navigating a future not easily observed.
Investing for the present does not necessarily entail sacrificing future growth prospects, especially if those present opportunities provide adequate risk compensation, as reflected in investment yields.
Investors may consider core equity options ranging from disciplined capital deployment to free cash flow generation and dividend distributions to help diversify the (uncertain) prospects of future growth.
Hamlet’s skull is a juxtaposition of the distant past and the distant future, that snaps the Danish Prince back to reality and to focus on the present. Likewise, investor fixation on the distant future promises of significant returns and life-changing impacts from artificial intelligence has opened the floodgate of capital deployment, an arms race to see who can extract the highest investment return from the delivery of a future that seems to be arriving sooner than expected. This fixation is also embedded in financial tools that help us psychologically connect the future to the present, whether the terminal value in a discounted cash flow model or the compounded annual growth rate potential of tapping into a total addressable market (TAM).
By reminiscing about his youthful memories with Yorick (“He Hath Borne Me…”), Hamlet reminds us that our expectations of the future are rooted in both past and present, the financial track record of today’s enterprises. Yes, we can invest in the promises and dreams presented by the future, but the future can take care of itself if grounded in the hard reality of the here-and-now, built on sound capital deployment and strategic decision-making. The starting point of any discounted cash flow model is what the company is doing today and how it got there. Present financial conditions generally provide a reasonable basis for expectations of future growth and margin expansion.
Poor Yorick’s skull is a reminder for investors to start paying attention to the present and not be overly fixated on what is to come, even if based on the best judgments of today. We may well be entering a new market regime of accelerated capital spending driven primarily by the artificial intelligence (AI) infrastructure buildout and semiconductor capacity expansion and fueled by external financing, versus the prior regimen that enjoyed capital light deployment and free cash flow generation that had fueled share repurchases and dividends.
But present capital deployment and future capital needs have not yet collided. Fortunately, market consensus is expecting a capital deployment ‘nirvana’ as aggregate corporate free cash flow (FCF), or cash generation after capital expenditures, as a % of revenue is expected to remain at post-COVID elevated levels even though capital intensity (capital expenditures (capex) as a % of revenue) is expected to increase, albeit at a slower rate from the acceleration that started in 2024. Higher capex met with sustainable free cash flow potentially reduces the financial pressure on capital spenders to seek external financing that could pressure balance sheets and dilute shareholder returns. Yet, based on current estimates, we could be entering a new market regime characterized by the highest capital intensity versus the prior 20 years, so free cash flow will likely need to keep pace to help fund some of this capital intensity.
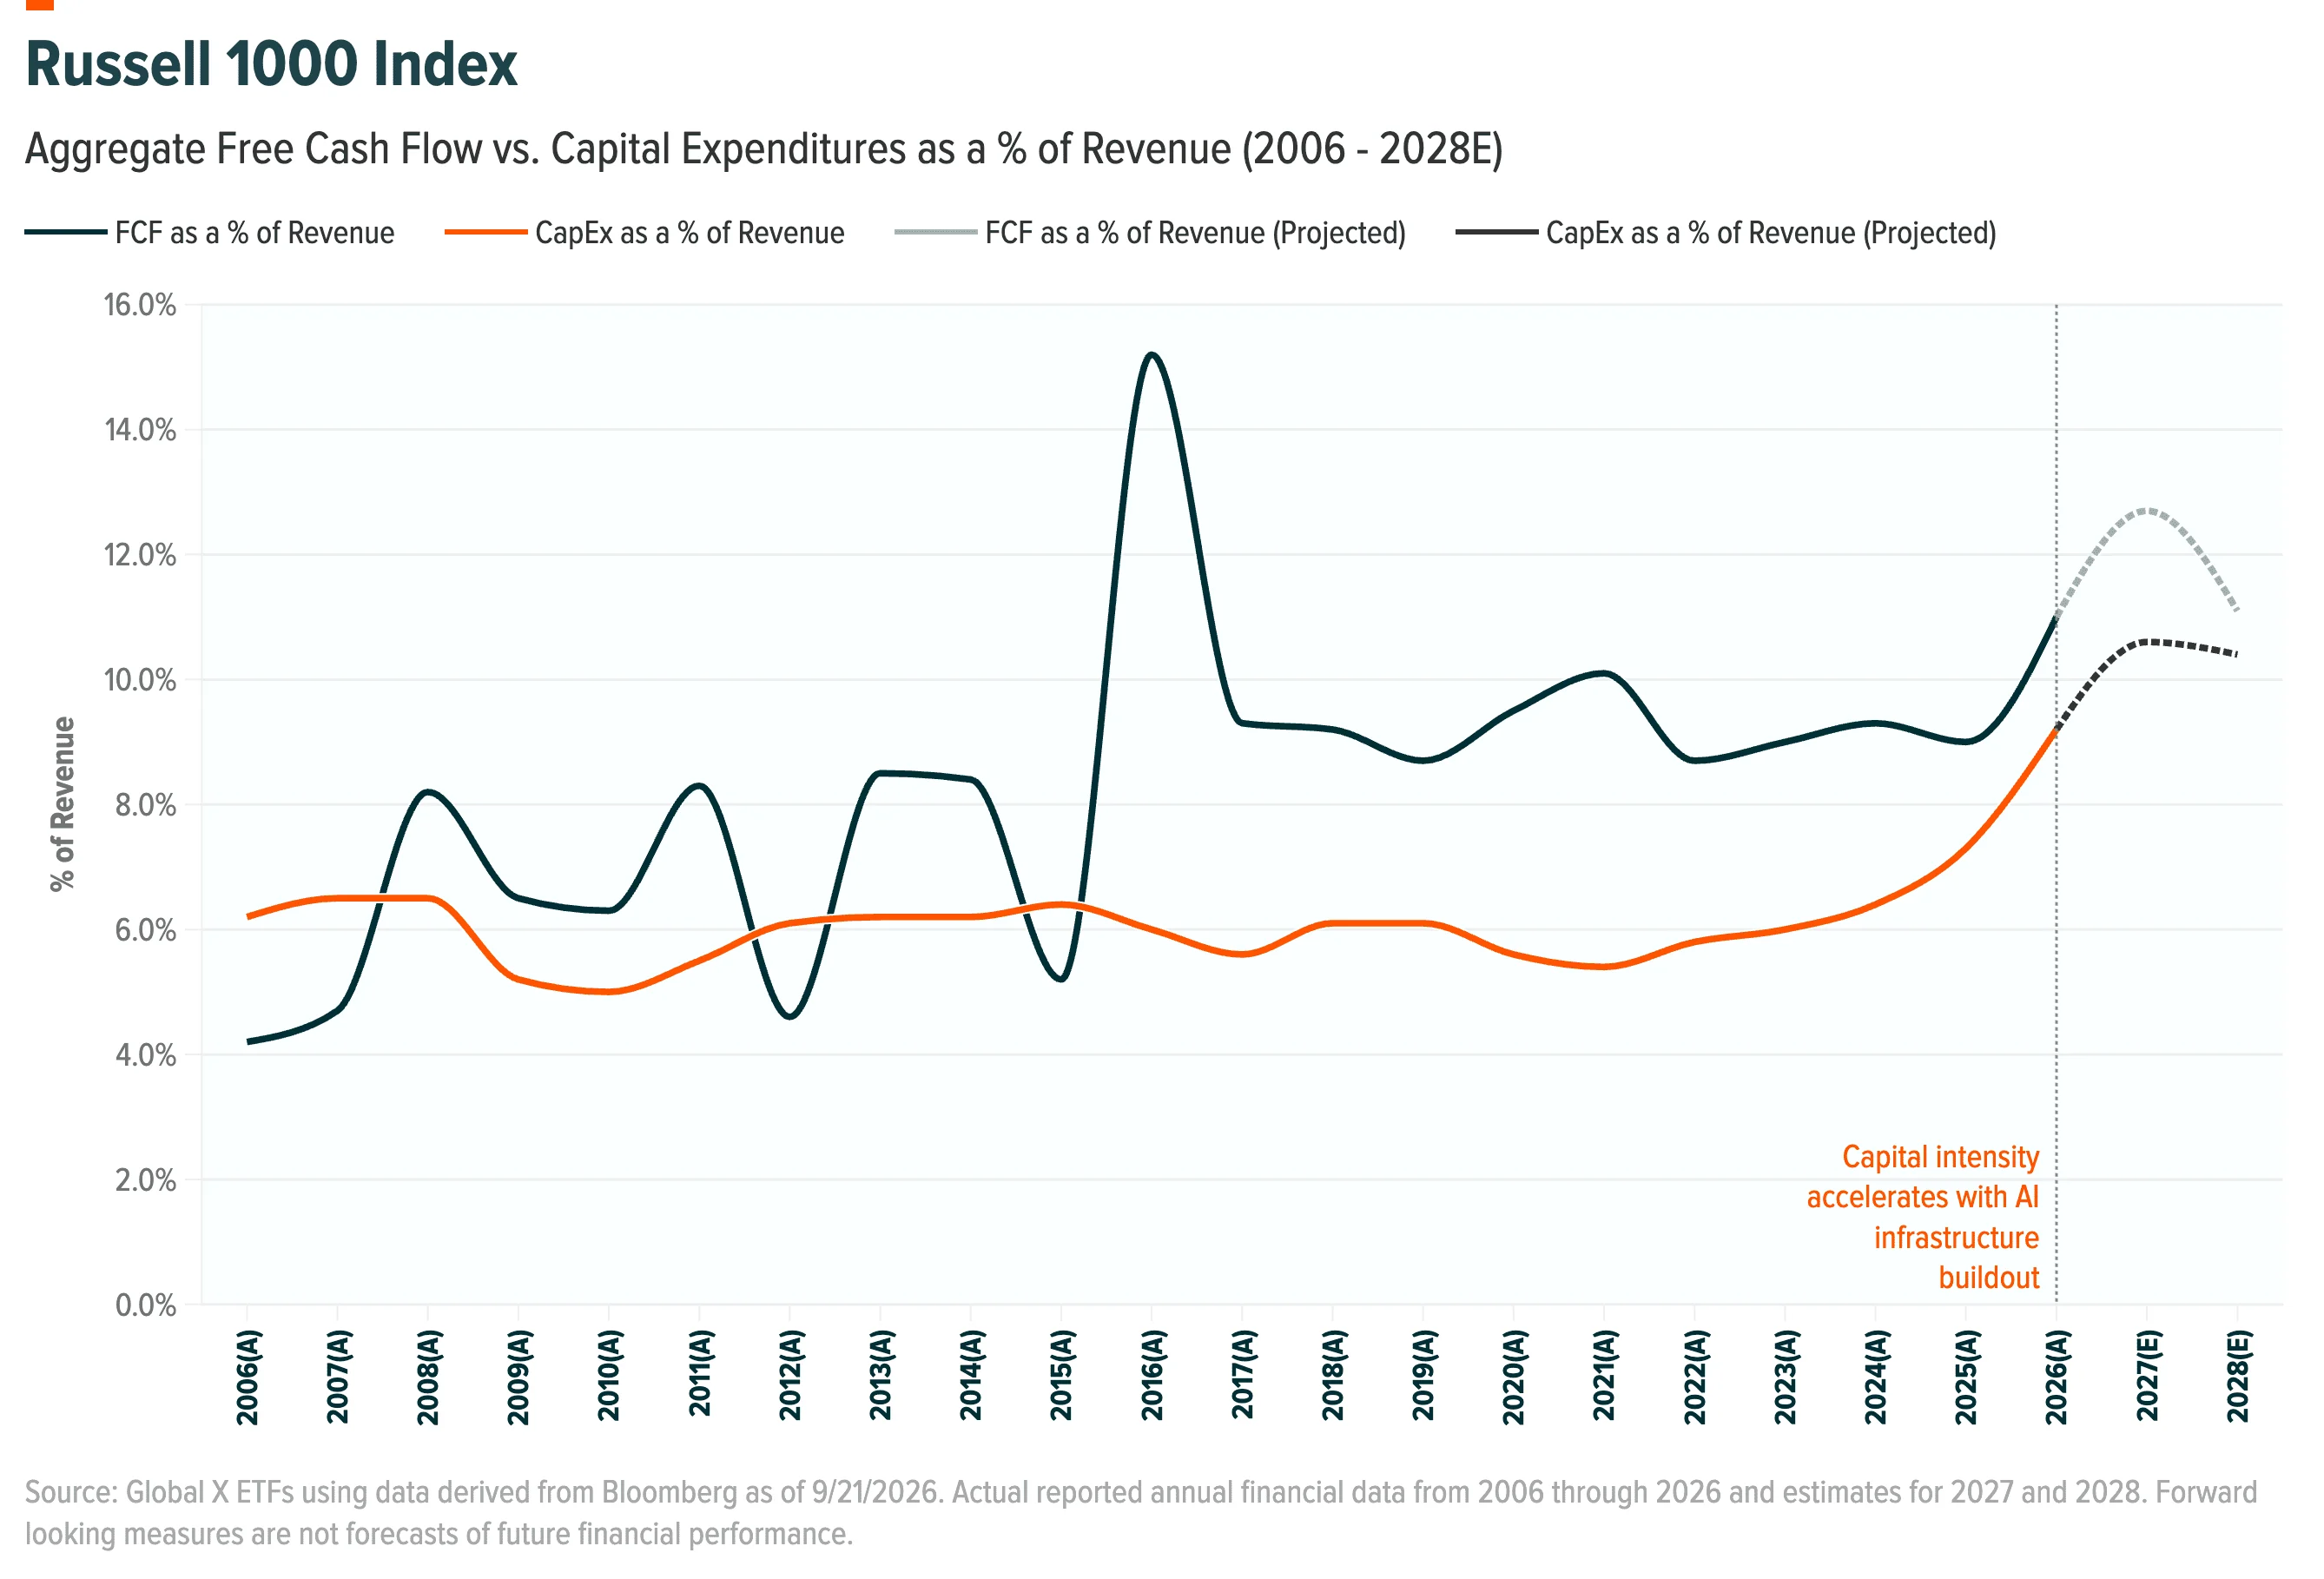
The Information Technology (IT) sector bears much of the burden of meeting this capital nirvana as capital intensity for the IT sector is expected to decline from 21.8% in 2024 to 11.8% in 2028.2 This moderation suggests that AI-driven capex will eventually ease as companies reap the anticipated gains from their investments. However, IT capex is expected to remain the highest among major sectors in absolute dollar terms as cumulative capital spending by the hyperscalers is expected to exceed $6 trillion from 2024 to 2030. Note, these are third-party estimates/projections, subject to change, and not a guarantee of any outcome.
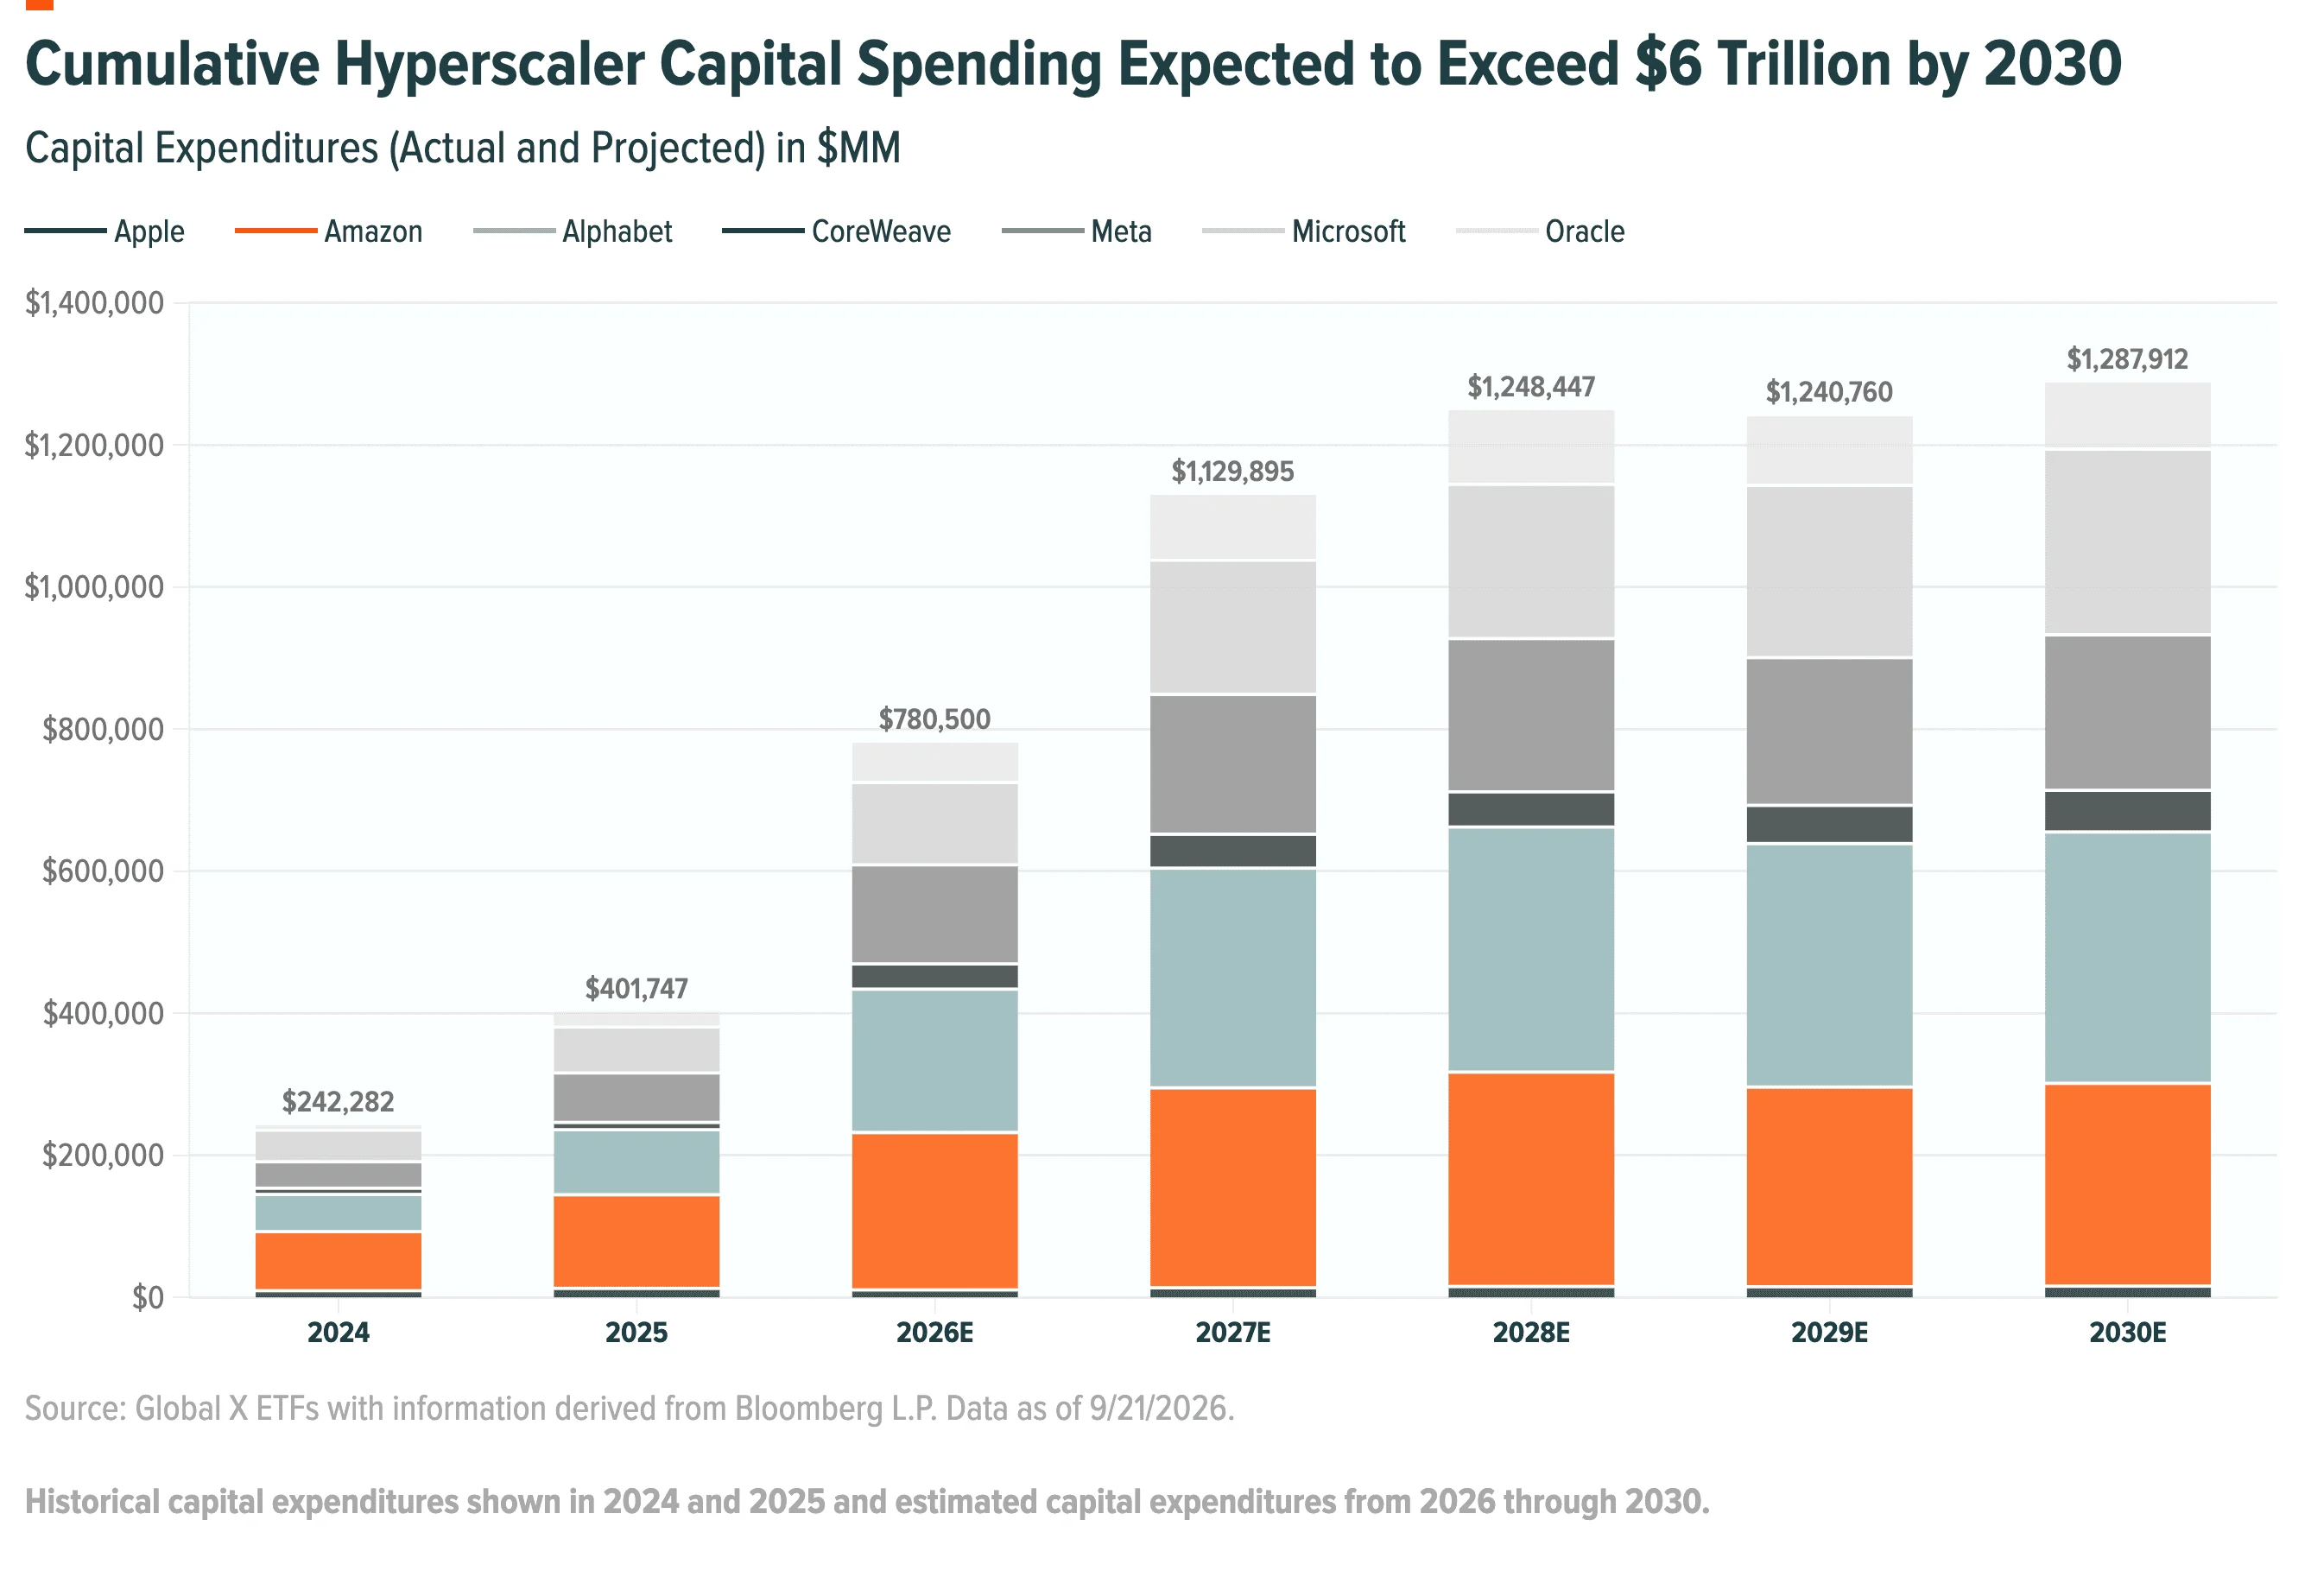
However, outside of IT, the need for broader infrastructure upgrades to keep pace with the computing demands from data centers will likely drive a structural ramp-up in capex across utilities (grid modernization, electricity transmission and storage), manufacturing (logistics), and materials (raw and intermediate production). Bloomberg Research's optimistic long-run scenario suggests AI-driven spending could contribute as much as 17% to cumulative US GDP growth by 2030, depending on productivity gains and adoption.3 The projected capital intensity would be even higher if not offset by expected sharp declines across energy and real estate, consistent with more capital discipline for the former and less transaction activity for the latter.
The risk to the AI capex narrative is that this projected cycle repeats the disappointments from prior spending boom cycles as capital spending risks outpacing earnings growth and cash flow generation, leading to underutilization of installed capacity, or the capital deepening phenomenon described by economists resulting from a decline in total factor productivity (the portion of economic growth that is not explained by increases in the quantity of labor or capital inputs alone). At the peak of a typical capital spending boom, high capex companies generally experience 1) a compression in free cash flow, 2) increased financial leverage, 3) dilution of shareholder returns, and 4) structural competitive disadvantages due to underutilization of the installed asset base.
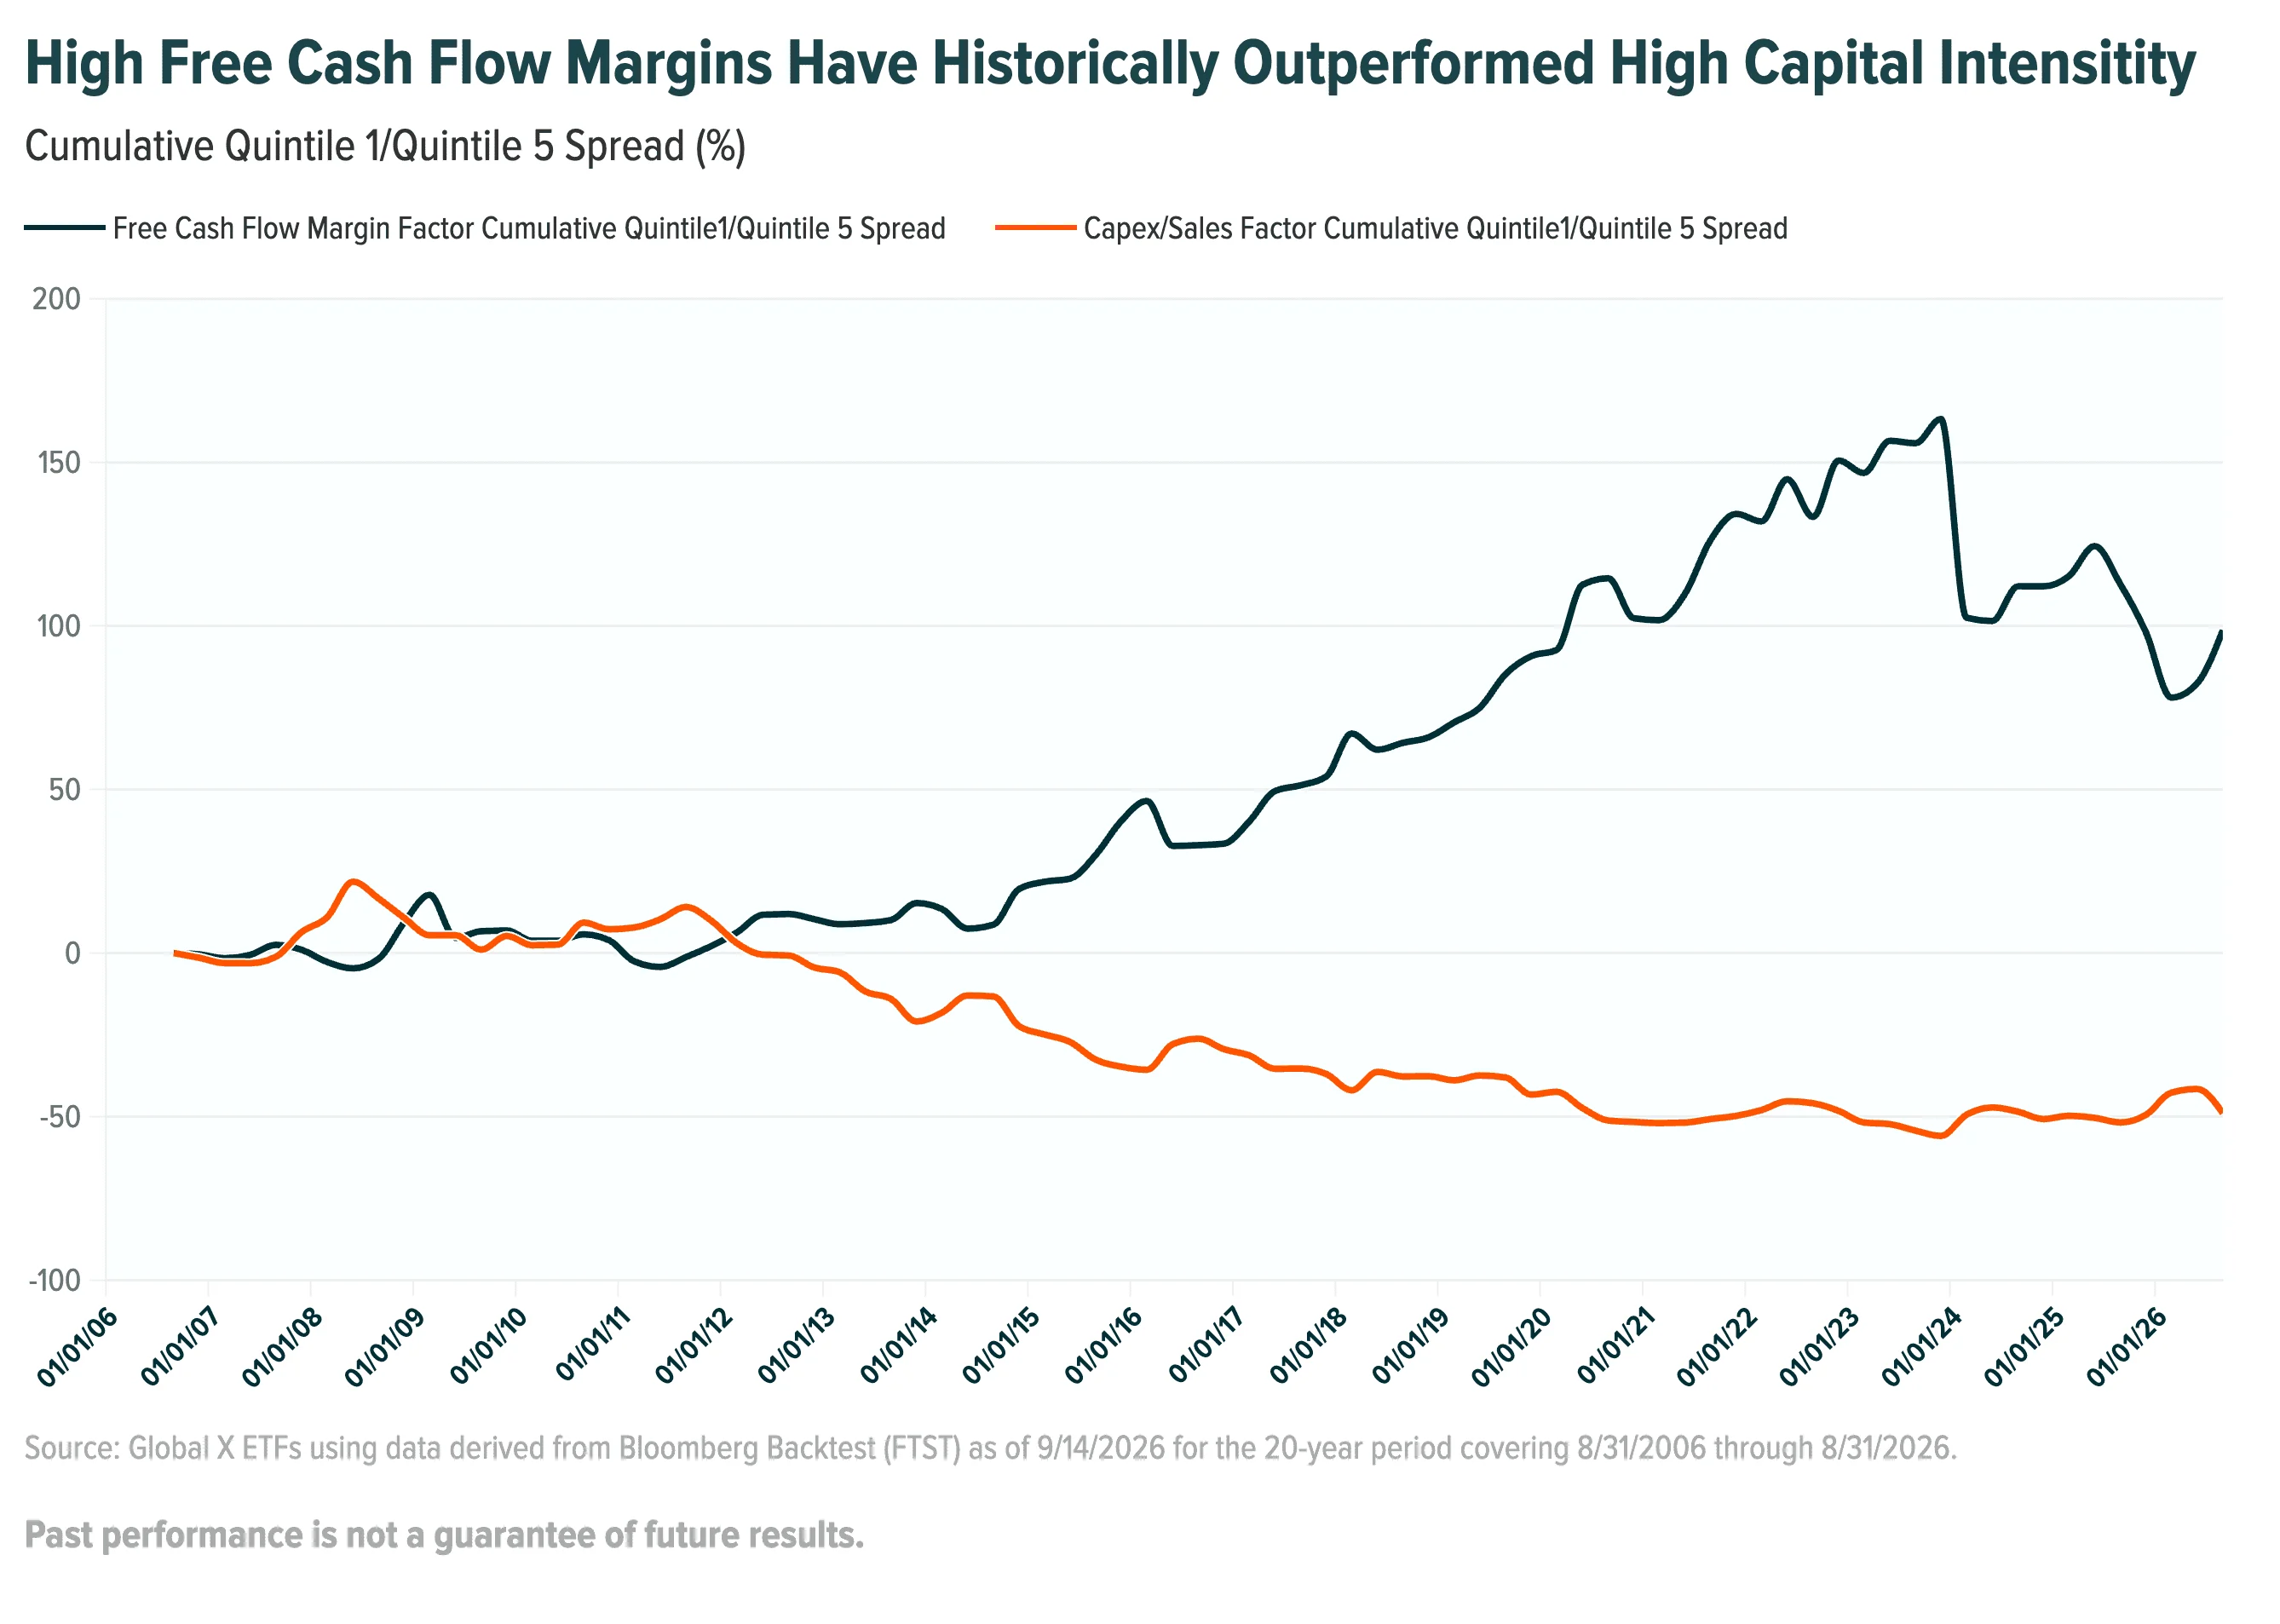
As the following factor analysis illustrates, free cash flow margins has generally experienced more tailwinds than headwinds in contrast to high capital intensity over the 20-year period ending 8/31/2026. Note that this factor analysis does not incorporate equity valuations as is commonly found with value-based factors such as price/earnings, price/sales, price/book, dividend yield, etc. This analysis uses company revenue as the common standardization to better isolate the effects of free cash flow generation versus capital spending.
First, here is the summary breakdown of the analysis:
Universe: Russell 1000 Index
Range of analysis: 8/31/2006 through 8/31/2026
Quarterly rebalancing, no grouping (i.e. sector neutrality), Winsorize at 3 standard deviations, no transaction costs assumed.
Factor values segmented by quintiles with Quintile 1 (Q1) representing the highest value and Quintile 5 (Q5) representing the lowest value.
Factor performance is presented as a return spread between Q1 and Q5 to neutralize equity market performance.
Factor 1: Free Cash Flow Margin (Latest Fiscal Year):
Industrials, Insurance, Utilities, & Real Estate Investment Trusts (REITs): Free Cash Flow / Sales/Revenue/Turnover
Banks & Financials: Free Cashflow / Net Revenue
Factor 2: Capex / Sales (Capital Intensity) (Latest Fiscal Year):
All Sectors: (Capital Expenditures – Investment in Operating Lease Assets) / Net Sales
See appendix for additional metrics
Over most of the testing period, the Free Cash Flow Margin Factor outperformed the Capex/Sales Factor. Take note that the reversal of fortunes that has occurred over the last 2-3 years as the Free Cash Flow Margin factor has underperformed the Capex/Sales Factor. This highlights the surge in investor optimism that the AI capital spending cycle will break the curse that has plagued previous cycles.
Could we be entering a new regime where capital intensity will be rewarded above free cash flow generation? Perhaps, but the long run has historically demonstrated that cash generation, like Yorick’s skull, is what remains long after the future has passed by.
The skull held by Hamlet was the only remnant of a life filled with “gambols, songs, and merriment.” Free cash flow is what remains on top of a company’s asset base once all the expenses are paid and capital is expended. Yet, unlike the skull, free cash flow represents the lifeblood of a company’s current operations and growth potential. The ‘future’ is what keeps investors captivated and motivated to further invest into an enterprise’s growth potential, but the ‘future’, like Yorick’s remembered jests, can be fleeting and ephemeral, whereas free cash flow represents the enterprise’s ‘present’ financial state. The future doesn’t pay the bills nor can provide the necessary financial flexibility needed to navigate both present and future.
In this environment of an uncertain outcome of the significant capital spending on AI infrastructure against a backdrop of higher inflation, interest rates, and geopolitical risk, one may consider diversifying equity exposure by investing in the present to diversify the risk of investing towards the distant (and uncertain) future.
The following data reference Bloomberg equity analytics as of 8/31/2026, except where noted.
Equity Core: Investing for Free Cash Flow Generation and Shareholder Friendly Distributions
The Global X Morningstar Capital Allocation Leaders ETF (Ticker: CPTL) aims to invest in companies that exhibit strong capital allocation practices, as measured by Morningstar's proprietary Capital Allocation Rating framework, which assesses how well a company's leadership team uses cash based on a forward-looking evaluation of capital allocation decisions. The investment case is essentially a ‘quality management/capital discipline’ factor thesis, focusing on companies with a strong track record of capital deployment (reinvestment, buybacks, dividends, mergers/acquisitions discipline). As of 8/31/2026, the fund had a trailing 12-month dividend yield of 1.30% and a free cash flow yield of 2.82%.
The Global X U.S. Cash Flow KingsTM 100 ETF (Ticker: FLOW) targets U.S. equities with high free cash flow yields, on the theory that free cash flow is a profitability measure correlated with quality, growth, and value factor exposures, making it usable as a core factor holding. Companies generating strong free cash flow can be better positioned to fund growth, raise dividends, or pay down debt, and tend to be less exposed to the accounting distortions that can inflate reported earnings. As of 8/31/2026, the fund had a trailing 12-month dividend yield of 2.10% and a free cash flow yield of 11.38%.
The Global X SuperDividend® U.S. ETF (Ticker: DIV) invests in 50 of the highest dividend-yielding U.S. equities that have made consistent dividend payments in the past two years. This methodology tends to produce lower market risk versus broad market indices such as the Russell 1000 given the defensive nature of dividend paying stocks. The underlying index’s methodology also incorporates a low-volatility screen to help reduce the "yield trap" risk common in pure high-dividend strategies, where a high indicated dividend yield may indicate financial stress that could result in an eventual cut to the dividend payout in order to restore financial stability. As of 8/31/2026, the fund had a trailing 12-month dividend yield of 6.95% and a free cash flow yield of 8.97%.
The Global X S&P 500® Quality Dividend ETF (Ticker: QDIV) invests in S&P 500 companies scoring in the top 200 by quality metrics (return-on-equity, accruals, financial leverage) and separately in the top 200 by dividend yield, so a name must qualify on both quality and yield. The fund may be able to avoid the higher-risk, potentially unsustainable yields that a pure high-yield screen may be more prone to include, by requiring quality-factor confirmation alongside yield. As of 8/31/2026, the fund had a trailing 12-month dividend yield of 2.79% and a free cash flow yield of 7.43%.
Related ETFs
CPTL – Global X Morningstar Capital Allocations ETF
DIV – Global X SuperDividend® U.S. ETF
FLOW – Global X U.S. Cash Flow Kings™100 ETF
QDIV – Global X S&P 500® Quality Dividend ETF
Past performance is not a guarantee of future results. Click on the fund name above for the 30-day SEC yield, standard performance, and prospectus.
Summary Statistics for Free Cash Flow Margin vs Capital Expenditure / Sales: 08/31/2006 to 08/31/2026 | ||
|---|---|---|
Statistic | ||
Source: Global X ETFs using data derived from Bloomberg as of 9/14/2026 for the 20-year period covering 8/31/2006 through 8/31/2026. Past performance is not indicative of future results. The benchmark return used in this specific case is zero as there is no benchmark for this case study.
Memento Mori: Latin for “remember that you must die,” or more loosely, “remember death.”
Bloomberg data with actual and estimated financial data as of 9/21/2026. The Information Technology (IT) sector as defined by the Global Industry Classification Standard (GICS) of constituents within the S&P 500 Index.
“US INSIGHT: AI’s GDP Contribution - 2.5x What the Stats Show,” Bloomberg Intelligence, 7/16/2026
The Global X Emerging Markets Great Consumer ETF seeks to tap into secular growth in domestic spending across emerging markets.
The Global X Emerging Markets Great Consumer ETF seeks to tap into secular growth in domestic spending across emerging markets.
This month highlights semiconductors/quantum computing as one of the top trending themes and hydrogen as an out-of-favor-theme showing possible recovery.
This month highlights semiconductors/quantum computing as one of the top trending themes and hydrogen as an out-of-favor-theme showing possible recovery.
The Global X Morningstar Capital Allocation Leaders (CPTL) ETF is designed to provide exposure to companies that exhibit strong capital allocation practices.
The Global X Morningstar Capital Allocation Leaders (CPTL) ETF is designed to provide exposure to companies that exhibit strong capital allocation practices.
Free Cash Flow Margin Factor
Capex / Sales Factor
Information Coefficient
0.04
-0.03
Average Securities Count
926
936
Average Turnover (%)
16.63
14.38
Quintile 1 Hit Ratio (%)
58.81
55.92
Quintile 5 Hit Ratio (%)
54.75
58.69
Quintile 1 / Quintile 5 Spread Annualized Return (%)
4.02
-2.82
Quintile 1 / Quintile 5 Spread Cumulative Return (%)
98.67
-48.98
Quintile 1 / Quintile 5 Spread Standard Deviation
10.33
11.04
Quintile 1 / Quintile 5 Spread Sharpe Ratio
0.40
-0.24
Quintile 1 / Quintile 5 Spread Max Drawdown (%)
-35.94
-66.82