Skip to Main Content
Subscribe to Newsletters
Global X Logo
Search
Content loaded

Explore

Our ETFs

Investment Insights

Product ResearchCharting DisruptionMidyear Outlook 2026

Investor Resources

EducationHow to InvestTax Resources

About Us

About Global XNewsroomCareersContact Us

Follow Us

socaial media icon for LinkedInLinkedInSocial media icon for X (twitter)XSocial media icon for FacebookFacebookSocial media icon for InstagramInstagramSocial media icon for Youtube

Copyright © 2026 Global X. All rights reserved.

Privacy PolicyAccessibility Statement
YouTube

Subscribe to our newsletter

Get the latest news and updates from our team.

Subscribe

SEI Investments Distribution Co. (1 Freedom Valley Drive, Oaks, PA, 19456) is the distributor for the Global X Funds.

Check the background of SIDCO and Global X's Registered Representatives on FINRA's BrokerCheck.

Content
Product ResearchThematic GrowthEquity

Through the Systematic Lens: Thematic Equity: Factor Landscape (August 2026)

x
B
Benjamin LavineSenior Investment Strategist
Aug 25, 2026·11 min read

“The trend is your friend, until it bends,” Ed Seykota (1995)

"Opportunity always knocks at the least opportune moment." — Murphy's Law

This is our inaugural piece where we apply a systematic/factor-based lens to the thematic investment landscape, focusing on fund exposures to common risk factors such as growth, value, momentum, quality, and volatility. Rather than judging a theme on narrative or recent performance alone, this systematic lens helps identify where investor sentiment may be building or recovering and the underlying risks expected to contribute to future volatility. Below, we review the broader factor backdrop across U.S. equities, then turn to this month’s Top Trending Themes (by Bloomberg Momentum factor), highlighting the Global X AI Semiconductor & Quantum ETF (CHPX), and the Most Out-of-Favor themes, highlighting the Global X Hydrogen ETF (HYDR).

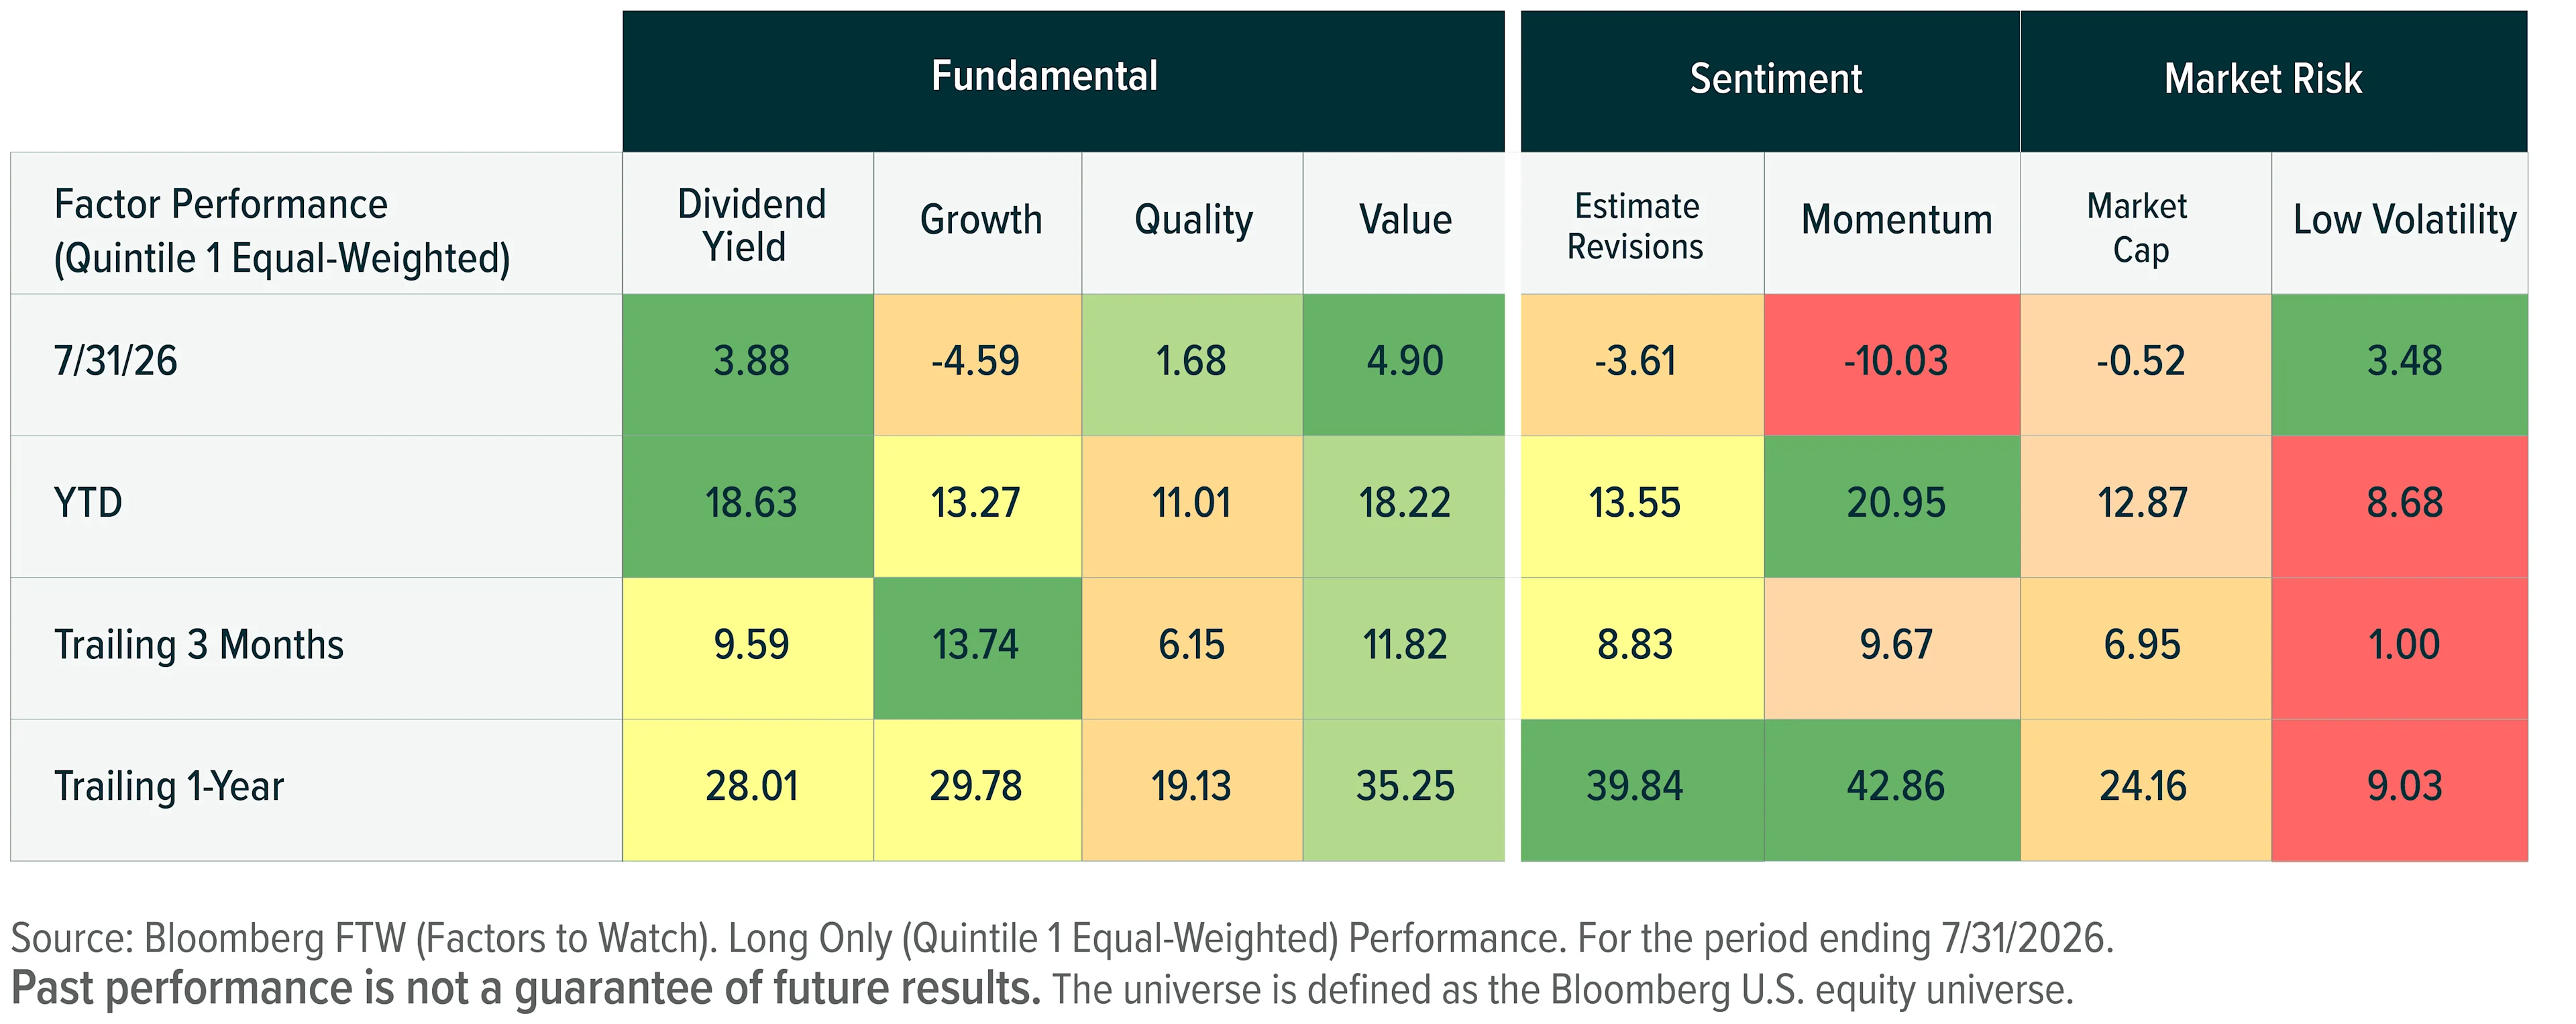
For the month ending 7/31/2026, defensive and value factors (Bloomberg Dividend Yield, Low Volatility, and Value style factors) led Bloomberg U.S. equity universe factor performance, overtaking the growth/momentum regime that had driven the market’s recovery from the Q1 2026 U.S./Iran-conflict sell-off.1 Following an unusually strong period of performance from market leading stocks (as measured by the S&P 500 Momentum Index), the U.S. equity market, as defined by the S&P 500, saw sharp reversals as technology leadership gave way to defensive sectors such as healthcare and financials.2,3

Trailing three-month performance masks this churn: the Bloomberg Momentum Long/Short Sector-Neutral factor suffered a severe peak-to-trough sell-off before recovering late in July.4 The reversal extended beyond semiconductors to the broader AI-adjacent complex — infrastructure, alternative energy, rare earth miners, suggesting a shift in sentiment rather than a fundamental deterioration.5

We believe the fundamental backdrop for pro-cyclical leadership remains intact (see the Global X 2026 Mid-Year Outlook), so this pullback in growth and sentiment factors may be a healthy correction after an exceptionally strong run for Momentum. If the AI-led pullback persists, however, leadership could rotate further toward the value-oriented segments that have lagged over the past year, Bloomberg Dividend Yield and Value have already outperformed Growth, Quality, and Estimate Revisions year-to-date 2026 through 7/31/2026.

Note: all factors referenced in this article are defined by Bloomberg unless stated otherwise.

Defensive and Value Factors Led in July; Momentum and Estimate Revisions Topped the Trailing One-Year Period
Thematic Equity Article Image 1 - Aug 2026

Key Takeaways

  • Momentum continued to dominate U.S. equity leadership despite its sharp pullback, as the market has broadly followed earnings higher. One may consider taking at least a neutral stance on Momentum, with an eye toward oversold themes whose growth fundamentals remain intact.

  • Future tech, AI-adjacent computing, metals producers, genomics, and energy storage/climate technology comprise our Top Trending Themes; we highlight the Global X AI Semiconductor & Quantum ETF (CHPX).

  • Energy storage, alternative energy, environmental, and genomics themes remain our most Out-of-Favor Themes (those that have lagged the broader market over the past four to five years) but show signs of recovery based on recent Momentum; we highlight the Global X Hydrogen ETF (HYDR).
Thematic Equity Article Image 2 - Aug 2026

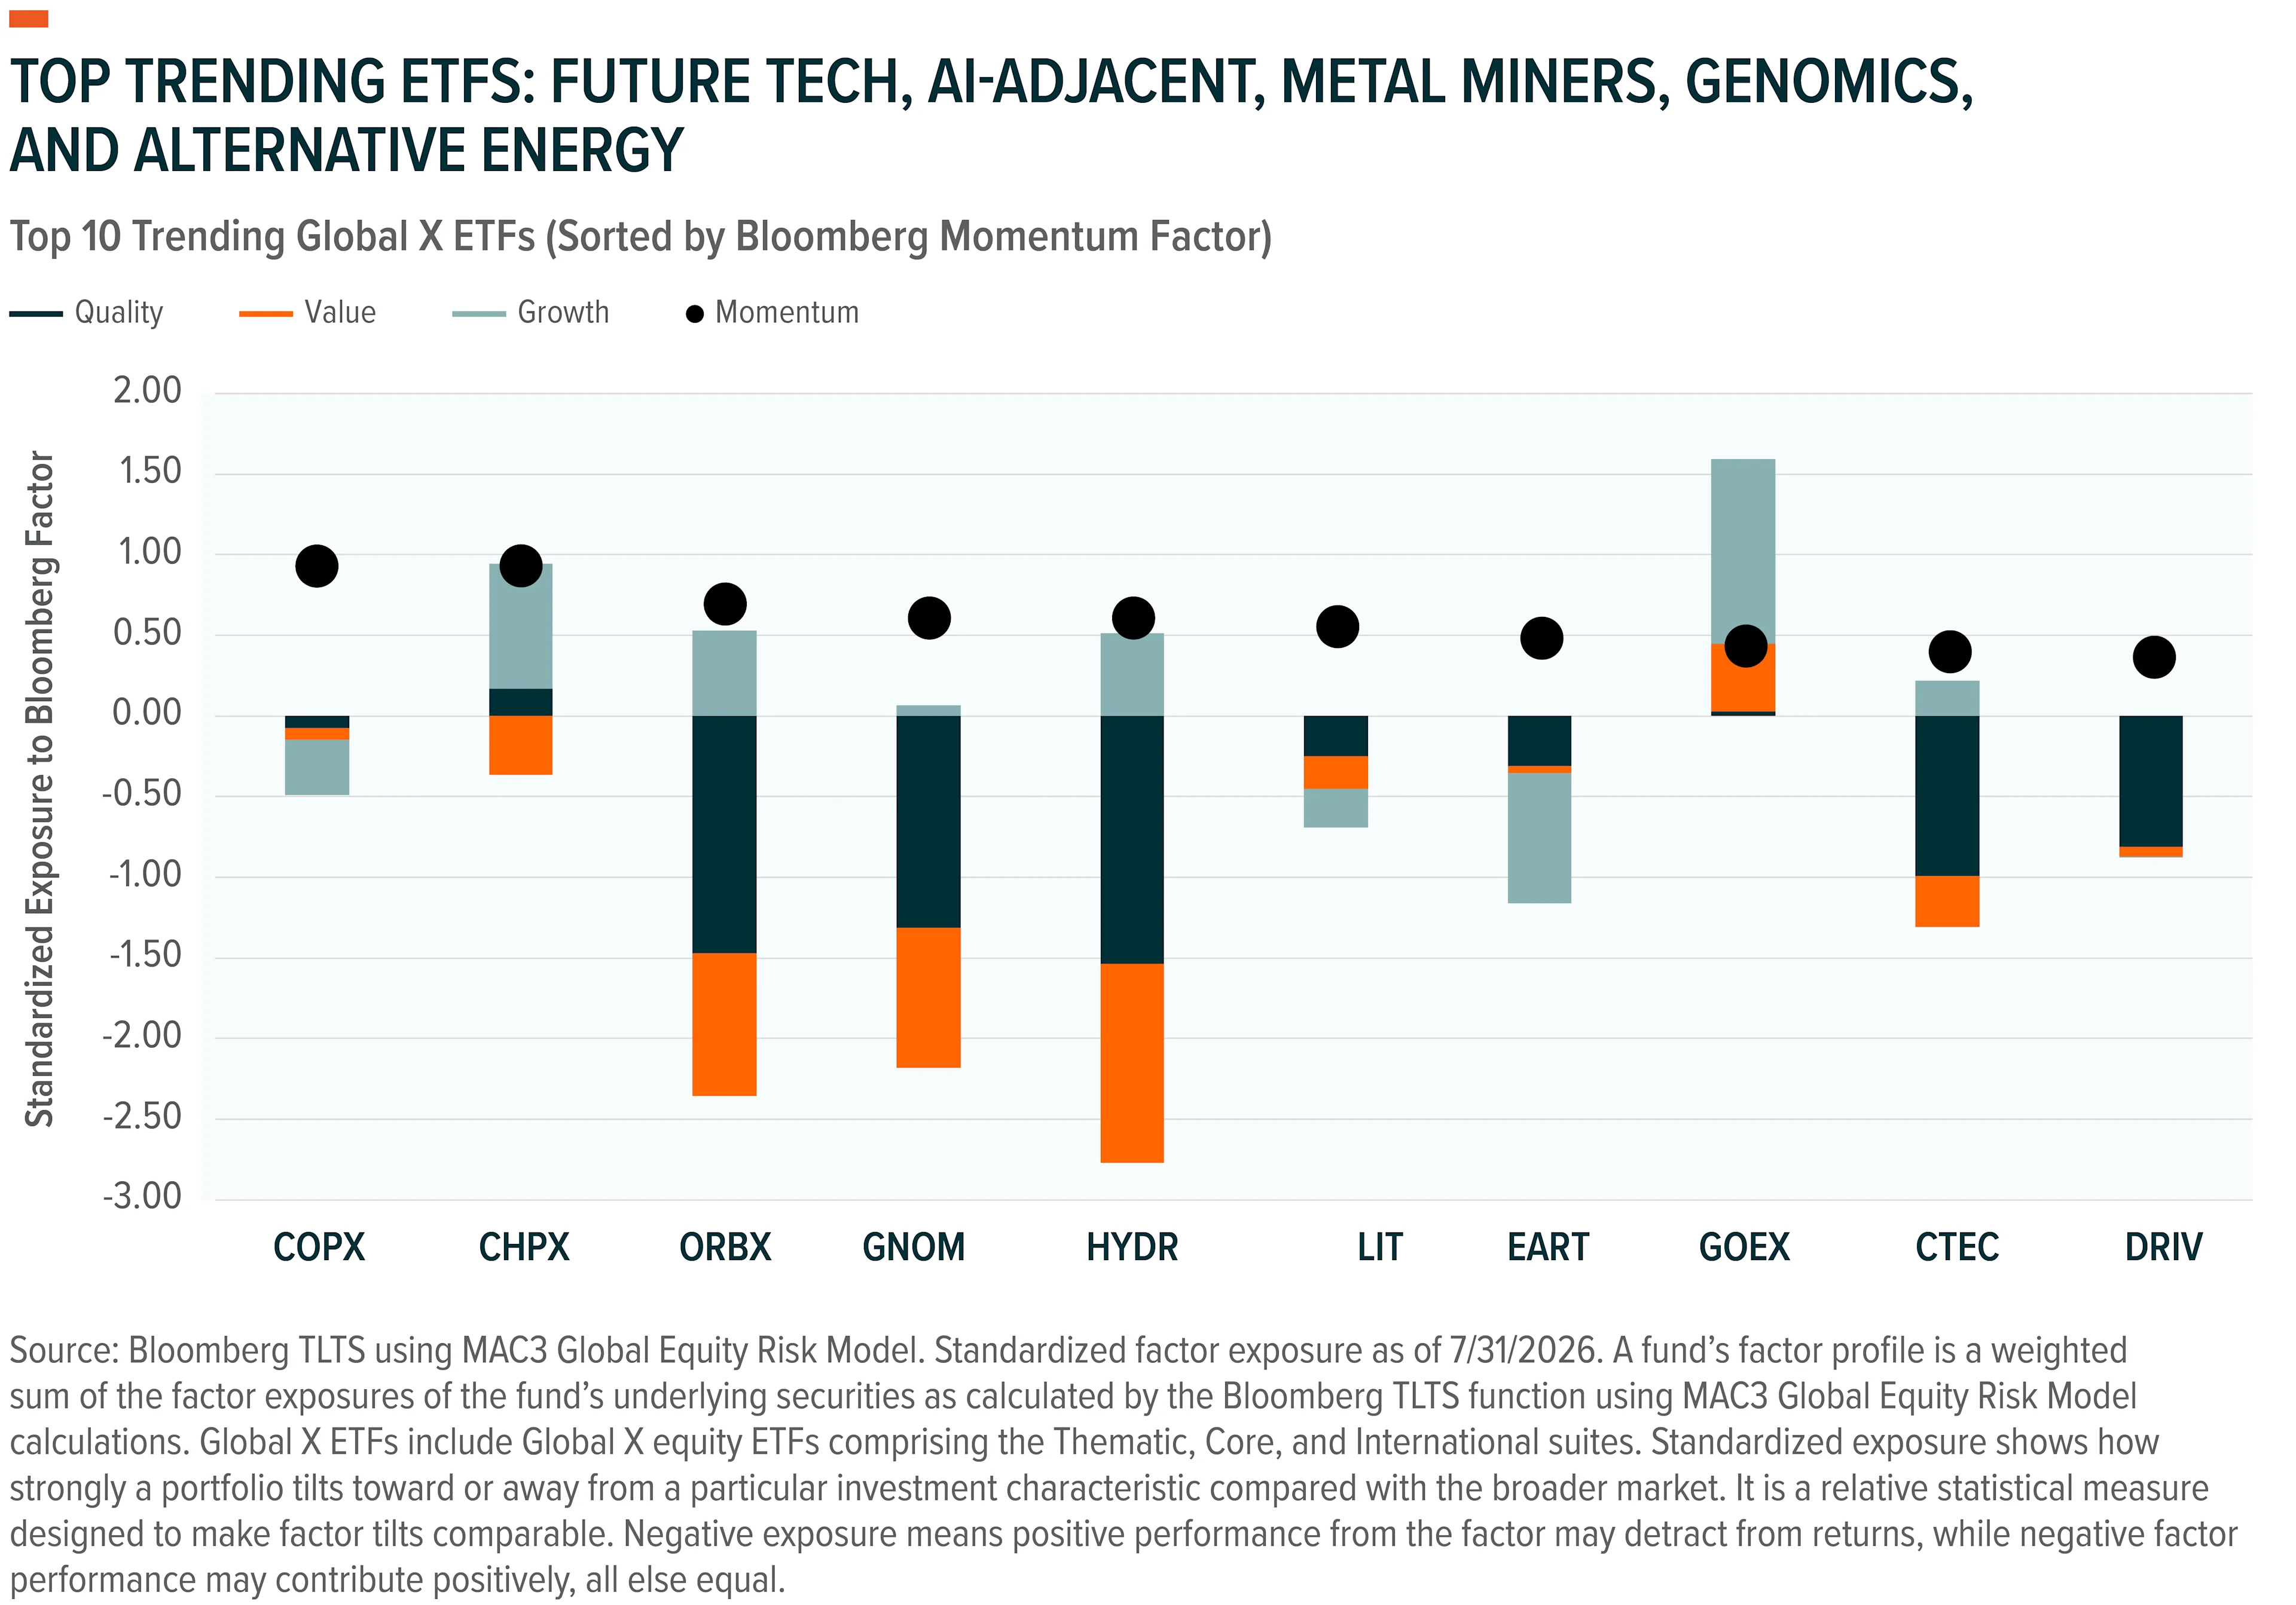
Among the Top Trending Themes, AI-adjacent and future-tech may benefit from positive growth factor exposure; precious metals miners may benefit from both growth and value factor exposures.

As of 7/31/2026, we observe five thematic categories comprising the Top Trending list, as measured by the Bloomberg Momentum Factor. These themes have enjoyed positive pricing trends signaling strong investor demand.

Top Trending Theme in Focus: AI Semiconductors/Quantum Computing

This month we apply a factor lens to the Global X AI Semiconductor & Quantum ETF (CHPX); our most recent writeup on the theme came be found on our website. Here is the summary of the structural thesis:

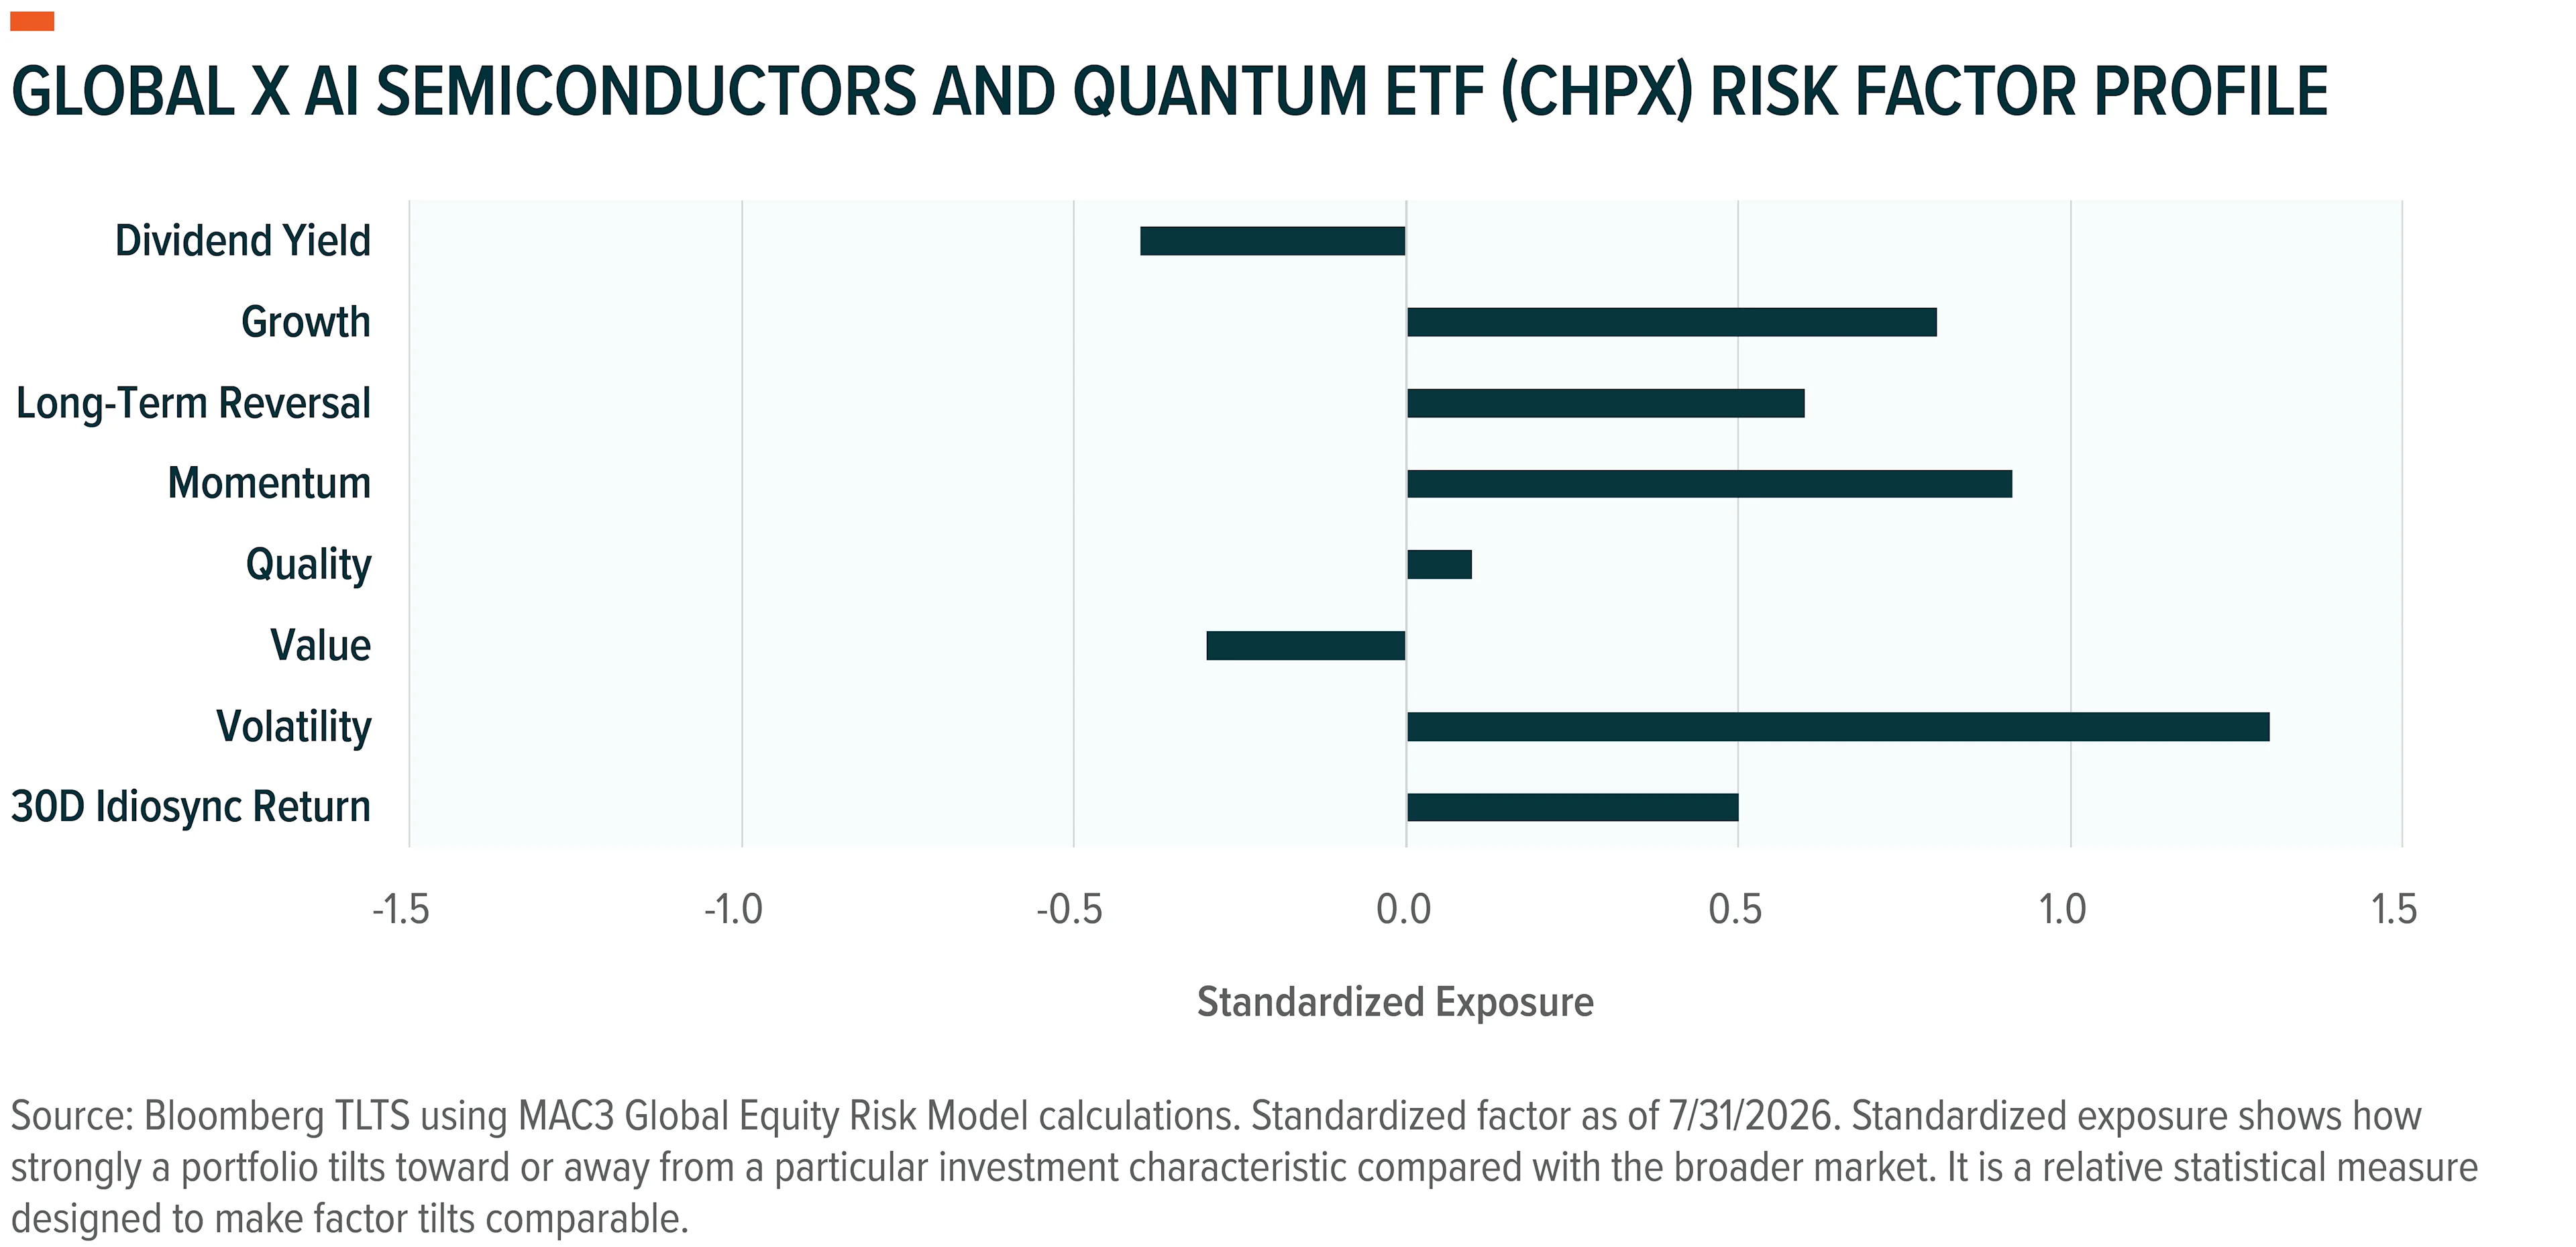
The charts below examine the fund’s current factor exposure and fundamental/pricing trends. Funds with under one year of history (like CHPX) are only shown with current factor exposure.
Thematic Equity Article Image 3 - Aug 2026
Thematic Equity Article Image 4 - Aug 2026
Thematic Equity Article Image 5 - Aug 2026

The performance data quoted represents past performance. Past performance does not guarantee future results. The investment return and principal value of an investment will fluctuate so that an investor’s shares, when sold or redeemed, may be worth more or less than their original cost and current performance may be lower or higher than the performance quoted. Performance current to the most recent month- or quarter-end is available here.
Thematic Equity Article Image 6 - Aug 2026

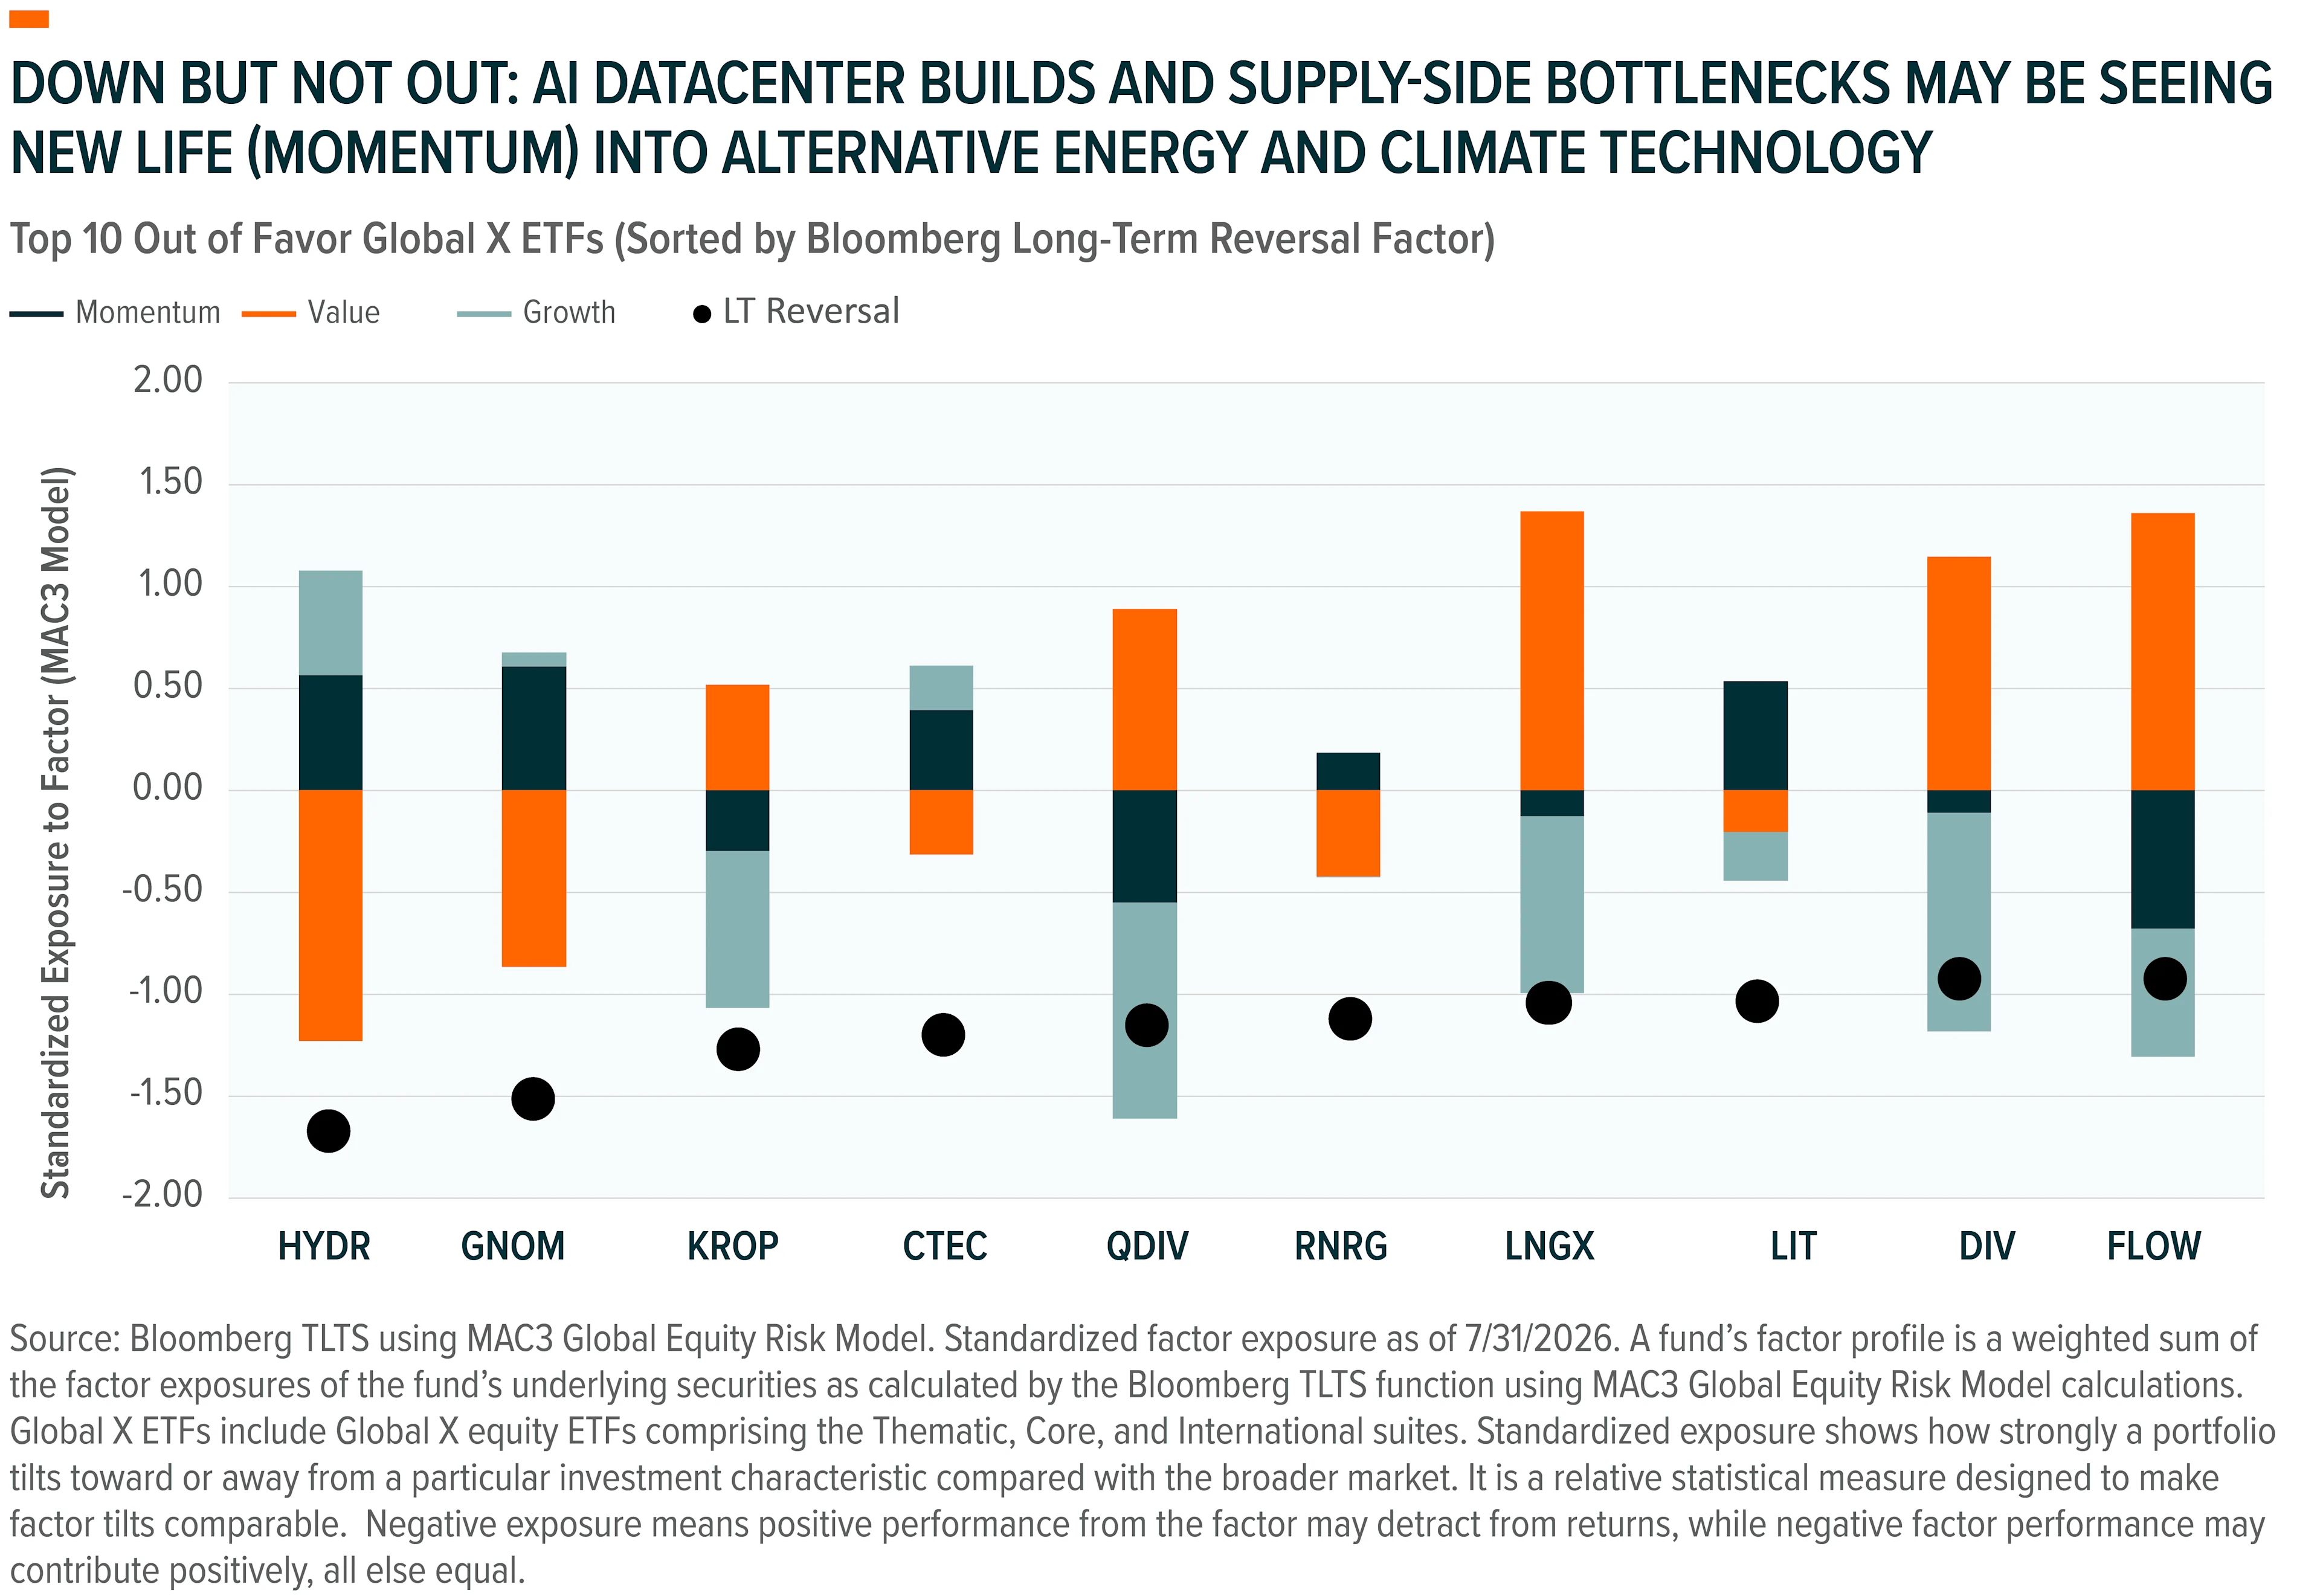
This month’s Top Out-of-Favor list, as measured by the Bloomberg Long-Term Reversal Factor, spans four categories. Many of the underlying securities held in these themes have underperformed over the past five years as investors moved on from the promising growth potential they once exhibited, though several are now showing signs of recovery.

Out-of-Favor Theme in Focus: Global X Hydrogen ETF (HYDR)

In this section, we’re applying a factor lens to the Global X Hydrogen ETF (HYDR). There have been some recent developments summarized here:

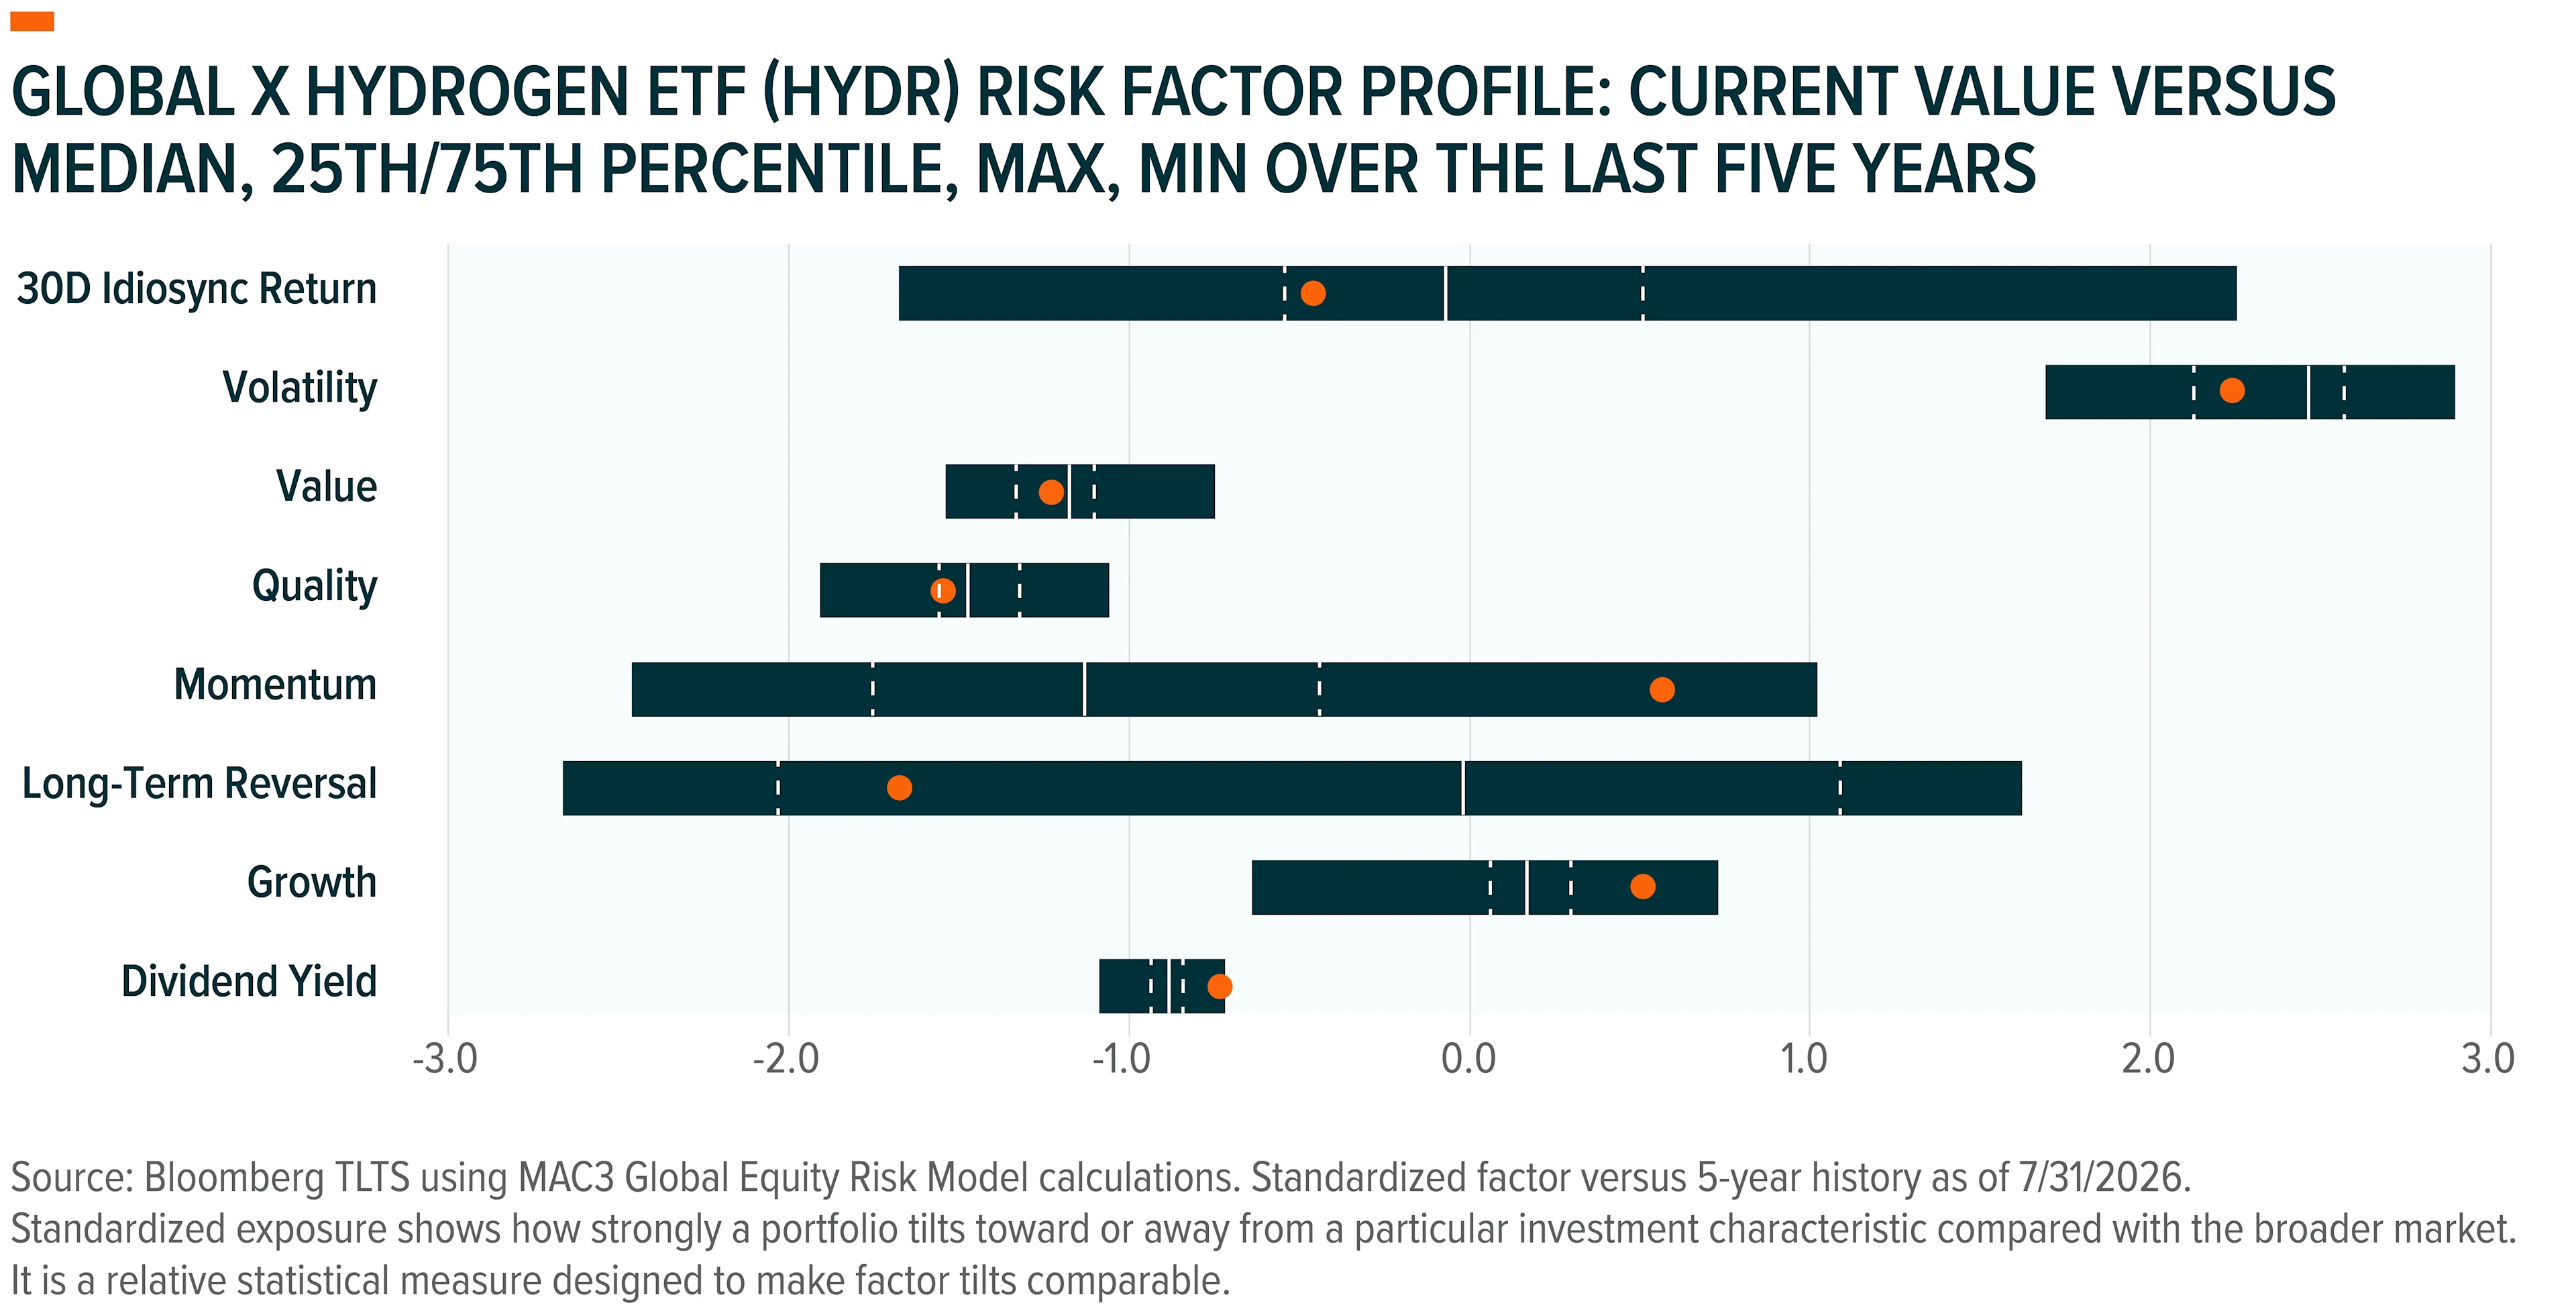
Here we review HYDR’s factor exposure and fundamental / pricing trends:
Thematic Equity Article Image 7 - Aug 2026
Thematic Equity Article Image 8 - Aug 2026
Thematic Equity Article Image 9 - Aug 2026

The performance data quoted represents past performance. Past performance does not guarantee future results. The investment return and principal value of an investment will fluctuate so that an investor’s shares, when sold or redeemed, may be worth more or less than their original cost and current performance may be lower or higher than the performance quoted. Performance current to the most recent month- or quarter-end is available here.

Conclusion

We believe a practical starting point for building a thematic equity portfolio is a core group of funds spanning a broad cross-section of themes, with opportunistic allocations to out-of-favor or underappreciated themes.

Related ETFs

CHPX – Global X AI Semiconductor & Quantum ETF

COPX – Global X Copper Miners ETF

CTEC – Global X ClimateTech ETF

DIV – Global X SuperDividend® U.S. ETF

DRIV – Global X Autonomous & Electric Vehicles ETF

EART – Global X Rare Earth & Critical Materials ETF

FLOW – Global X U.S. Cash Flow Kings 100 ETF

GNOM – Global X Genomics & Biotechnology ETF

GOEX – Global X Gold Explorers ETF

HYDR – Global X Hydrogen ETF

KROP – Global X AgTech & Food Innovation ETF

LIT – Global X Lithium & Battery Tech ETF

ORBX – Global X Space Tech ETF

QDIV – Global X S&P 500® Quality Dividend ETF

RNRG – Global X Renewable Energy Producers ETF

Click the fund name above to view current performance and holdings. Holdings are subject to change. Current and future holdings are subject to risk.

Future Tech,

such as space technologies (ORBX), has enjoyed a halo effect from the SpaceX IPO that occurred in June 2026. The theme has strong growth prospects (positive Growth exposure) but is also expensive (negative Value exposure) and exhibits less financial strength and stability (negative Quality exposure). Recent selling pressures (as indicated by the 14-Day Relative Strength Index (RSI) as of 7/31/2026) may have become overextended after sentiment turned sharply negative from its late-May highs.

Artificial Intelligence (AI)-Adjacent

themes representing computing bottlenecks such as AI semiconductors/quantum (CHPX), along with critical inputs needed for capital spending on infrastructure / advanced devices such as rare earths and critical materials (EART), hydrogen (HYDR), and copper miners (COPX). As with space technologies, some of these themes (CHPX, HYDR) trade at expensive valuations (negative Value exposure), implying that the market is assigning more of the current valuation to future growth. We believe the structural growth narrative remains intact given the strong AI and broader infrastructure capital expenditure cycle. Several of these themes have experienced recent selling pressures (as indicated by the 14-Day RSI through 7/31/2026) and may have become overextended; we discuss semiconductors (CHPX) below in our highlighted Top Trending Theme.

Precious metals mining and/or exploration themes (such as GOEX) may face headwinds if rising inflation expectations prompt a hawkish monetary policy pivot from the Federal Reserve, favoring fiat currency over alternatives like precious metals and digital assets. Still, strong earnings growth and reasonable valuations may help buffer any such shift.

Energy Storage (LIT) and Climate Technology (CTEC) have benefitted from conventional energy supply constraints, as industrial users seek alternatives and producers pursue efficiency and storage incentives; both also appear on the Long-Term Reversal list below as these themes appear to be recovering from long-term underperformance versus the broader market. Autonomous and electric vehicles (DRIV) benefitted similarly from the search for transportation fuel alternatives.

Genomics (GNOM) rounds out the list, with renewed interest driven by AI’s transformative potential for gene therapy, drug discovery, and personalized medicine; it also appears on the Long-Term Reversal list below as this theme appears to be recovering from long-term underperformance versus the broader market.

AI is driving a fundamental restructuring of semiconductor architecture; specialized GPUs, ASICs, high-bandwidth memory, and ultra-fast networking are becoming the indispensable building blocks of next-gen computing. This demand for high-performance computing could influence trillions of dollars in computing infrastructure spending by 2030.6 CHPX tracks the Global X AI Semiconductor & Quantum Index, comprising companies providing computer hardware, infrastructure, and quantum technologies powering the next generation of AI and advanced computing.

Despite the sector’s historically cyclical behavior, AI-driven demand for memory and compute has outpaced supply, pushing it into a secular growth phase.8

As a result, the fund shows strong Growth and Quality factor readings.

However, the segment remains more volatile than the broader universe given its cyclicality, and traded at higher valuations versus its own history (see the index valuation chart below).

CHPX has positive exposure to Growth and Momentum but shows elevated Volatility and is marginally expensive (negative exposure to Value).

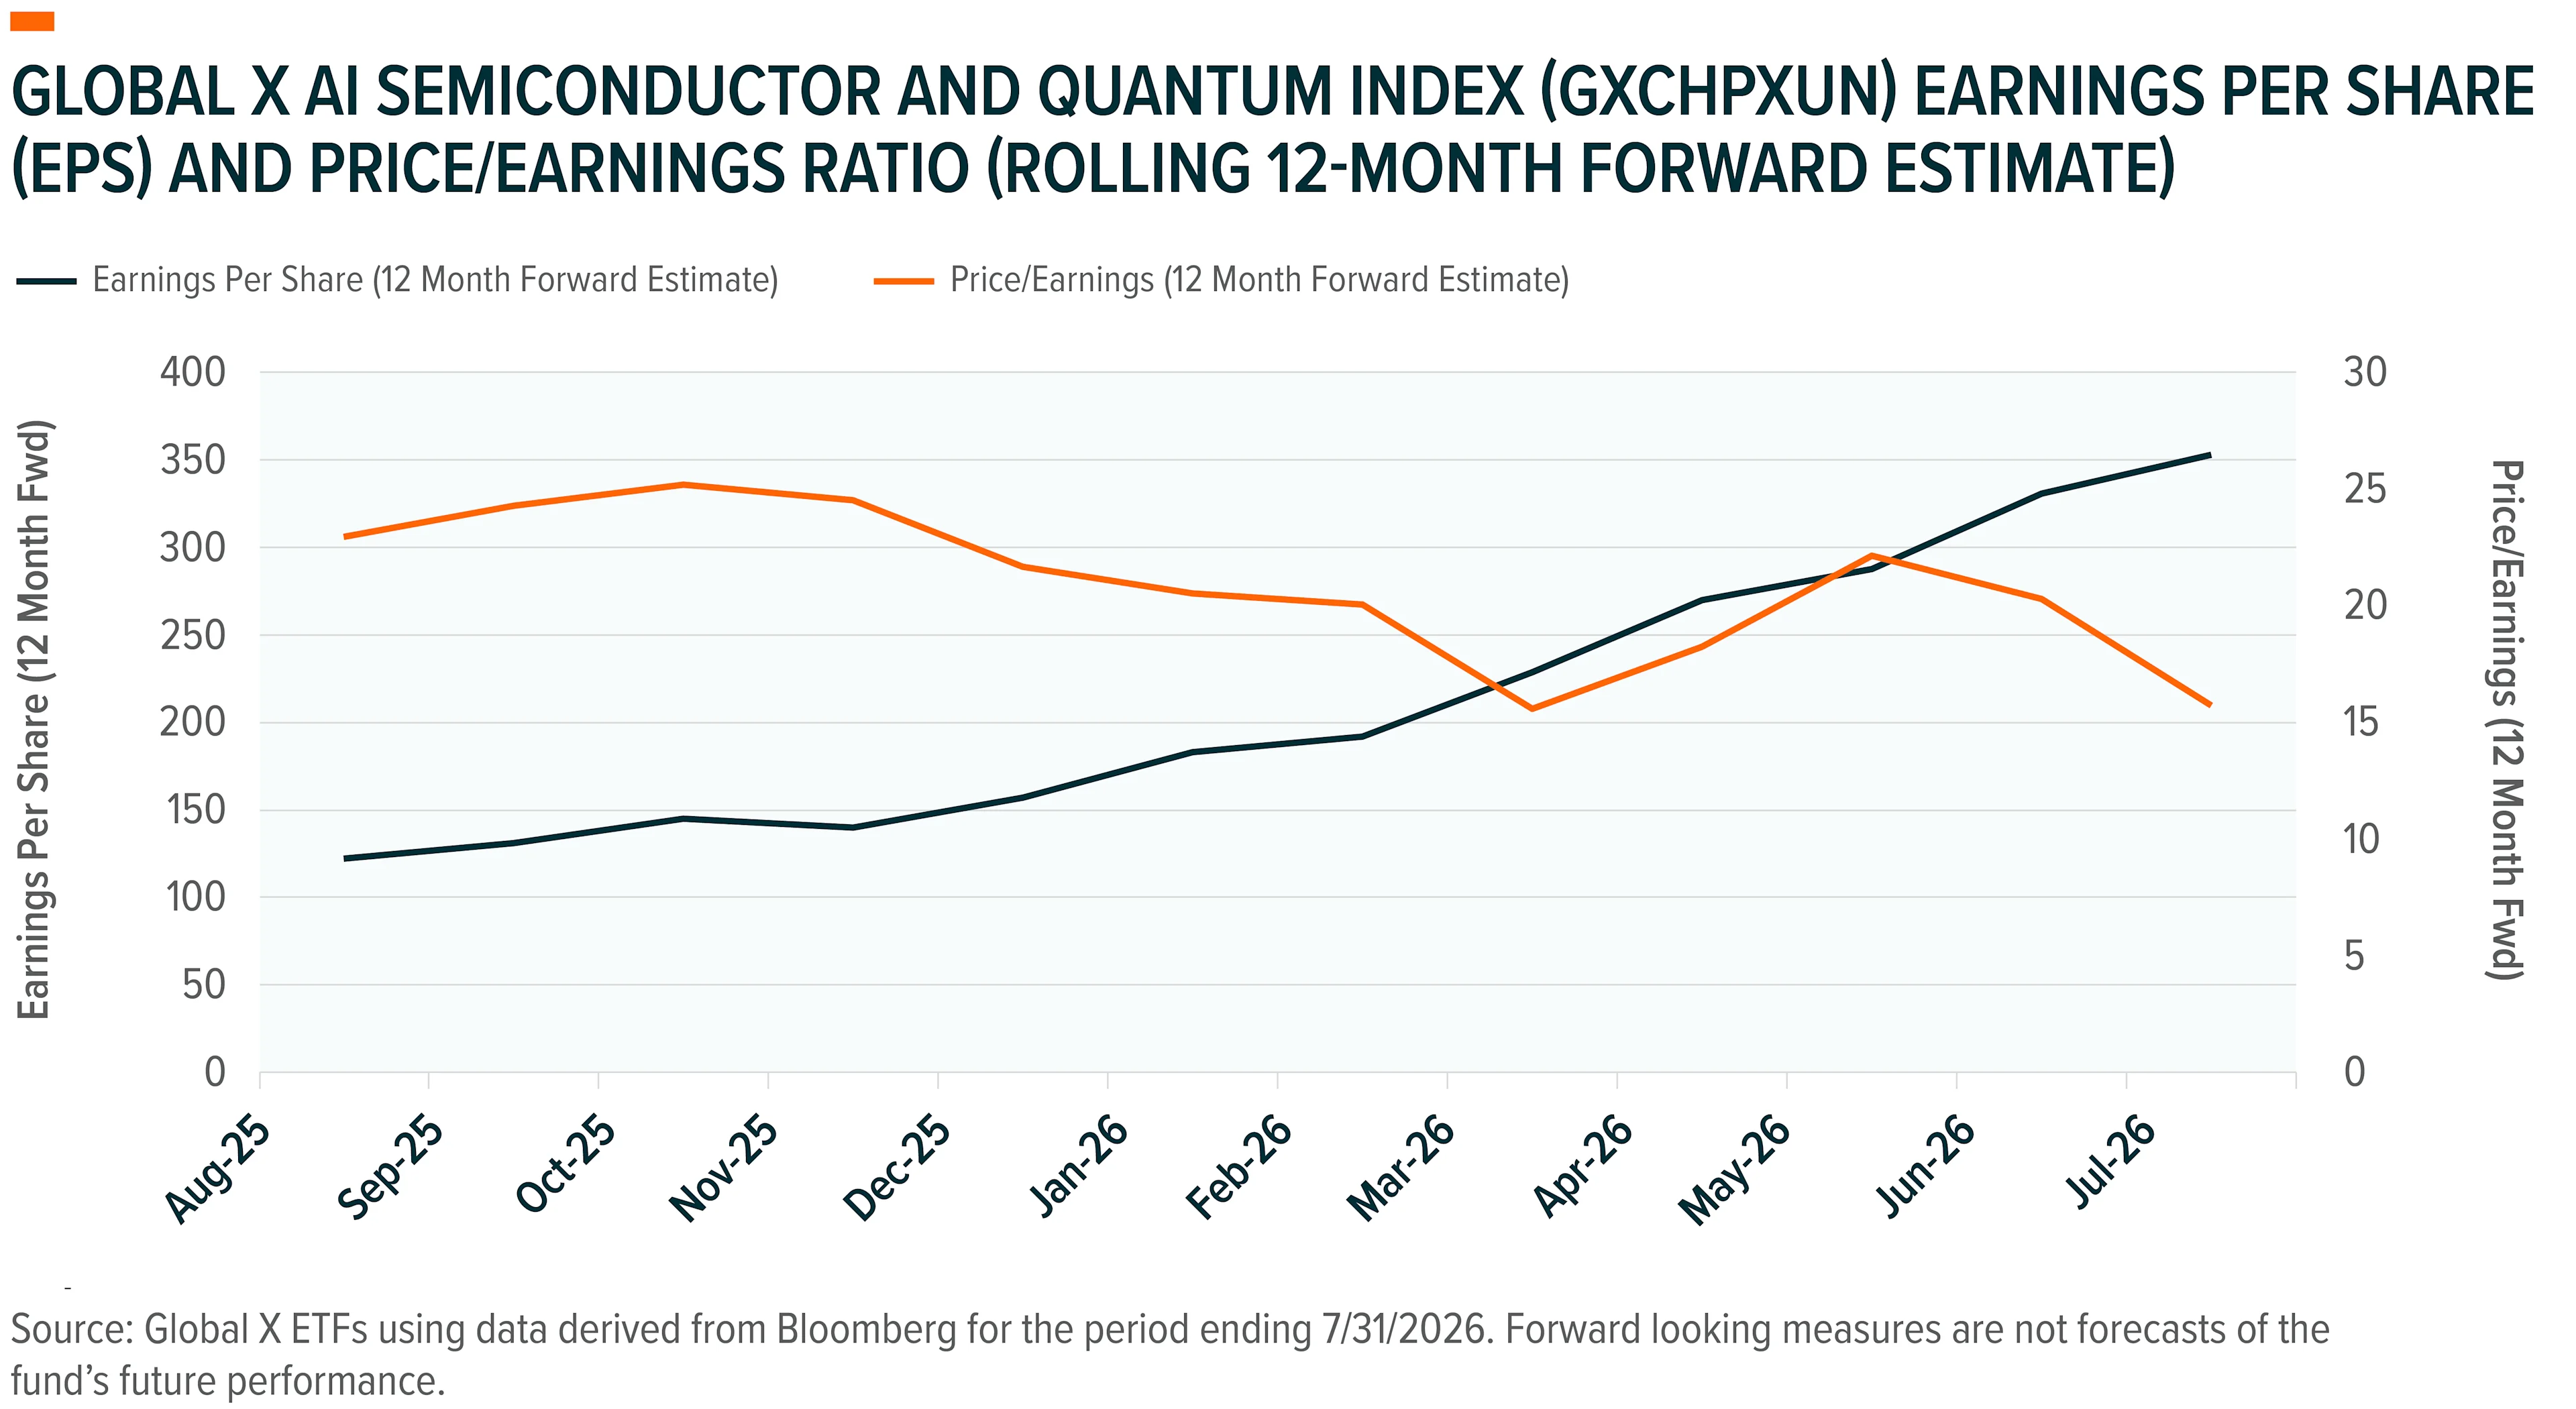
Forward Earnings Per Share (EPS) estimates for the underlying constituents in the Global X AI Semiconductor and Quantum Index (GXCHPXUN), the tracking index for CHPX, have accelerated as analysts keep raising estimates, yet the index traded at a lower Price-to-Earnings (P/E) ratio than a year ago, as earnings have grown faster than stock valuations have risen.

Forward EPS kept climbing as the forward P/E compressed; earnings growth, rather than multiple expansion, has driven higher valuations.

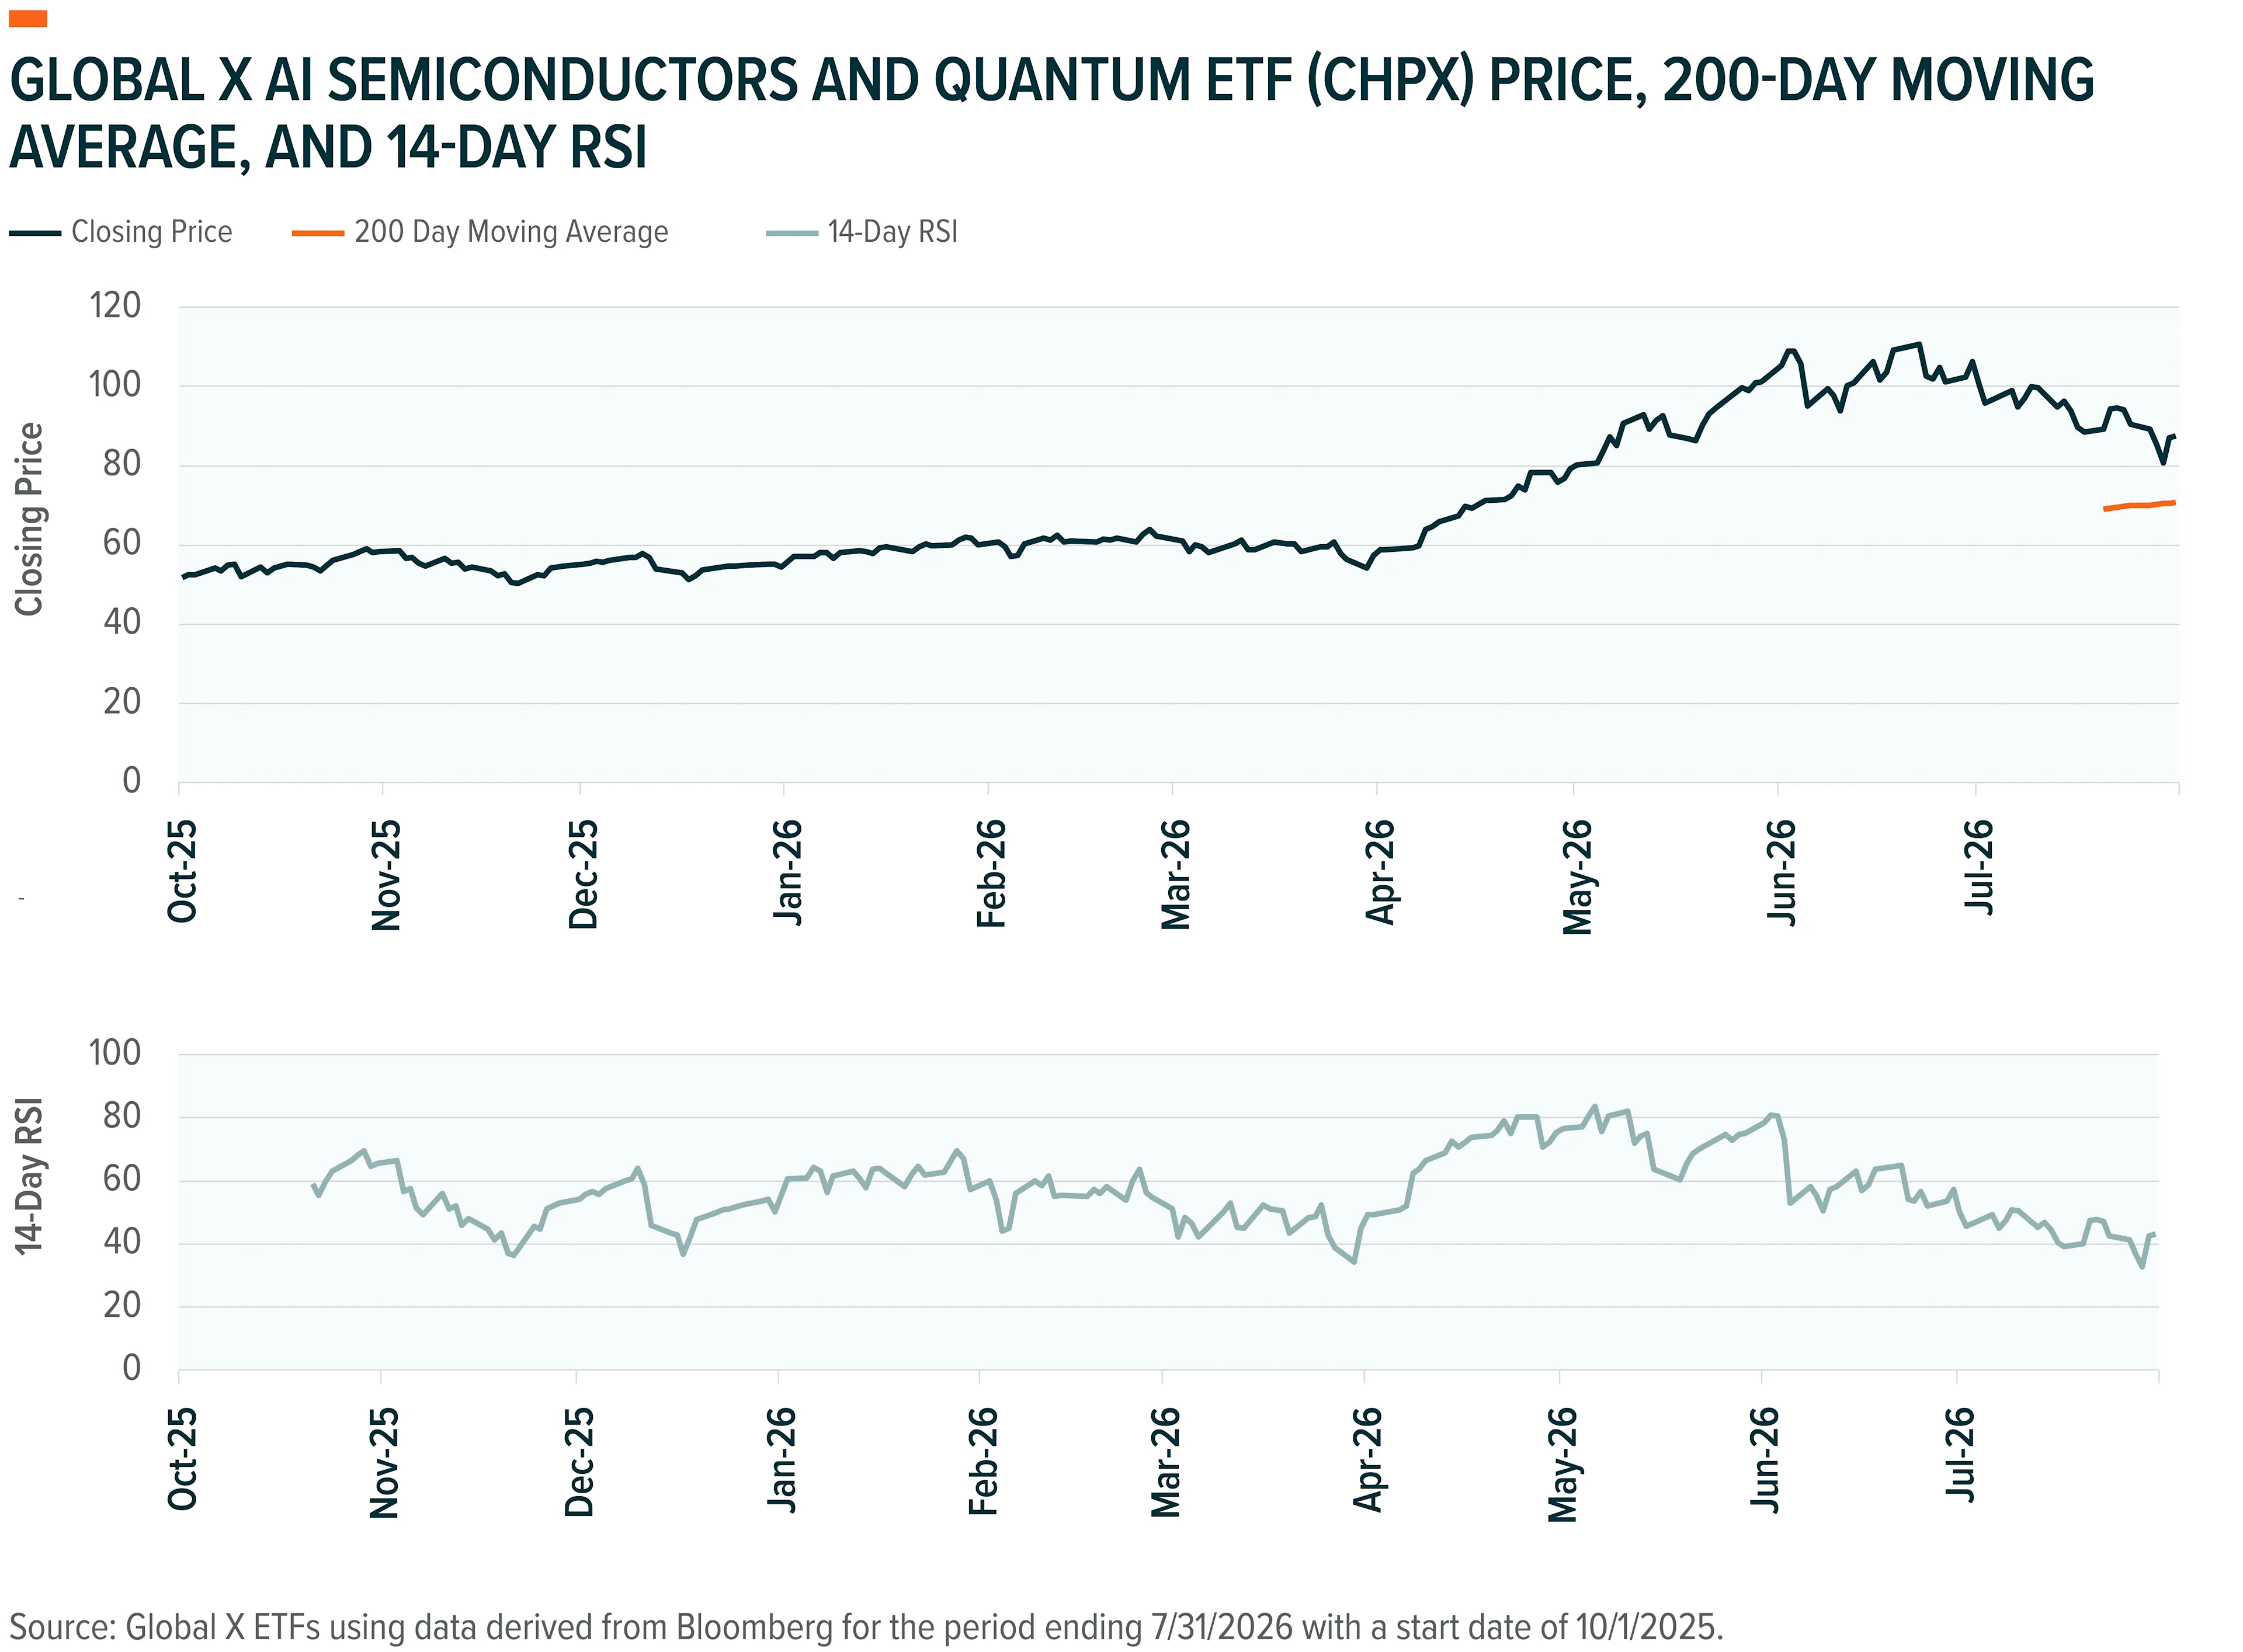
After peaking in mid-May, the fund has experienced recent selling pressures (as indicated by the 14-Day RSI through 7/31/2026) and may have become overextended, even with the current price still well above its 200 moving day average. A shift in risk appetite for the AI buildout could trigger a pullback, but “buy-the-dip” demand may persist if the intermediate positive pricing trends and underlying fundamentals hold.

Overall, the semiconductor/quantum computing theme has benefitted from a combination of positive price trends and strong growth fundamentals.

Price was well above intermediate support (200-Day Moving Average); the RSI pullback suggests consolidation within an intact uptrend.

Most alternative energy and climate technology themes appear to be recovering from long-term underperformance (Long-Term Reversal) based on recent positive Momentum.

Alternative energy inputs/processing, such as Renewable Energy Producers (RNRG), U.S. Natural Gas (LNG), Hydrogen (HYDR), Lithium & Battery Tech (LIT) and climate technology (CTEC), make up the bulk of this month’s out-of-favor list, but have also enjoyed recent price recoveries (Momentum) as the Iran-driven energy squeeze and AI data center buildout renew interest in alternative energy. We profile the hydrogen theme (HYDR) as this month’s Out-of-Favor Theme in Focus.

The genomics and biotechnology theme (GNOM) has long been out of favor but has seen renewed interest as AI advances gene therapy and drug discovery.

Defensive-oriented dividend payers (DIV, QDIV) and free cash flow generators (FLOW) remained out of favor amid strong “risk-on” appetite and an optimistic earnings-growth outlook. A shift away from pro-cyclical leadership would likely be the catalyst for a turnaround, and low valuations (Value) may offer support for patient investors.

Food-innovation and agricultural tech theme (KROP) remained out of favor as earnings normalized from the post-Russia/Ukraine hypergrowth period and tracked lower grain and soybean prices. We view the theme as attractively valued but in need of a growth catalyst.

Global investment in green hydrogen has surpassed $110 billion, as of September 2025, backing over 500 projects already operating, under construction, or past the final investment decision stage.8 Committed production capacity exceeded 6 million tonnes per year, with 1 million already operational. The broader pipeline suggests potential for 9–14 million tonnes by 2030. China leads with $33 billion in committed investments, followed by North America at $23 billion. Europe ranks third at $19 billion, though it is forecast to account for nearly two-thirds of global hydrogen demand by 2030. Amid this growth, about 50 weaker projects have been cancelled from 2023 through 2025 signaling an industry shifting from early enthusiasm toward execution. While some projects may not reach final development stages, the robust pipeline and advancement of more than 500 projects point to the growing opportunities within the hydrogen industry.

Environmental themes like alternative energy and climate technology have fallen out of favor in recent years10 amid declining ESG (Environmental, Social, Governance) mandates, softer EV demand11, and lower baseload needs from unconventional fuels, reflected in HYDR’s negative Long-Term Reversal exposure.

Improved battery storage, surging AI data center power demand, and Iran-conflict-driven conventional fuel shortages are now fueling an alternative energy comeback, reflected in HYDR’s positive Momentum reading.

These fundamental tailwinds have also lifted HYDR’s Growth factor exposure relative to its own history.

Still, the theme trades largely on future prospects, the segment remains unprofitable (see below), with high valuations and weaker financial quality reflected in its Value and Quality factor scores.

HYDR has become less volatile (Volatility, 30-Day Idiosyncratic Return) as Growth improved but remains expensive and more speculative (negative Value, Quality) versus its history

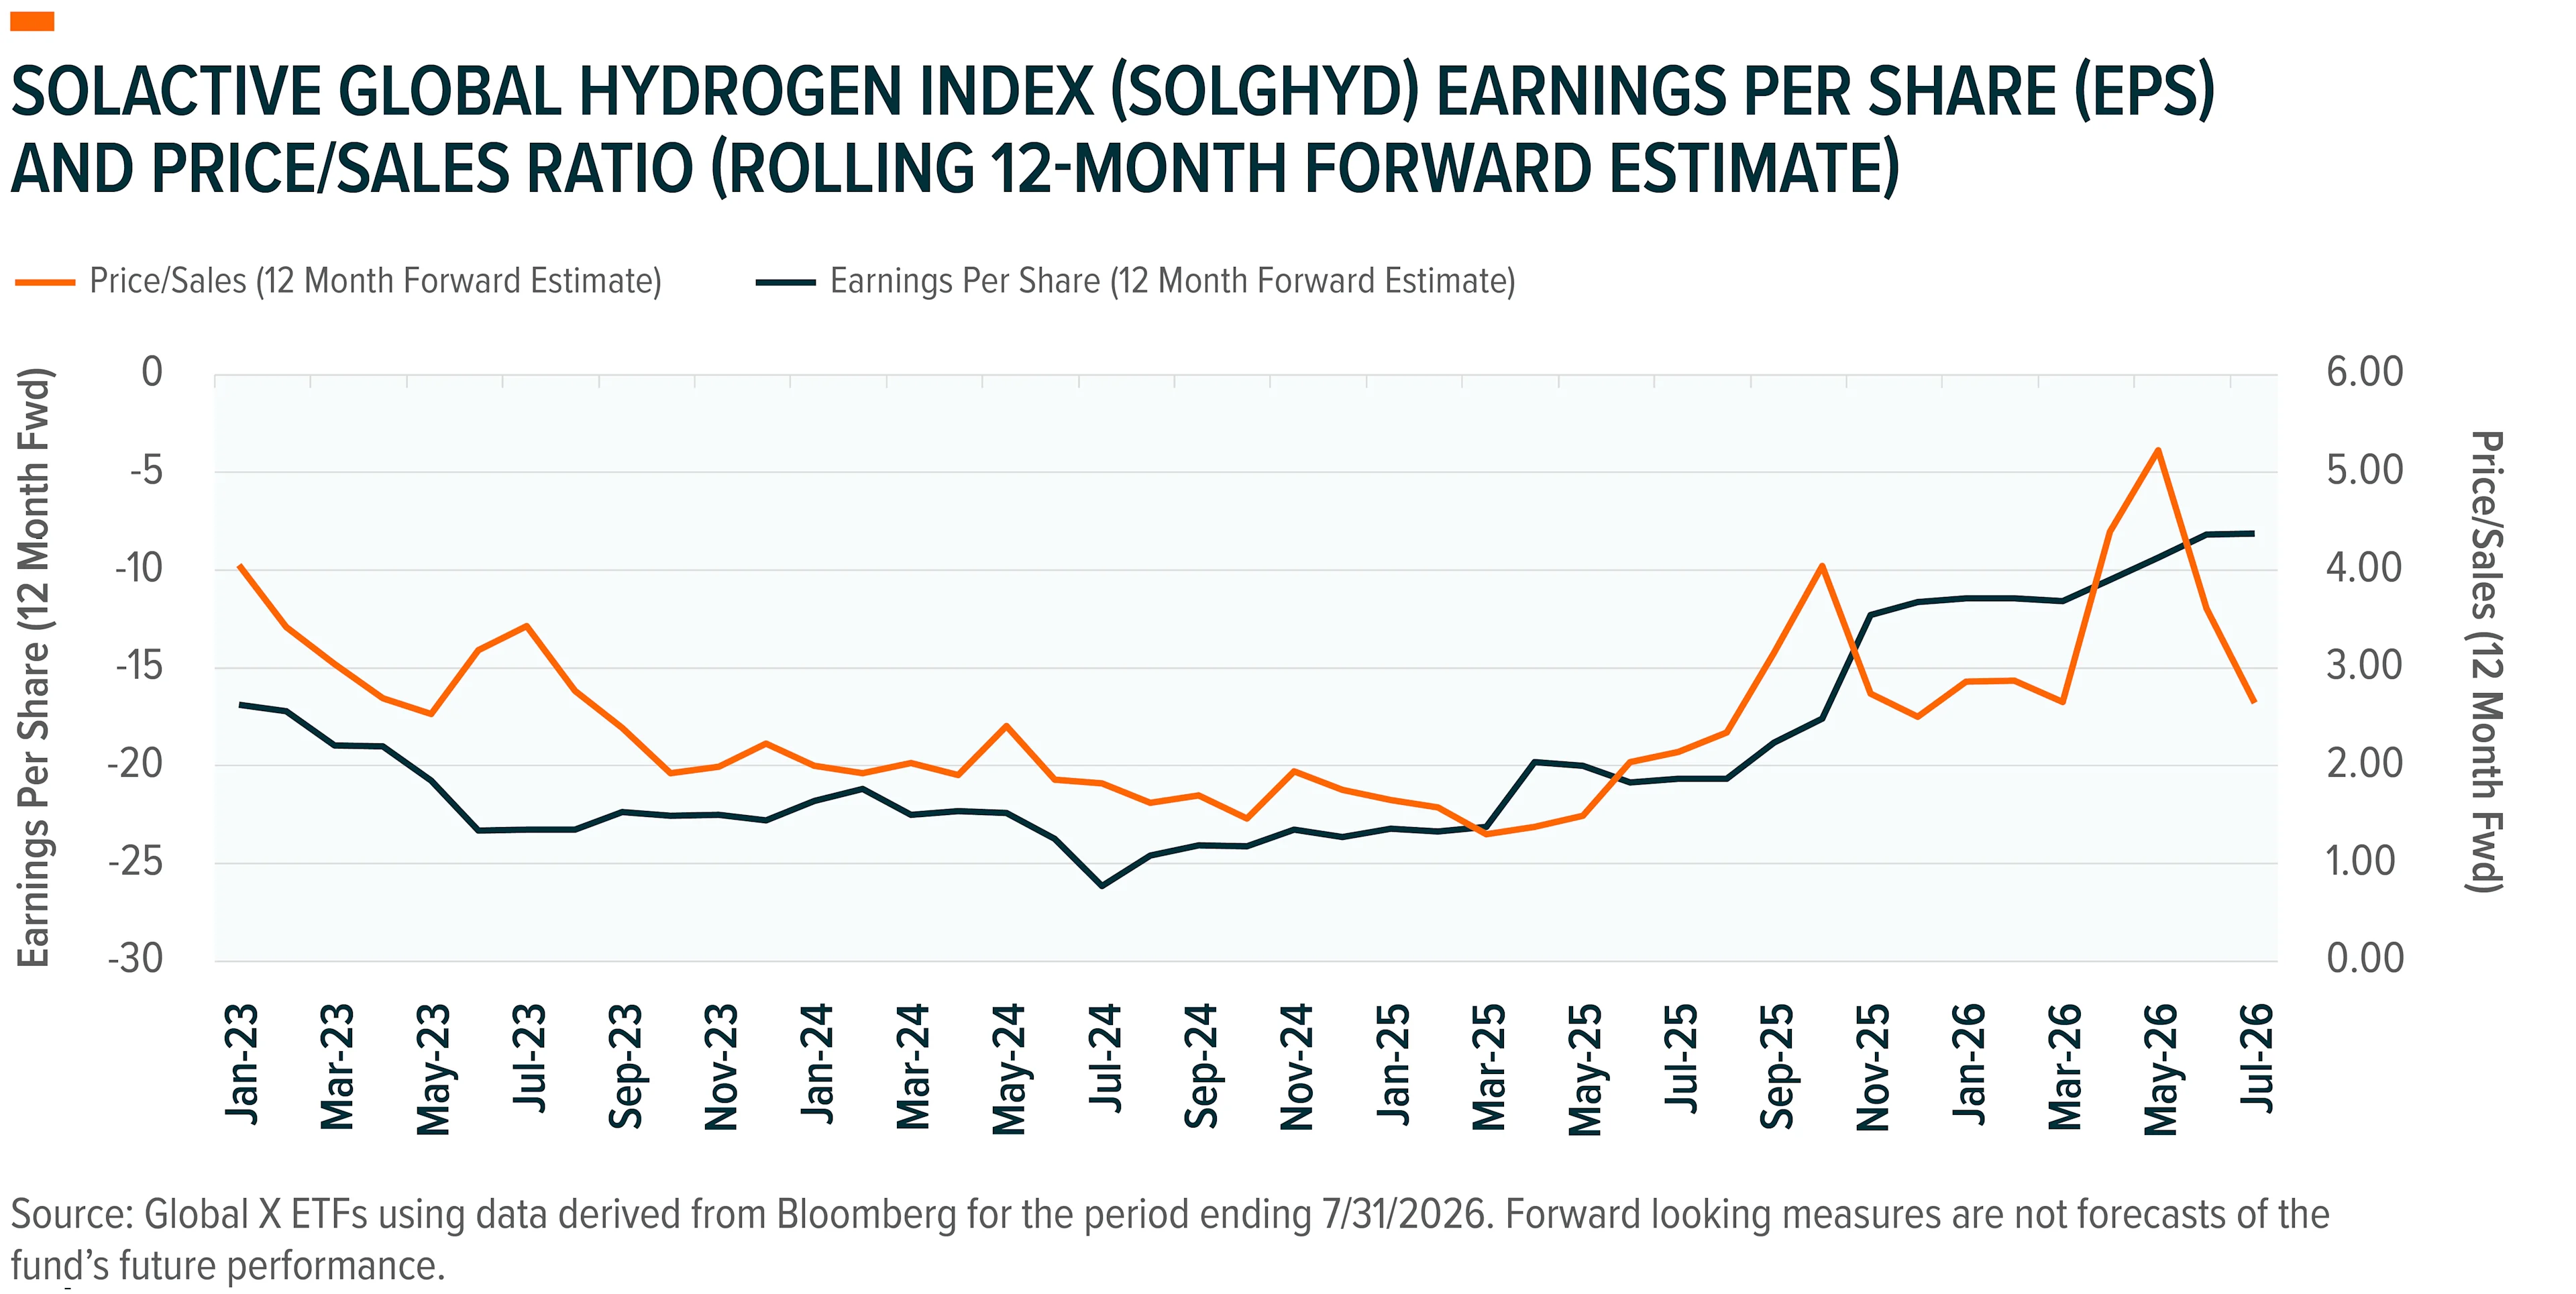
Estimated earnings for the underlying constituents of the Solactive Global Hydrogen Index (the tracking index for HYDR) have improved, though the underlying constituents of the index remained unprofitable. As of 7/31/26, it traded at a higher forward Price/Sales multiple than in recent history, reflecting improving prospects, and room to grow into that valuation should commercial scale economics materialize.

Forward EPS for the Solactive Global Hydrogen Index has improved despite constituents having ongoing operating losses, while the Price/Sales ratio for the index has slowly expanded.

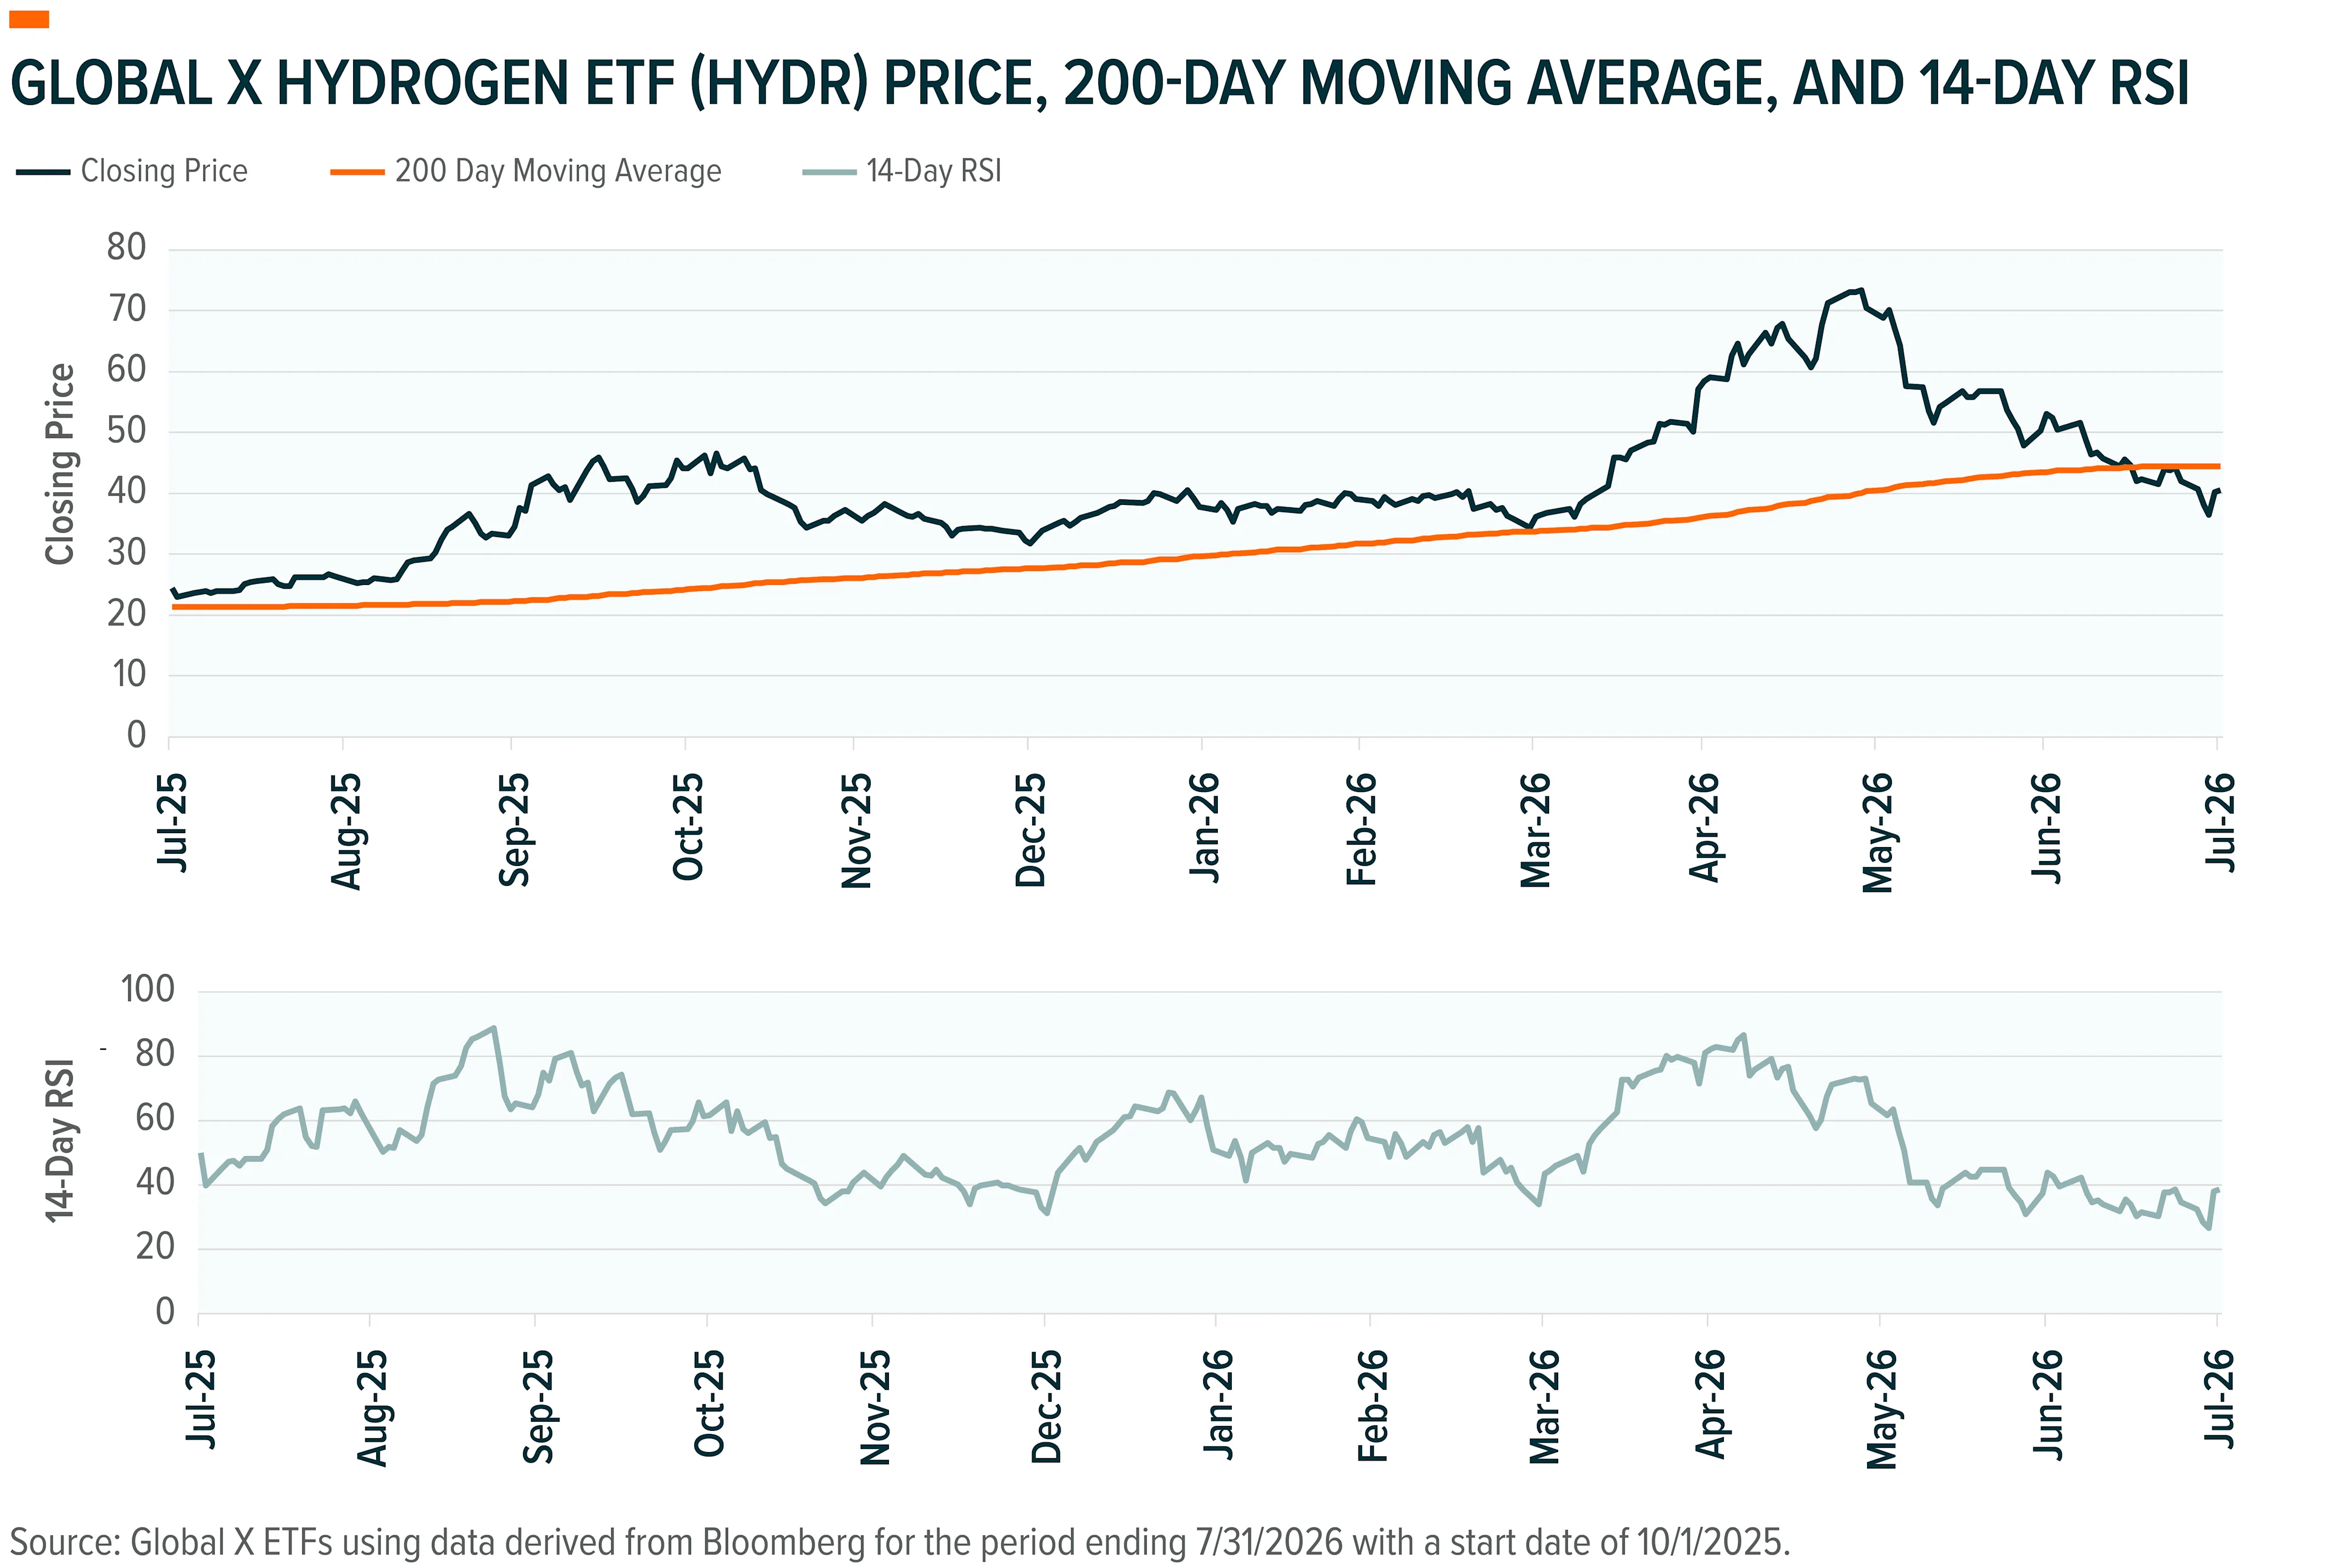
After rallying sharply through May 2026, HYDR has experienced recent selling pressures (as indicated by the 14-Day RSI through 7/31/2026) and may have become overextended. As with other technology-adjacent themes, it remains susceptible to a broader shift in risk appetite or the AI infrastructure narrative.

The hydrogen theme is enjoying an improving investment outlook: HYDR potentially offers high operating leverage to more widespread adoption, may be emerging from a long period of underperformance (as indicated by Long-Term Reversal and recent Momentum for the period ending 7/31/2026), and should benefit from an improving growth outlook over the next decade.

HYDR’s price has mostly trended higher than its 200-day moving average although it broke the trendline in the most recent pullback. The RSI points to oversold conditions.

For themes with positive price trends, consider future tech and AI-adjacent themes (ORBX, CHPX) and critical inputs (COPX, EART, HYDR). Precious metal miners and/or explorers (such as GOEX) remain pressured by inflation and rate uncertainty but could see better entry points if inflation eases. We highlighted CHPX as a Top Trending Theme following July’s tech sell-off.

For out-of-favor themes showing recent recovery, consider alternative energy and environmental technology (HYDR, LIT, RNRG, CTEC) and life sciences (GNOM). Defensive, dividend- and cashflow-focused themes (DIV, QDIV, FLOW) and food innovation/ agriculture tech (KROP) remained out of favor but could turn if sentiment shifts defensive. We highlighted HYDR as a Top Out-of-Favor Theme given its improving growth prospects.

Related articles

1of3
Product ResearchSemiconductorArtificial Intelligence

Memory Is the New Bottleneck in AI Semiconductors

I

Ido Caspi

Mar 23, 20267 min read
Product ResearchArtificial IntelligenceSemiconductor

Artificial Intelligence Opens a Generational Opportunity for Chipmakers

Thought LeadershipThematic GrowthDisruptive Technology

Replenishment Is Extending the Defense Tech Earnings Runway

Product ResearchSemiconductorArtificial Intelligence

Memory Is the New Bottleneck in AI Semiconductors

Related funds
Thematic
CHPXAI Semiconductor & Quantum ETF
Commodities
COPXCopper Miners ETF
Thematic
CTECClimateTech ETF
Explore All ETFs
Footnotes
  1. From the year-to-date (YTD) 2026 low reached on 3/30/2026 through 7/31/2026, the Bloomberg 500 Total Return Index (representing U.S. large caps) returned 18.49%. Source: Bloomberg

  2. “S&P 500 Momentum Continued Its Dominant Run in May,” Ben Hernandez of VettaFi | Advisor Perspectives, 6/5/2026. The S&P 500 Momentum Index outperformed the S&P 500 Index by approximately 16% during the March–May 2026 period, marking the strongest rolling three-month relative performance in the index's history, according to analysis based on S&P Dow Jones Indices data.

  3. For the three month period ending 7/31/2026, the S&P 500 Healthcare Sector Net Total Return (NTR) Index returned 11.89% and the S&P 500 Financials Sector NTR Index returned 9.63%, versus 4.19% for the S&P 500 Total Return Index.

  4. “Momentum Turns Oversold After Sharp Correction,” Christoper Cain, Bloomberg Intelligence, 7/31/2026. The Bloomberg Momentum Long/Short Sector-Neutral factor peaked on 6/22/2026 before dropping 18.95% (through 7/31/2026), producing one of the sharpest short-term reversals in the history of the factor for the period.

  5. “July Ranks in History’s Top Momentum Reversals: Equity insights,” Bloomberg, 7/21/2026.

  6. “Global Semiconductor Market Surges Beyond $1.5T 2026,” World Semiconductor Trade Statistics and Statista Market Insights, 6/2/2026. .

  7. “Midyear Outlook: Global Memory,” Jake Silverman, Bloomberg Intelligence, 6/29/2026

  8. “Global hydrogen industry surpasses USD 110 billion in committed investment as 500+ projects worldwide reach maturity,” Global Hydrogen Compass, 9/8/2025

  9. ”Global ESG Funds Suffer Outflows in Q12025 Amid Intensifying ESG Backlash" Morningstar, 4/30/2025

  10. "For the US EV Market, a More Turbulent Road Lies Ahead", World Resources Institute, April 2026

Glossary
  • Beta (Factor): A measure of the volatility of a security measured as its sensitivity to the broader market. By definition, the equity market has a beta of 1.0. The higher the beta, the riskier the security is considered to be.
  • Bloomberg MAC3 Global Equity Risk Model (Bloomberg MAC3): Bloomberg’s third-generation multi-asset class equity risk model suite covering 14 global and local equity markets. The model provides a full term structure of risk calibrated across six horizons (daily, weekly, monthly, quarterly, annual, and long-term). All horizons share a common factor exposure matrix, with horizon-specific factor covariance matrices and specific risk forecasts. The inception date of the factor calculations used in the Bloomberg MAC3 model is 12/31/1998. Factor exposures measure how strongly a stock or portfolio is tilted toward or away from a specific characteristic, such as value, momentum, or size, based on Bloomberg’s MAC3. Factors are calculated using the following methodology: 1) rank all stocks in each sector from highest to lowest, 2) divide stocks in each sector on a given rebalance date into five quintiles, 3) take all the top quintile stocks across sectors and calculate the average return. The same is done for all bottom quintile stocks across sectors; 4) take the difference of the average returns. This is referred to as Long/Short Sector Neutral.
  • Bloomberg U.S. Equity Universe (Risk Model): The U.S. equity universe used within the MAC3 Global Equity Risk Model, consists of U.S.-domiciled/listed equity securities with sufficient data approximating 6,000 securities.
  • Dividend Yield (Factor): A style factor in the Bloomberg MAC3 model reflecting the dividend yield of a security relative to its peers. Dividend yield is also sometimes regarded as a value signal.
  • Earnings Yield (Factor): A financial ratio that measures the relationship between earnings and market price. It is calculated by dividing the trailing 12-months earnings per share on the underlying asset/index by its market price.
  • Estimate Revisions (Factor): A sentiment factor measuring the direction and magnitude of sell-side analyst revisions to forward earnings estimates. Positive revisions indicate improving earnings expectations and are typically associated with near-term price momentum.
  • Global X AI Semiconductor and Quantum Index: tracks companies across four sub-themes of the AI semiconductor and quantum computing ecosystem: This includes companies involved in the design and manufacturing of semiconductor chips specifically for AI or AI-related applications, the development of AI-focused hardware systems, the provision of critical infrastructure and cooling equipment for AI data centers, and the advancement of quantum computing technologies.
  • Growth (Factor): A fundamental style factor measuring the rate of growth of a company’s earnings, sales, or cash flows relative to peers.
  • 30D Idiosync Ret (Factor): The sum of idiosyncratic (or residual) return over the past 30 days standardized within local markets and sourced directly from the Bloomberg MAC3 Global Risk Model.
  • Leverage (Factor): A composite of financial statement leverage and market leverage standardized within local markets and sourced directly from the Bloomberg MAC3 Global Risk Model. . The factor is typically included within the Quality composite.
  • Liquidity (Factor): A style factor measuring the ease with which a security can be traded.
  • Long-Term Reversal (Factor): A style factor measuring the exponential time-weighted average of log returns over a trailing 48-month period with the most recent 12 months excluded (to remove the effect of momentum). A negative value indicates the security is trading with negative long-term momentum, suggesting potential mean reversion from prolonged underperformance. Bloomberg calculates a value for a fund based on the fund’s holdings as of a specific date, using data for the individual securities. It does not reflect the actual return of the fund, which may have varied. Fund holdings have varied over time, which would affect results. A fund itself may not have history for the entire 48 months.
  • Low Volatility (Factor): A composite factor constructed consisting of Beta and Residual Volatility factors standardized within local markets. The pure factor portfolio is long low volatility stocks and short high volatility stocks.
  • Momentum (Factor): A style factor measuring the exponential time-weighted average of log returns over a trailing 12-month period with the most recent month excluded (to remove the effect of short-term reversal). Bloomberg applies a proprietary time-weighting scheme to account for negative returns associated with short-term reversals. Bloomberg calculates a value for a fund based on the fund’s holdings as of a specific date, using data for the individual securities. It does not reflect the actual return of the fund, which may have varied. Fund holdings have varied over time, which would affect results. A fund itself may not have history for the entire 12 months.
  • Moving Average: calculates the average closing price of a security over a defined lookback period, say 50 days or 200 days, and updates that average each day as new price data comes in. The result is a smoothed line plotted on a price chart that filters out day-to-day volatility and can make the prevailing trend easier to see.
  • Pure Factor Portfolio: A hypothetical portfolio constructed via cross-sectional regression that is dollar-neutral, carries unit exposure to the target style factor, and has zero exposure to all other risk factors. Pure factor portfolios are used to measure the isolated return contribution of each factor and to validate risk model accuracy.
  • Quality (Factor): A composite style factor reflecting the financial health and earnings quality of a company, typically encompassing profitability (Profit factor), balance sheet strength (inverse of Leverage), and earnings stability (inverse of Variability). Securities with higher quality characteristics have historically earned a risk premium in most markets under the Bloomberg MAC3 model.
  • Relative Strength Index (RSI): A momentum oscillator measuring the speed and magnitude of a security’s recent price changes on a scale of 0 to 100. Readings above 70 are generally considered overbought (potential price reversal); readings below 40 are generally considered oversold. The 14-Day RSI is the standard lookback period.
  • Residual Volatility (Factor): A style factor in the Bloomberg MAC3 model where the pure factor portfolio is long high-volatility stocks and short low-volatility stocks. Residual volatility captures the idiosyncratic volatility of a security after removing common factor exposures and is distinct from the overall Volatility or Beta factors.
  • S&P 500 Momentum Index: is based on risk-adjusted price performance over both 6-month and 12-month horizons. The S&P 500 Momentum is designed to measure the performance of securities in the S&P 500 universe that exhibit persistence in their relative performance.
  • Size (Factor): A style factor where the pure factor portfolio is long large-cap stocks and short small-cap stocks.
  • Solactive Global Hydrogen Index: tracks the performance of securities of companies that have business operations in the production or use of hydrogen as a fuel source.
  • Valuation (Factor): A fundamental style factor described by a combination of three price ratios: book-to-price, sales-to-price, and cash-flow-to-price. Securities with higher valuation factor scores are considered cheaper relative to fundamental measures. Note that the Bloomberg MAC3 “Value” factor is distinct from the broader “Earnings Yield” factor, which focuses specifically on earnings-to-price ratio.
  • Value (Factor): A composite of the Valuation and Earnings Yield factors standardized within local markets. Larger scores indicate higher value.
  • Variability (Factor): A style factor often viewed as a negative indicator of investment quality, capturing the variability or inconsistency of a company’s earnings and financial results.
  • Volatility (Factor): In the context of the Bloomberg TLTS factor profile, Volatility reflects the overall price variability of a security or fund relative to its peers, encompassing both systematic (beta-related) and idiosyncratic sources of risk. A high Volatility factor score indicates the fund’s constituents exhibit above-average price fluctuations.

AI’s rapid expansion is shifting the semiconductor bottleneck from compute to memory, positioning high-bandwidth memory leaders to benefit.

AI’s rapid expansion is shifting the semiconductor bottleneck from compute to memory, positioning high-bandwidth memory leaders to benefit.

Artificial intelligence may be revolutionary, but it’s not possible without specialized hardware, creating a large potential opportunity for chipmakers.

T

Tejas Dessai

Jun 23, 20236 min read

Depleted stockpiles are accelerating procurement, adding to defense tech earnings tailwinds from broader defense modernization.

T

Tejas Dessai

Sep 1, 20267 min read
I

Ido Caspi

Mar 23, 20267 min read
Product ResearchArtificial IntelligenceSemiconductor

Artificial Intelligence Opens a Generational Opportunity for Chipmakers

Artificial intelligence may be revolutionary, but it’s not possible without specialized hardware, creating a large potential opportunity for chipmakers.

T

Tejas Dessai

Jun 23, 20236 min read
Thought LeadershipThematic GrowthDisruptive Technology

Replenishment Is Extending the Defense Tech Earnings Runway

Depleted stockpiles are accelerating procurement, adding to defense tech earnings tailwinds from broader defense modernization.

T

Tejas Dessai

Sep 1, 20267 min read