Global economic slowdown risks linger, but we expect the oil market to tighten in the coming quarters due to renewed supply risks and increased demand from China’s reopening. In our view, the shifts in the energy markets last year have the U.S. oil and gas industry well positioned to benefit from these supply and demand dynamics. A result of the growth in U.S. oil and gas production is an increase in demand for midstream pipelines, storage facilities, and processing plants, a trend that can continue in 2023. Despite midstream’s positive performance in recent years, we believe the sector still offers attractive fundamentals.
Key Takeaways
Even after a prolonged upswing, we believe investors may find value in midstream companies due to their high distribution yields, cheap valuations, diversification potential, and inflation pass-through capabilities.
Global catalysts such as increasing economic activity in China can provide support to energy demand while geopolitics keep supply tight.
We believe the oil and gas markets’ shift in the aftermath of Russia’s invasion of Ukraine, has U.S. energy production well positioned this year in a tight supply environment.
Positive Fundamentals for U.S. Midstream
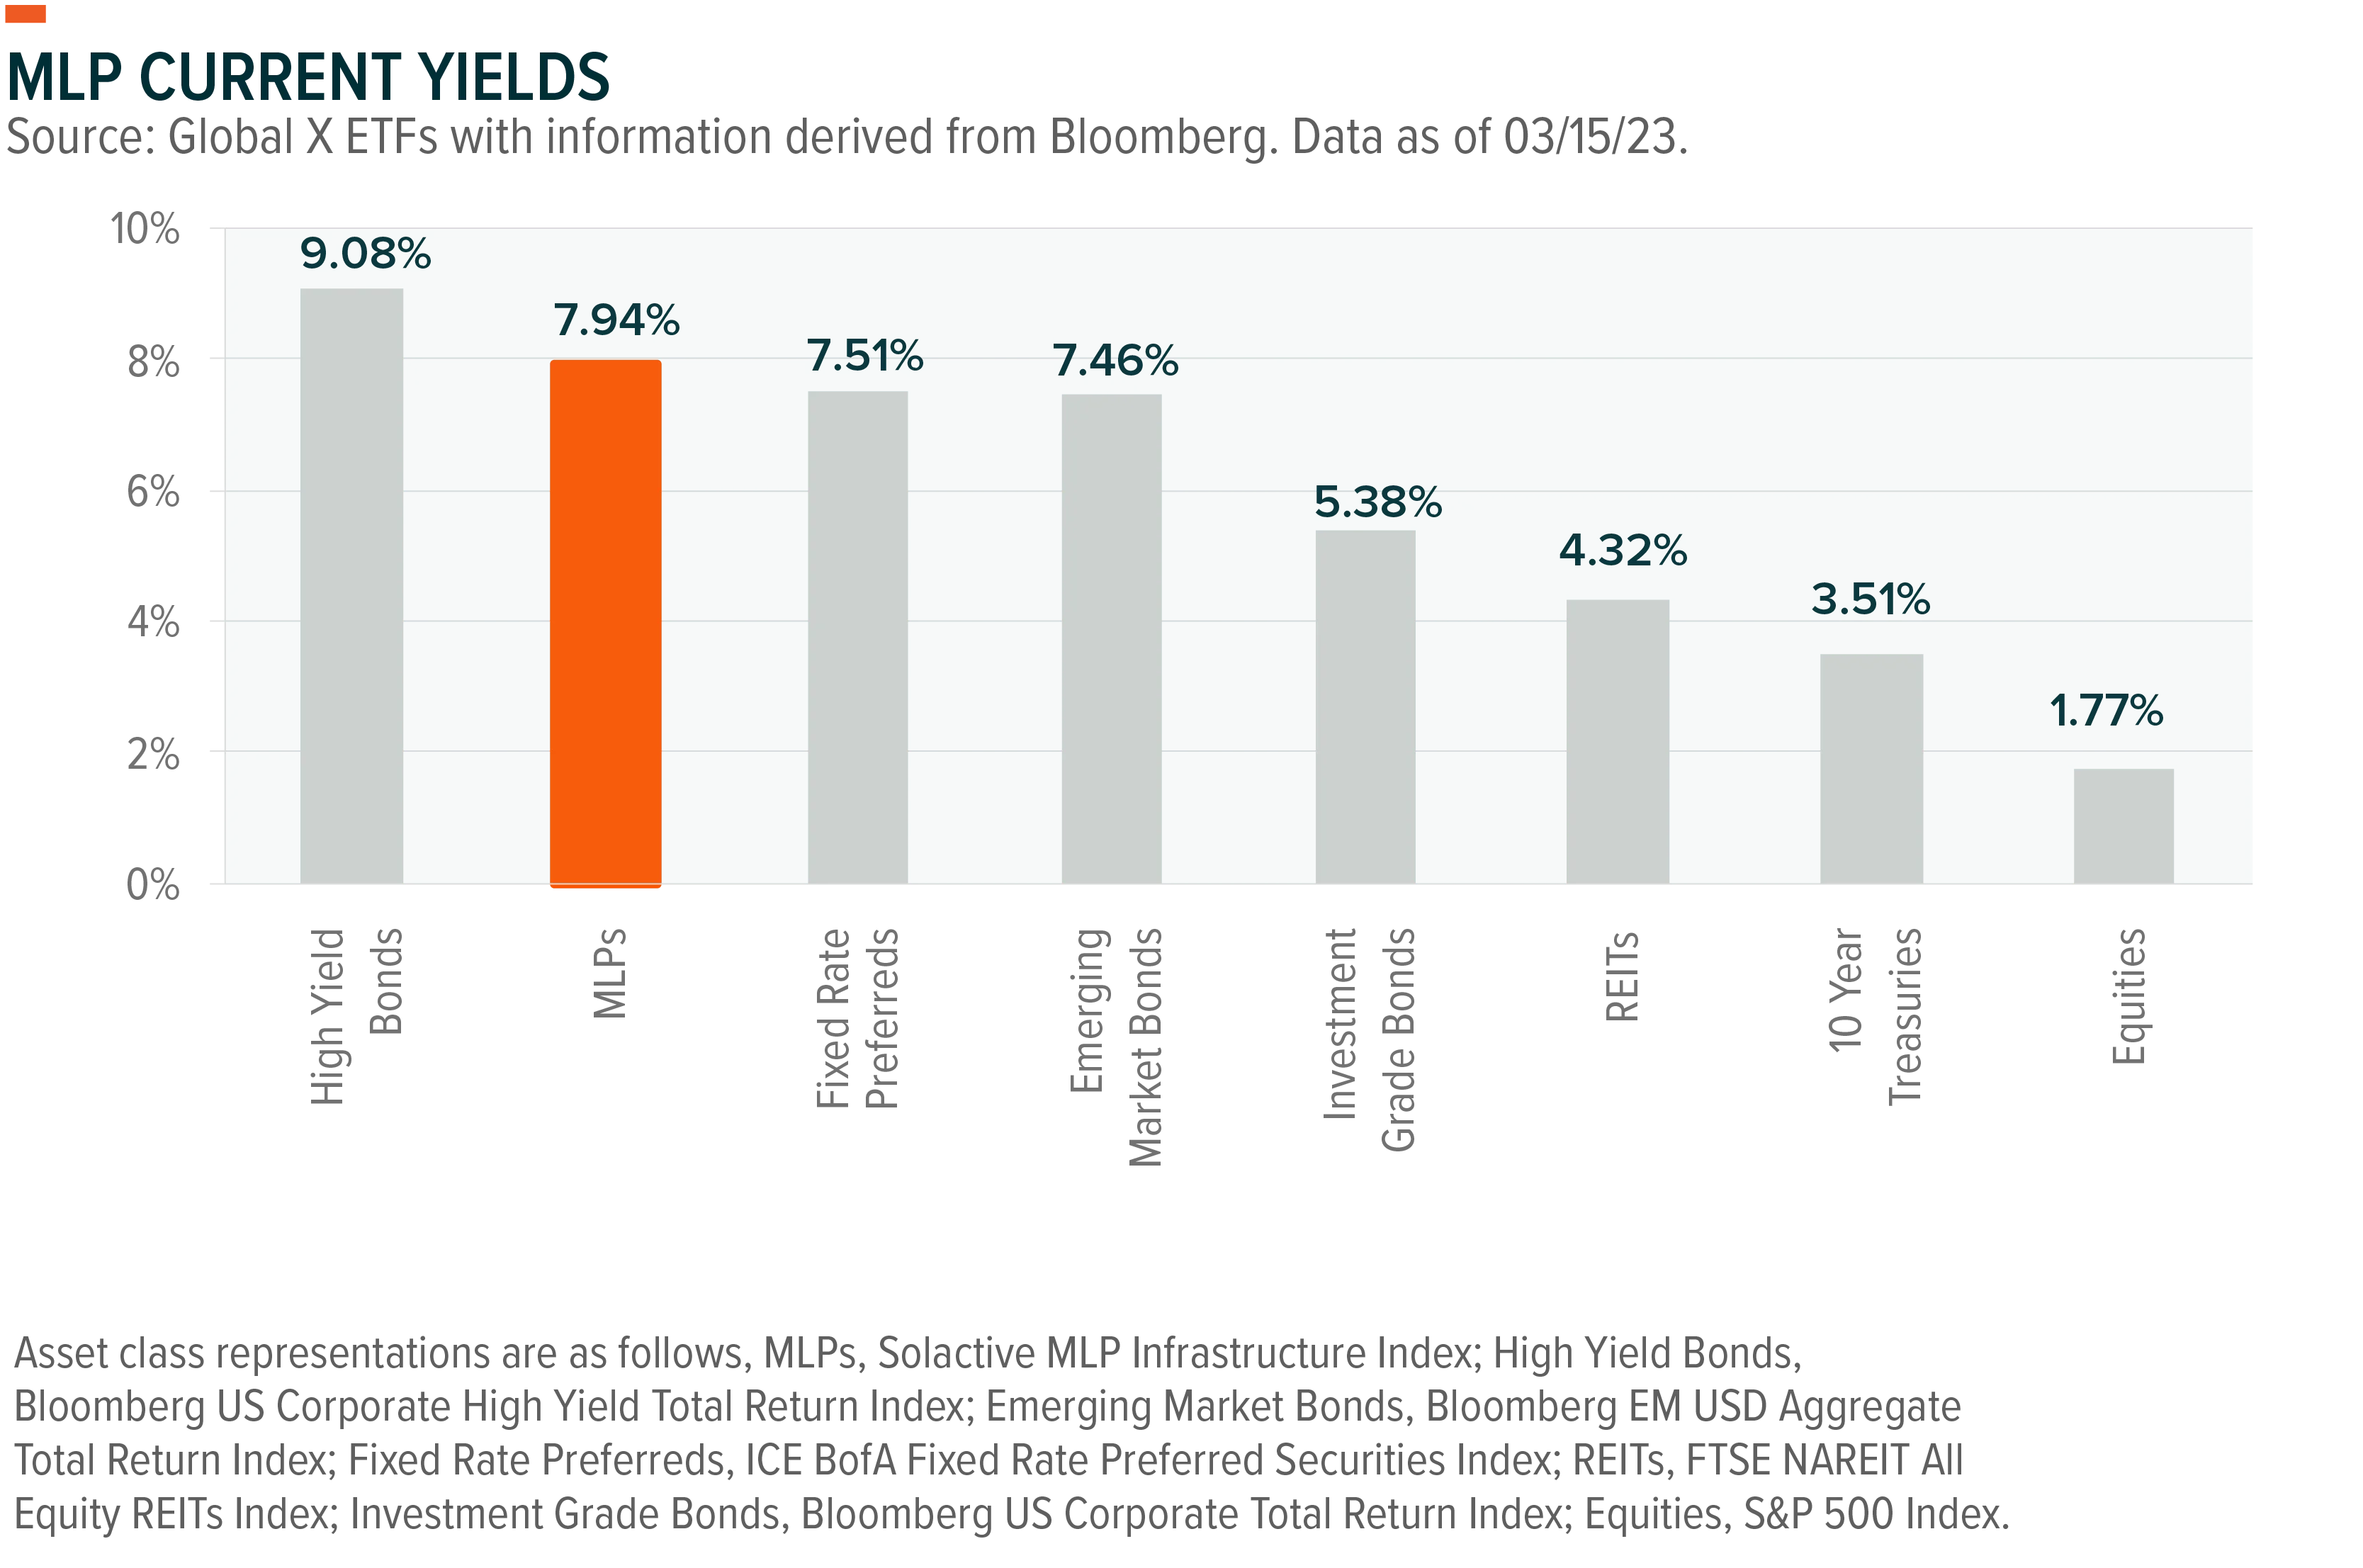
Demand for midstream pipelines, storage facilities, and processing plants is high compared to historical levels, given the recent ramp up in U.S. shale oil and gas production.1 Therefore, while midstream’s multiyear rally2 and the potential perception of a market saturation is a consideration, we believe that the sector can still present compelling opportunities for investors due to strong fundamentals. First, midstream pipelines currently offer higher yields (7.94%) compared to other sectors, which can be attractive to income-seeking investors.3
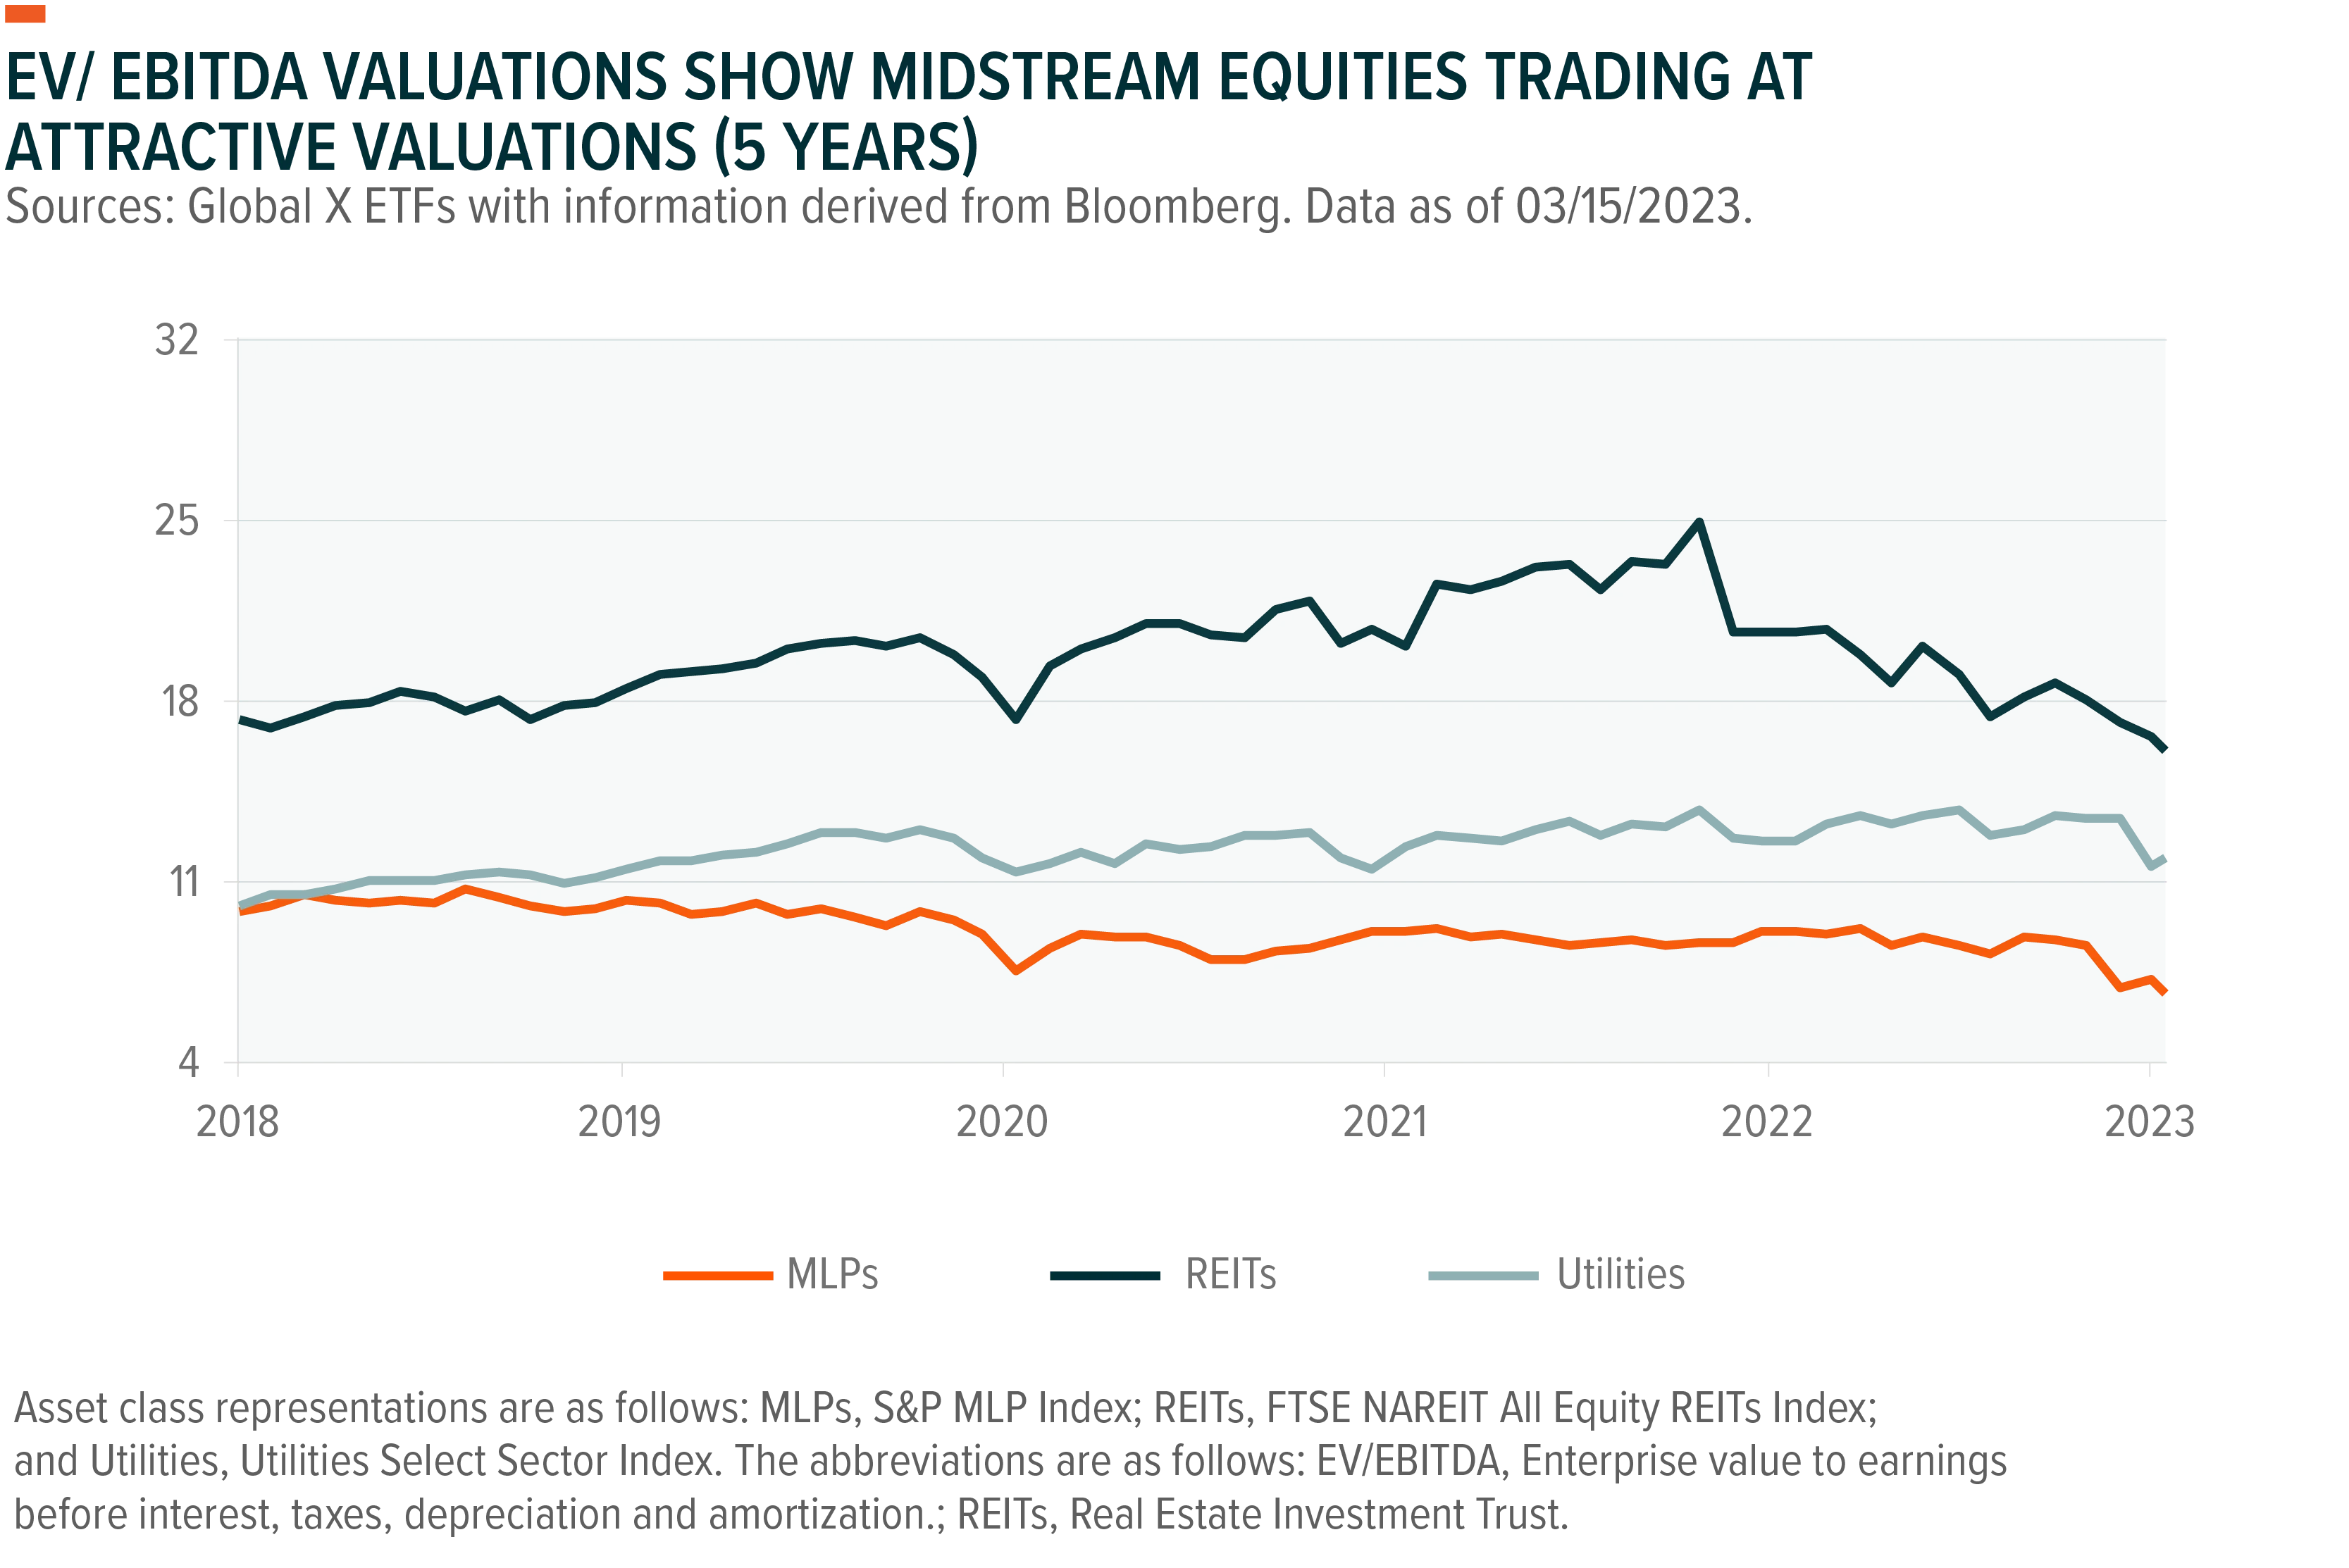
Second, MLPs appear attractively valued when comparing EV/EBITDA to other high yield equity sectors like REITs and Utilities. MLPS show appealing valuations even compared to their own historical estimated forward earnings per share levels. For example, as of the beginning of March, Williams Cos stock traded at a lower 16.8x estimated forward earnings per share vs 20.6x for 2-year historical average while TC Energy Corp traded at a lower 13x estimated forward earnings per share vs 14.6x for 2-year historical average. On average, Midstream Equities traded at a lower 11.8x estimated forward earnings per share vs 17.1x for 2-year historical average.4
Third, midstream pipelines can provide diversification benefits which can help investors manage risk in uncertain economic and market environments while potentially enhancing returns over the long term. More broadly, the Energy sector is expected to continue to attract investor attention because of the current uncertainties in the equity markets due to the global slowdown concerns. Recently, strong economic data prompted hawkish statements from US Federal Reserve (Fed) chair Jerome Powell, which led the markets to anticipate that US interest rates would remain higher for a longer period of time.
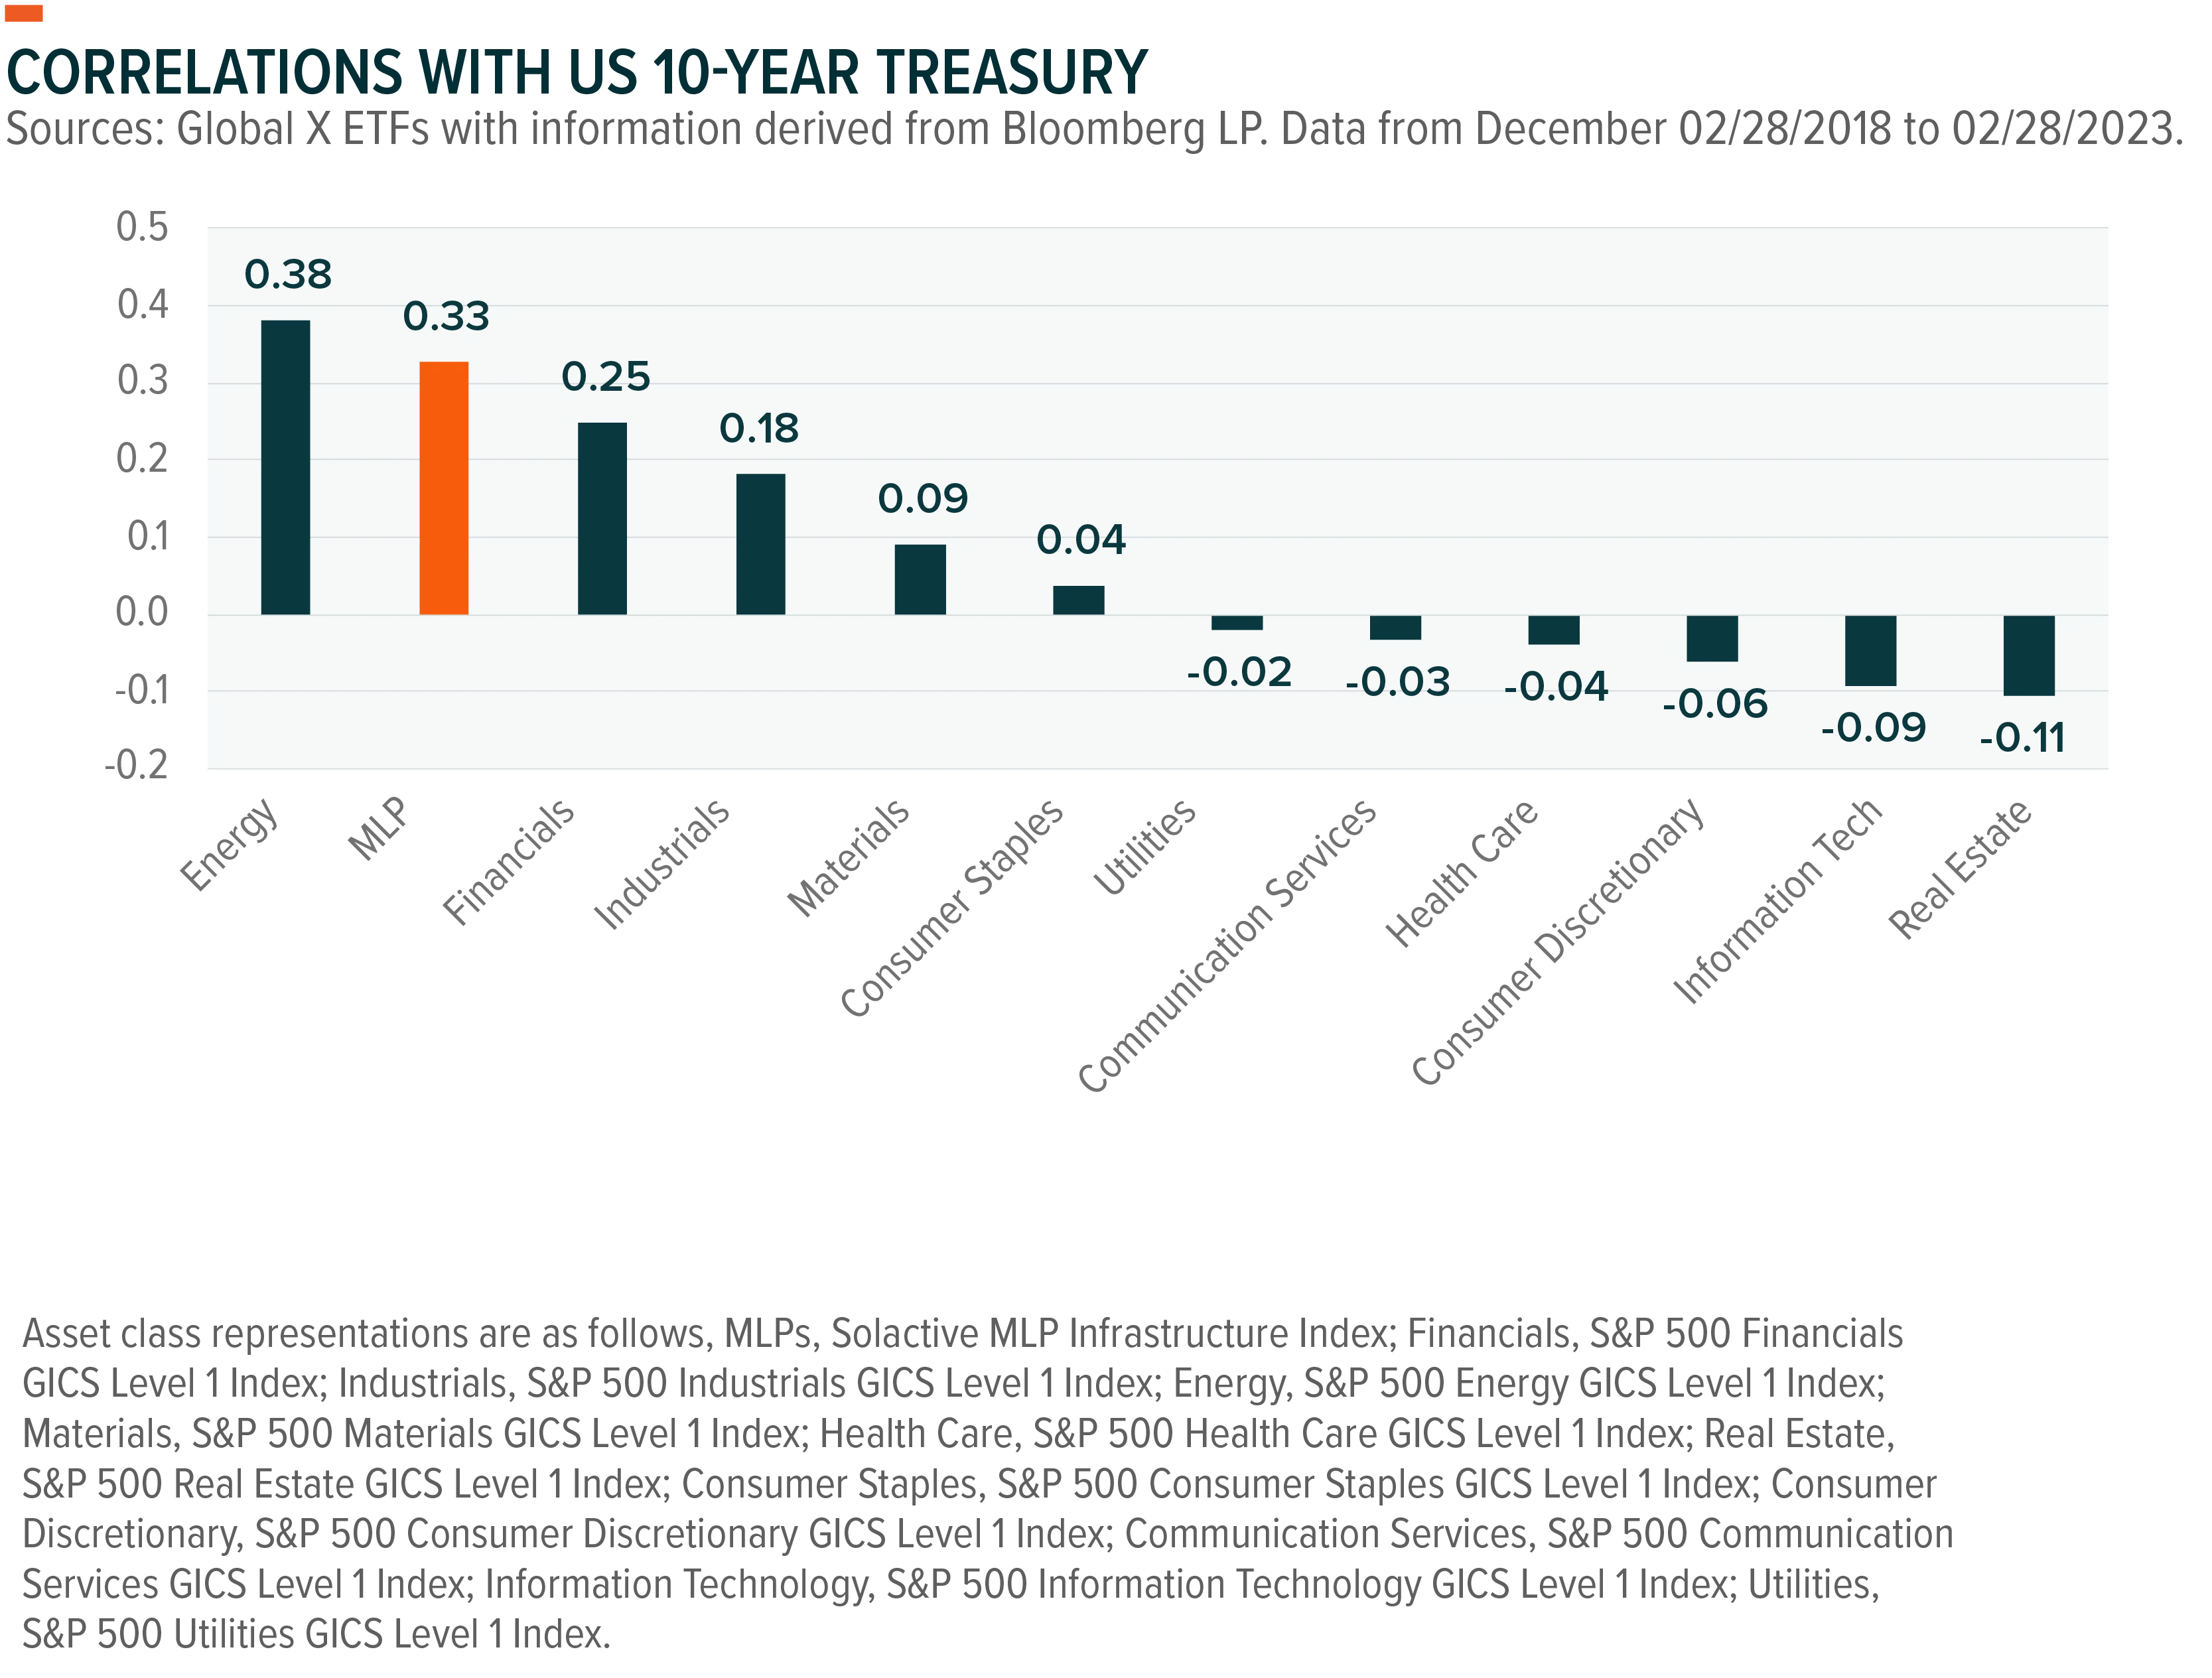
Fourth, exposure to real assets and index-linked contracts may reduce inflation risk and provide steady income, and midstream companies may be better able to handle inflation than other industries. U.S. inflation remains well above the Fed’s 2% objective and continues to indicate a broad-based increase in the general price level, notably for services and housing 5. MLPs historically exhibit a positive correlation with 10-Year Treasury, attributable to their commodities exposure and inflation protection provisions in their contracts.6 Contracts with inflation escalators enable operators to pass on increasing costs, therefore MLPs can hedge against inflation.
Fifth, Mergers and acquisitions (M&A) can help midstream companies maximize returns, accelerate expansion, and cut expenses. Some examples of recent companies’ strategic activity include Enbridge Inc’s four M&A deals, four investments in the past year and TC Energy Corp’s five M&A deals, three investments in the past three months.7
Energy Demand Has Support, Geopolitics Keeps Supply Tight
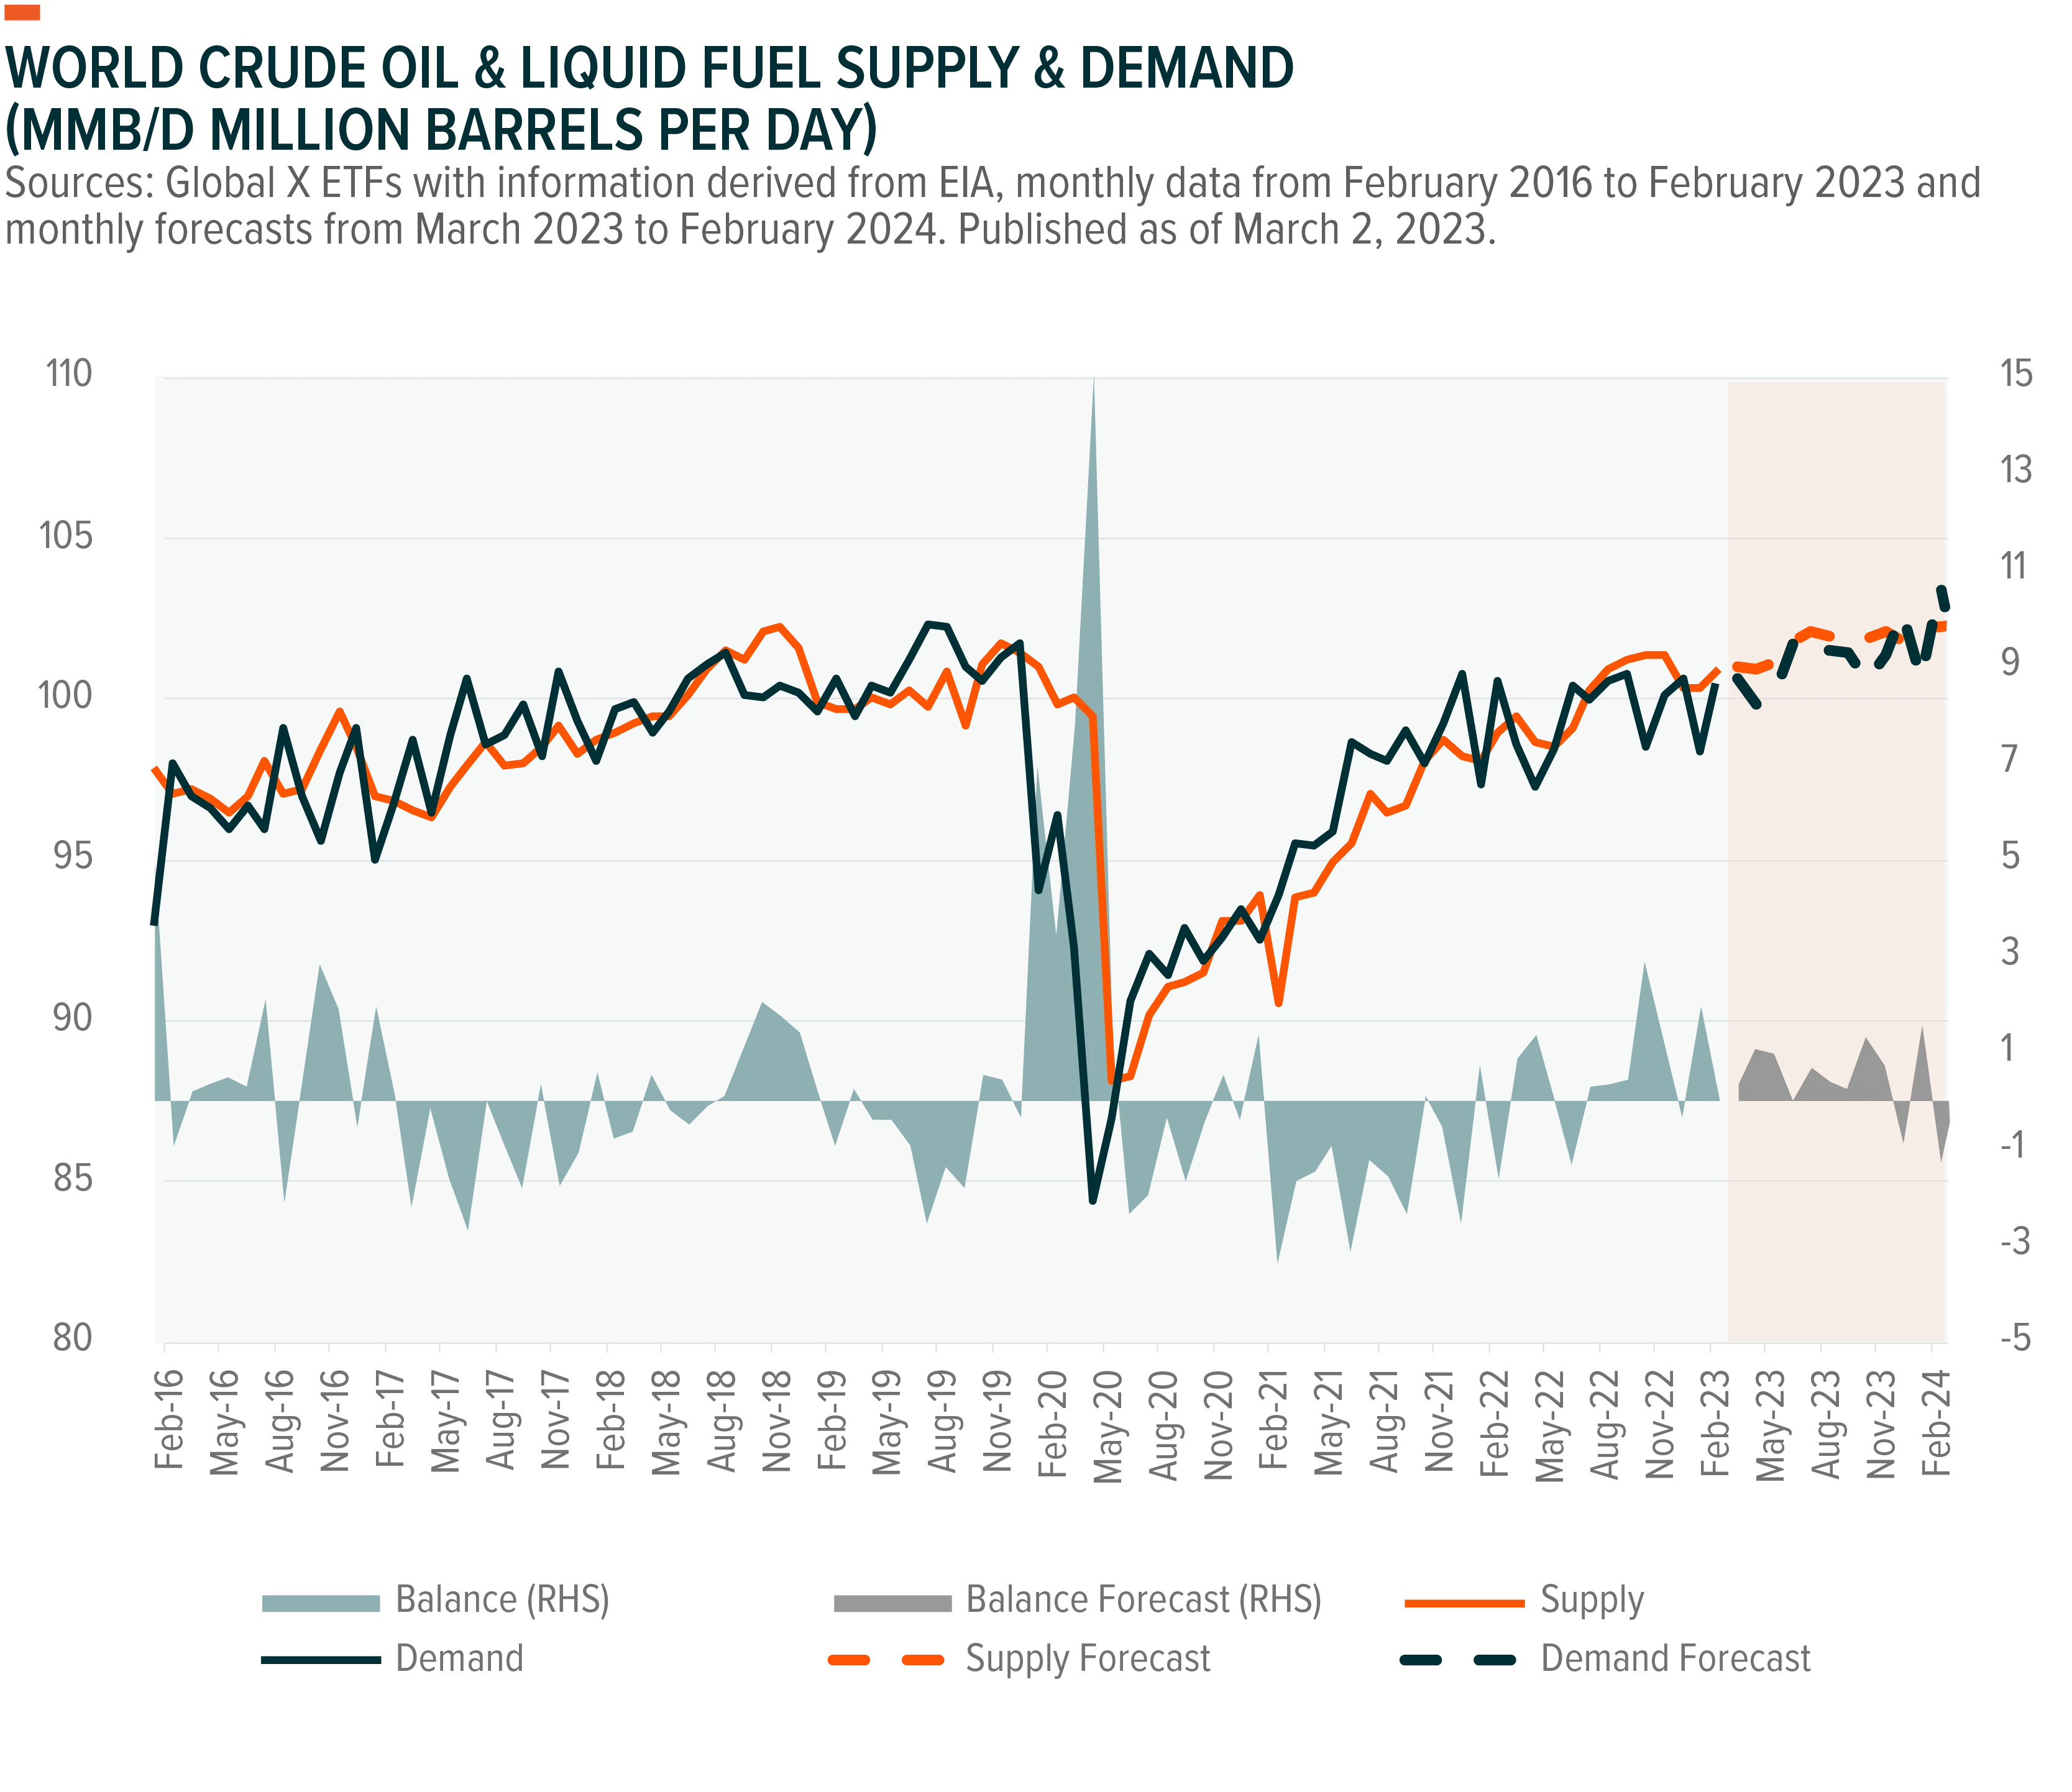
The lifting of lockdown restrictions in China may be a key catalyst for oil prices and the energy sector. Record Chinese oil consumption is forecasted this year as economic activity and demand for oil picks back up.8 In 2022, China’s oil demand fell by a record 440,000 barrels per day, or 3%. China’s crude oil imports fell by 0.9% year-over-year (YoY) last year, and its refineries processed 30 million tonnes less crude, a 4% YoY fall.9 This year, relaxed travel restrictions might have a strong impact again but in the opposite direction, boosting oil demand.
Signs of revival in Chinese demand are visible already: the move to loosen restrictions led to a significant increase in domestic flights, and traffic in major cities surged.10 These bounces come after road passengers plummeted by 72% and air passengers by 62% in the first eleven months of 2022.11
On the supply side, sanctions affecting Russia’s energy production and OPEC+’s conservative policies could continue to tighten the oil markets. OPEC+ bolstered the oil producer group’s output policy, keeping production cuts to 2 million barrels per day (b/d), as agreed in October last year, to prop up the market in the face of escalating Chinese demand and uncertainties in Russian supply prospects.12 The necessity of reserving production capacity is among the main reasons behind the cut, indeed, Saudi Arabia has often raised the alarm that the group's spare production capacity is extremely low.13
The energy policy tit for tat between Russia and the West continues. Russia may cut oil exports from its western ports by up to 25% in March 2023 on a month of month basis.14 The move doesn’t come as a surprise, as this type of retaliation was one of the main consequences of western sanctions identified by the markets. In addition to the price cap on Russian crude and the EU’s embargo on imports of Russian oil by sea that went into effect in December 2022 15, the EU and G7 nations imposed a price cap on refined Russian products beginning in February 2023.16
U.S. Oil & Gas Industry Appears Well Positioned in 2023
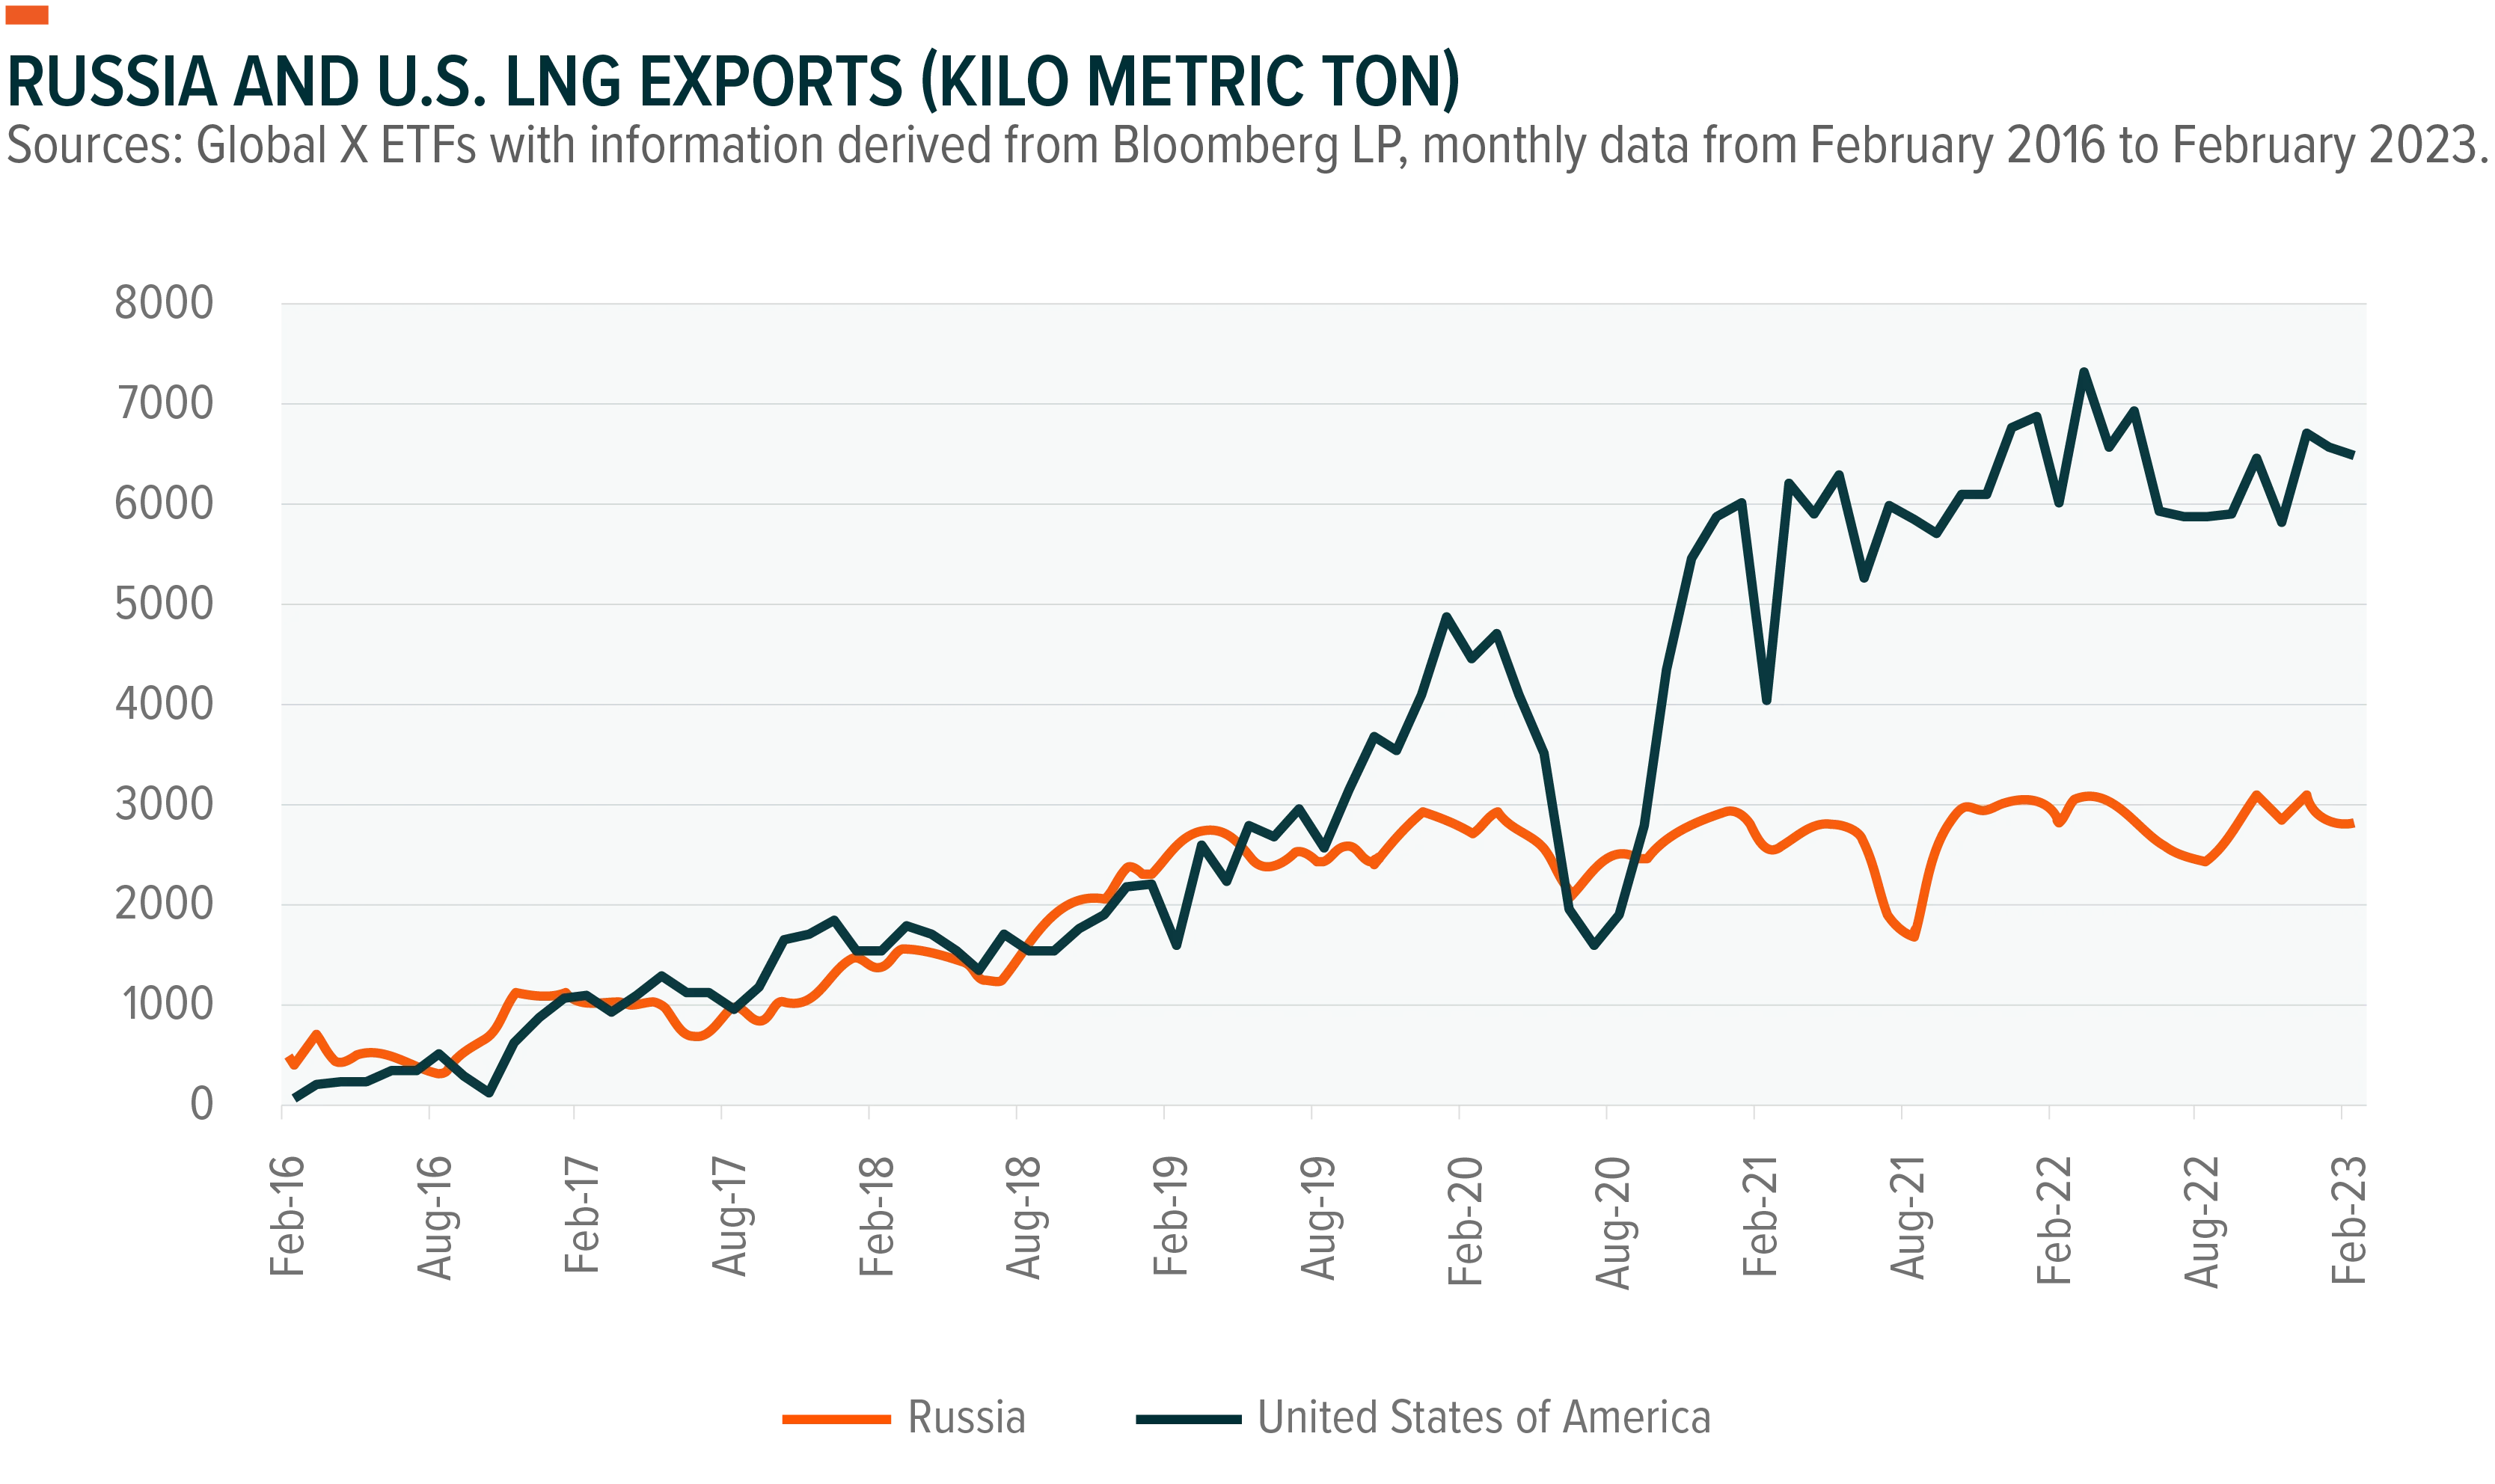
Rising U.S. natural gas output can fill supply gaps in the energy market, particularly in Europe. After Russia shut off most of their supply, Europe avoided the worst of its energy crisis due to the warmer-than-usual weather and importing record volumes of liquid natural gas (LNG).17 In 2021, the European
Union imported 83% of its natural gas, including 45% from Russia. In November 2022, Russia’s share of EU gas imports was only 12.9%.18 The United States was the European Union’s top LNG supplier in 2022, representing 41% of the region’s LNG supplies, and U.S. LNG can continue to be a relevant source for Europe going forward.19
In February, Russia’s oil and gas revenue dropped by 46% year-over-year 20, the ramifications of which are significant when considering that pre-invasion Russia was the world’s second-largest oil-exporting nation and comprising 10% of the global oil supply.21,22 We expect Russia’s supply level to decline even further in 2023, and OPEC+ seems unwilling to increase production to compensate for the gap.
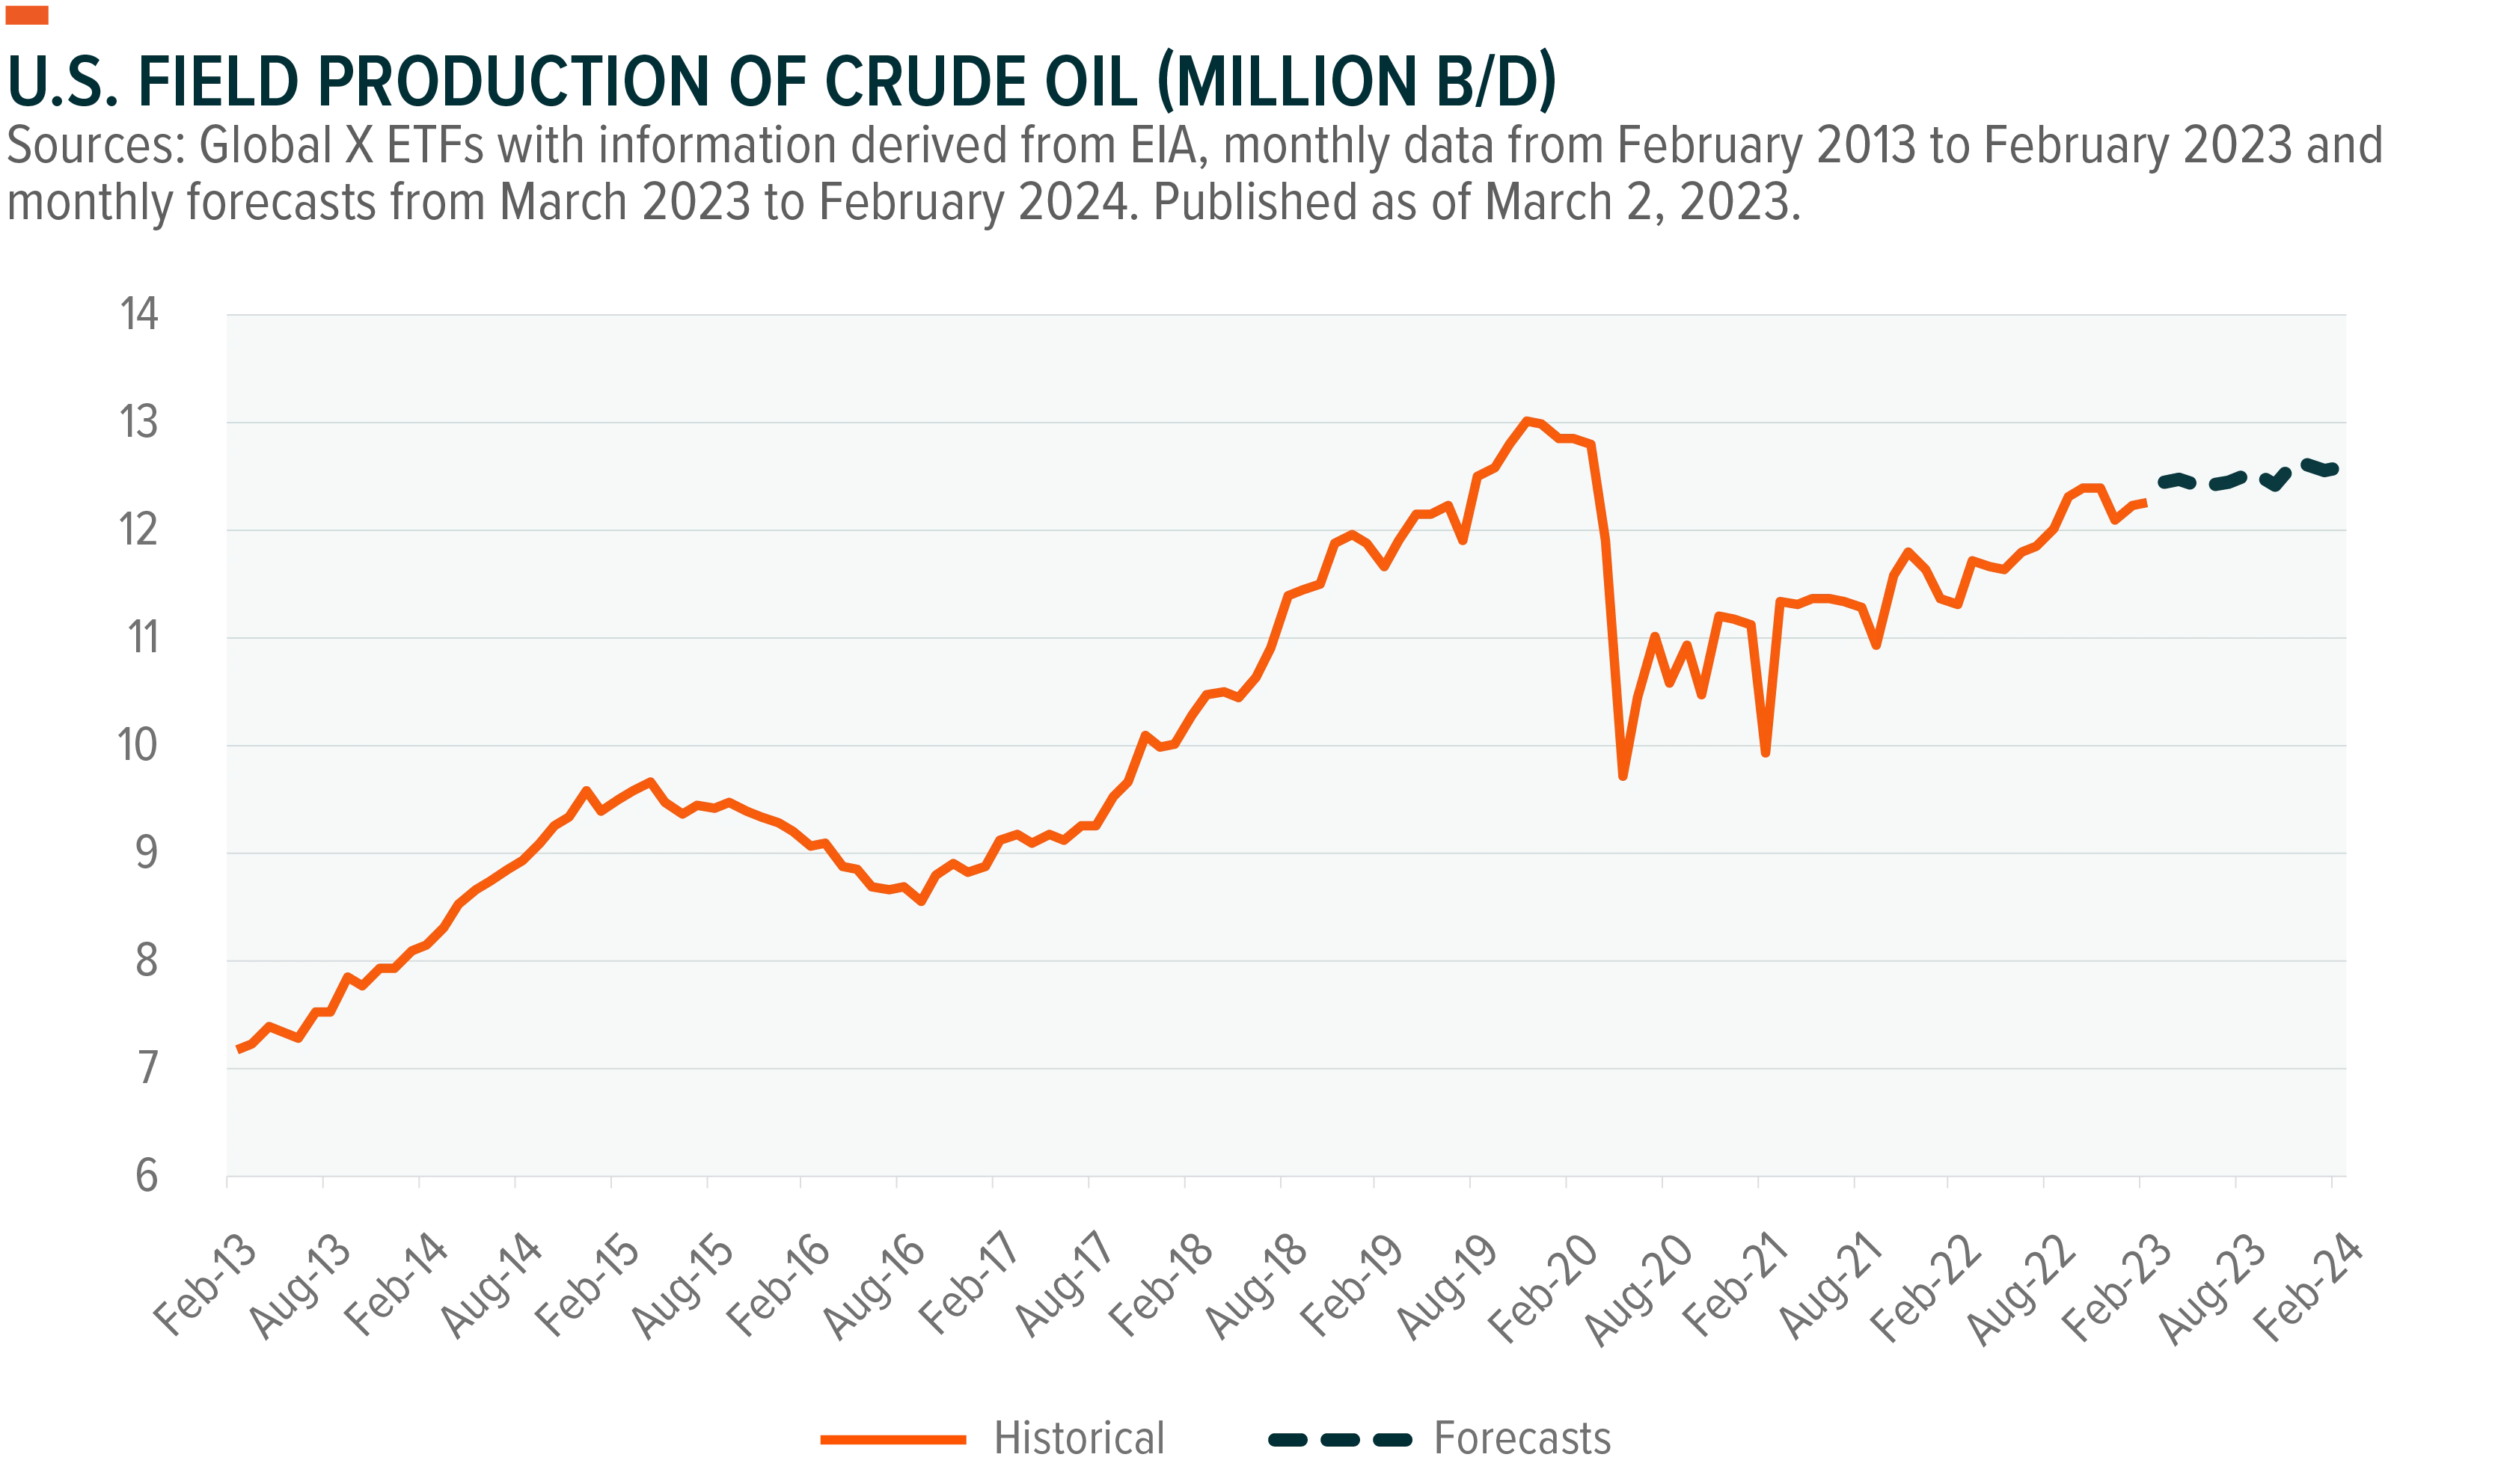
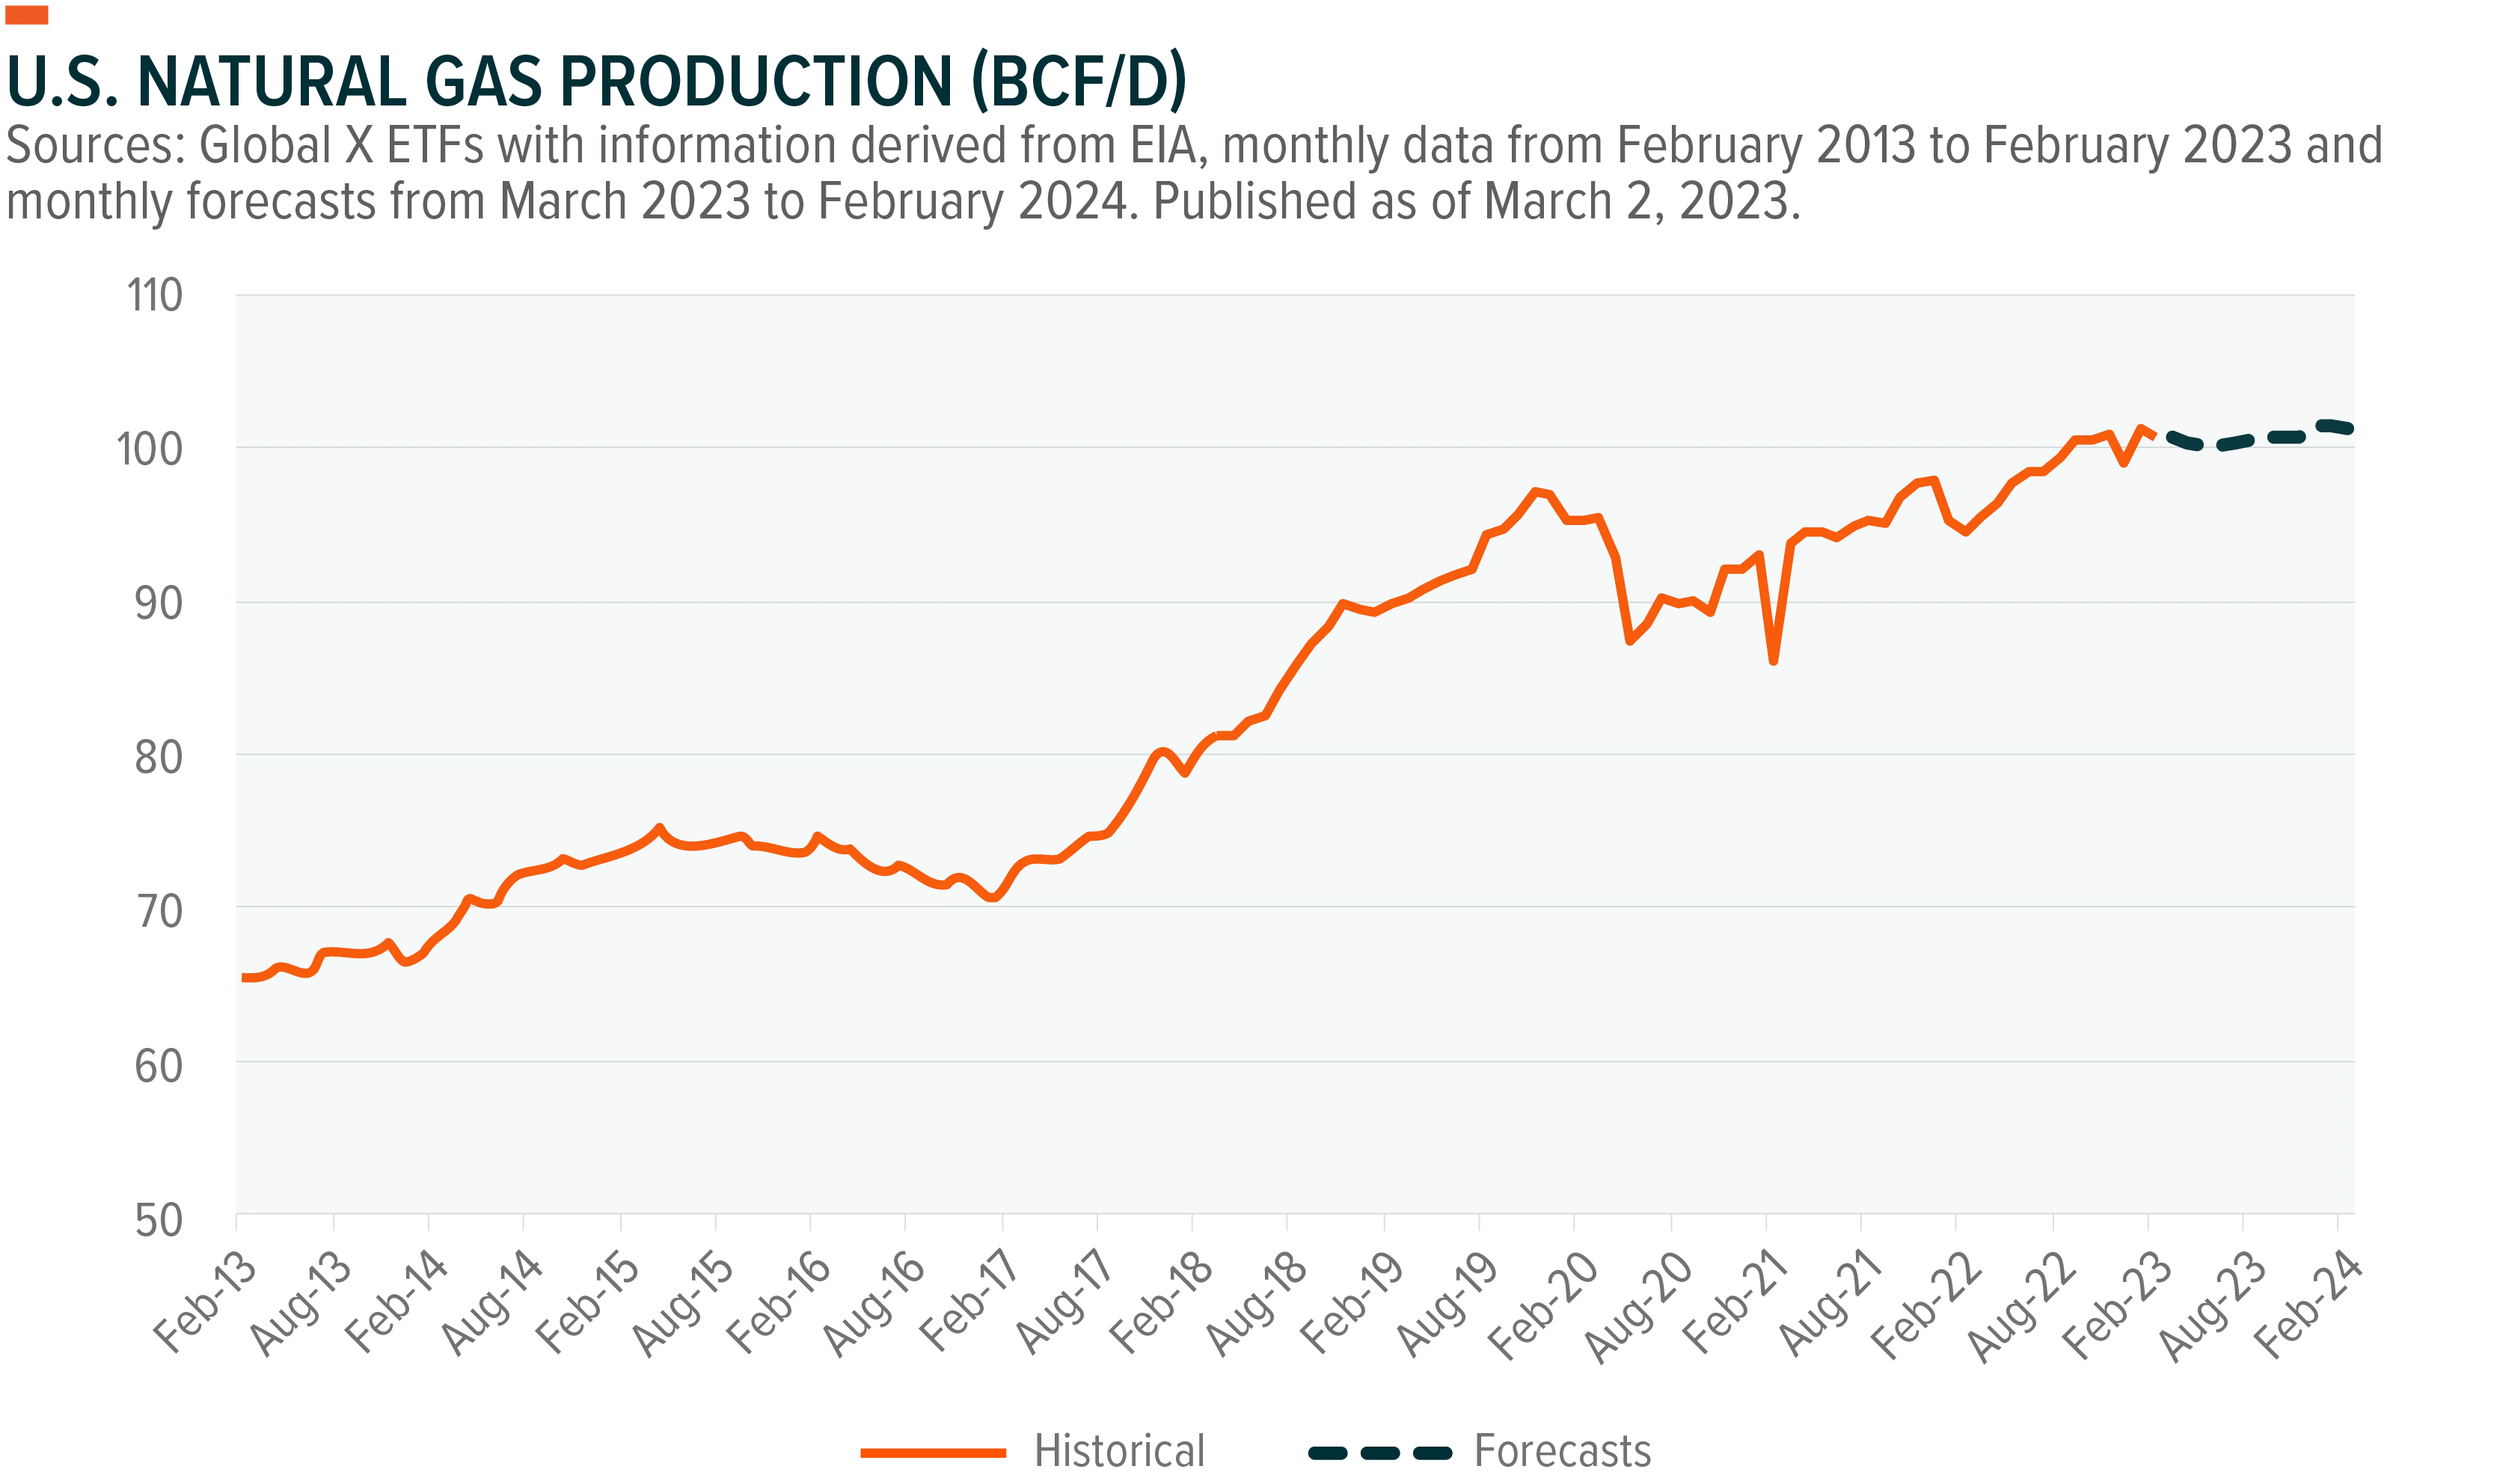
Against this backdrop, the outlook for U.S. energy businesses appears favorable. In 2023, U.S. natural gas output may increase by around 2% YoY to 100–101 billion cubic feet per day (bcf/d) 23 and crude oil production may surpass the record high set in 2019 by averaging 12.4 million b/d 24. In 2022, U.S. crude production averaged 11.9 million b/d, mostly as a result of increased output in the Permian basin. Oil output in this region is forecast to increase by another 470,000 b/d in 2023 to an average of 5.7 million b/d. As new natural gas pipelines are finished, producers will be able to transport more of the extracted associated-dissolved natural gas to the market, removing a possible barrier to crude oil production.25
Conclusion: Midstreams Appears Attractive
Oil markets might tighten due to geopolitical-induced supply concerns and the burgeoning turnaround in economic activity in China. The events of 2022, including those that accelerated the energy markets shift, such as the war in Ukraine, has the U.S. oil and gas industry positioned to benefit, in our view. From a midstream perspective, higher U.S. oil and gas production increases the need for infrastructure, including pipelines, storage facilities, and processing plants. We expect this trend to persist and potentially provide opportunities for investors to benefit from a sector that may offer yield and an inflation and interest rate hedge at reasonable valuations.
Related ETFs
MLPA – Global X MLP ETF
MLPX - Global X MLP & Energy Infrastructure ETF
Click the fund name above to view current holdings. Holdings are subject to change. Current and future holdings are subject to risk.