The Global X Income Outlook for Q4 2022 can be viewed here. This report seeks to provide macro-level data and insights across several income-oriented asset classes and strategies.
Last quarter we discussed the continuation of high inflation, with the headline U.S. Consumer Price Index (CPI) peaking at 9.1% for the month of June, which has since rolled over from the summer high, bringing inflation to 7.7% for October, still well above the Federal Reserve’s (Fed) neutral rate. One of the key differences is the contribution of the sticky aspect of inflation with Services (ex food & energy) up 6.74% year-over-year (YoY) and owners’ equivalent rent breaking the 1980’s highs, meaning that inflationary pressures may stick around longer than expected.1, 2
The Fed unanimously decided to raise their policy rate at the November Federal Open Market Committee (FOMC) meeting, marking the fourth consecutive 75 basis point hike, extending its most aggressive tightening campaign since the 1980s in an effort to thwart inflation.3 Rising rates have also raised the appetite for short-term fixed income investments. However, we believe that there are alternative income strategies that may be more resilient in this environment.
Key Takeaways
Rate hike expectations for the Fed, the European Central Bank (ECB) and central banks around the world remain high, with markets expecting more aggressive policy decisions to be required to rein in inflation.4 However, futures markets are projecting a path to rate increases tapering off in the earlier stages of 2023.5
The rising contribution of the sticky components within inflation may cause future inflation releases to remain elevated above current expectations. Treasury Inflation-Protected Securities (TIPS) can help investors monetize elevated inflation by readjusting the coupon payment.
The rising cost of capital for firms may put pressure on their ability to maintain dividend distributions, amid earnings uncertainty. We see certain option-based strategies like covered calls as a potential way of benefiting from the uncertainty as options premiums remain high.
Treasury Yields Rally Putting Pressure on Fixed Income
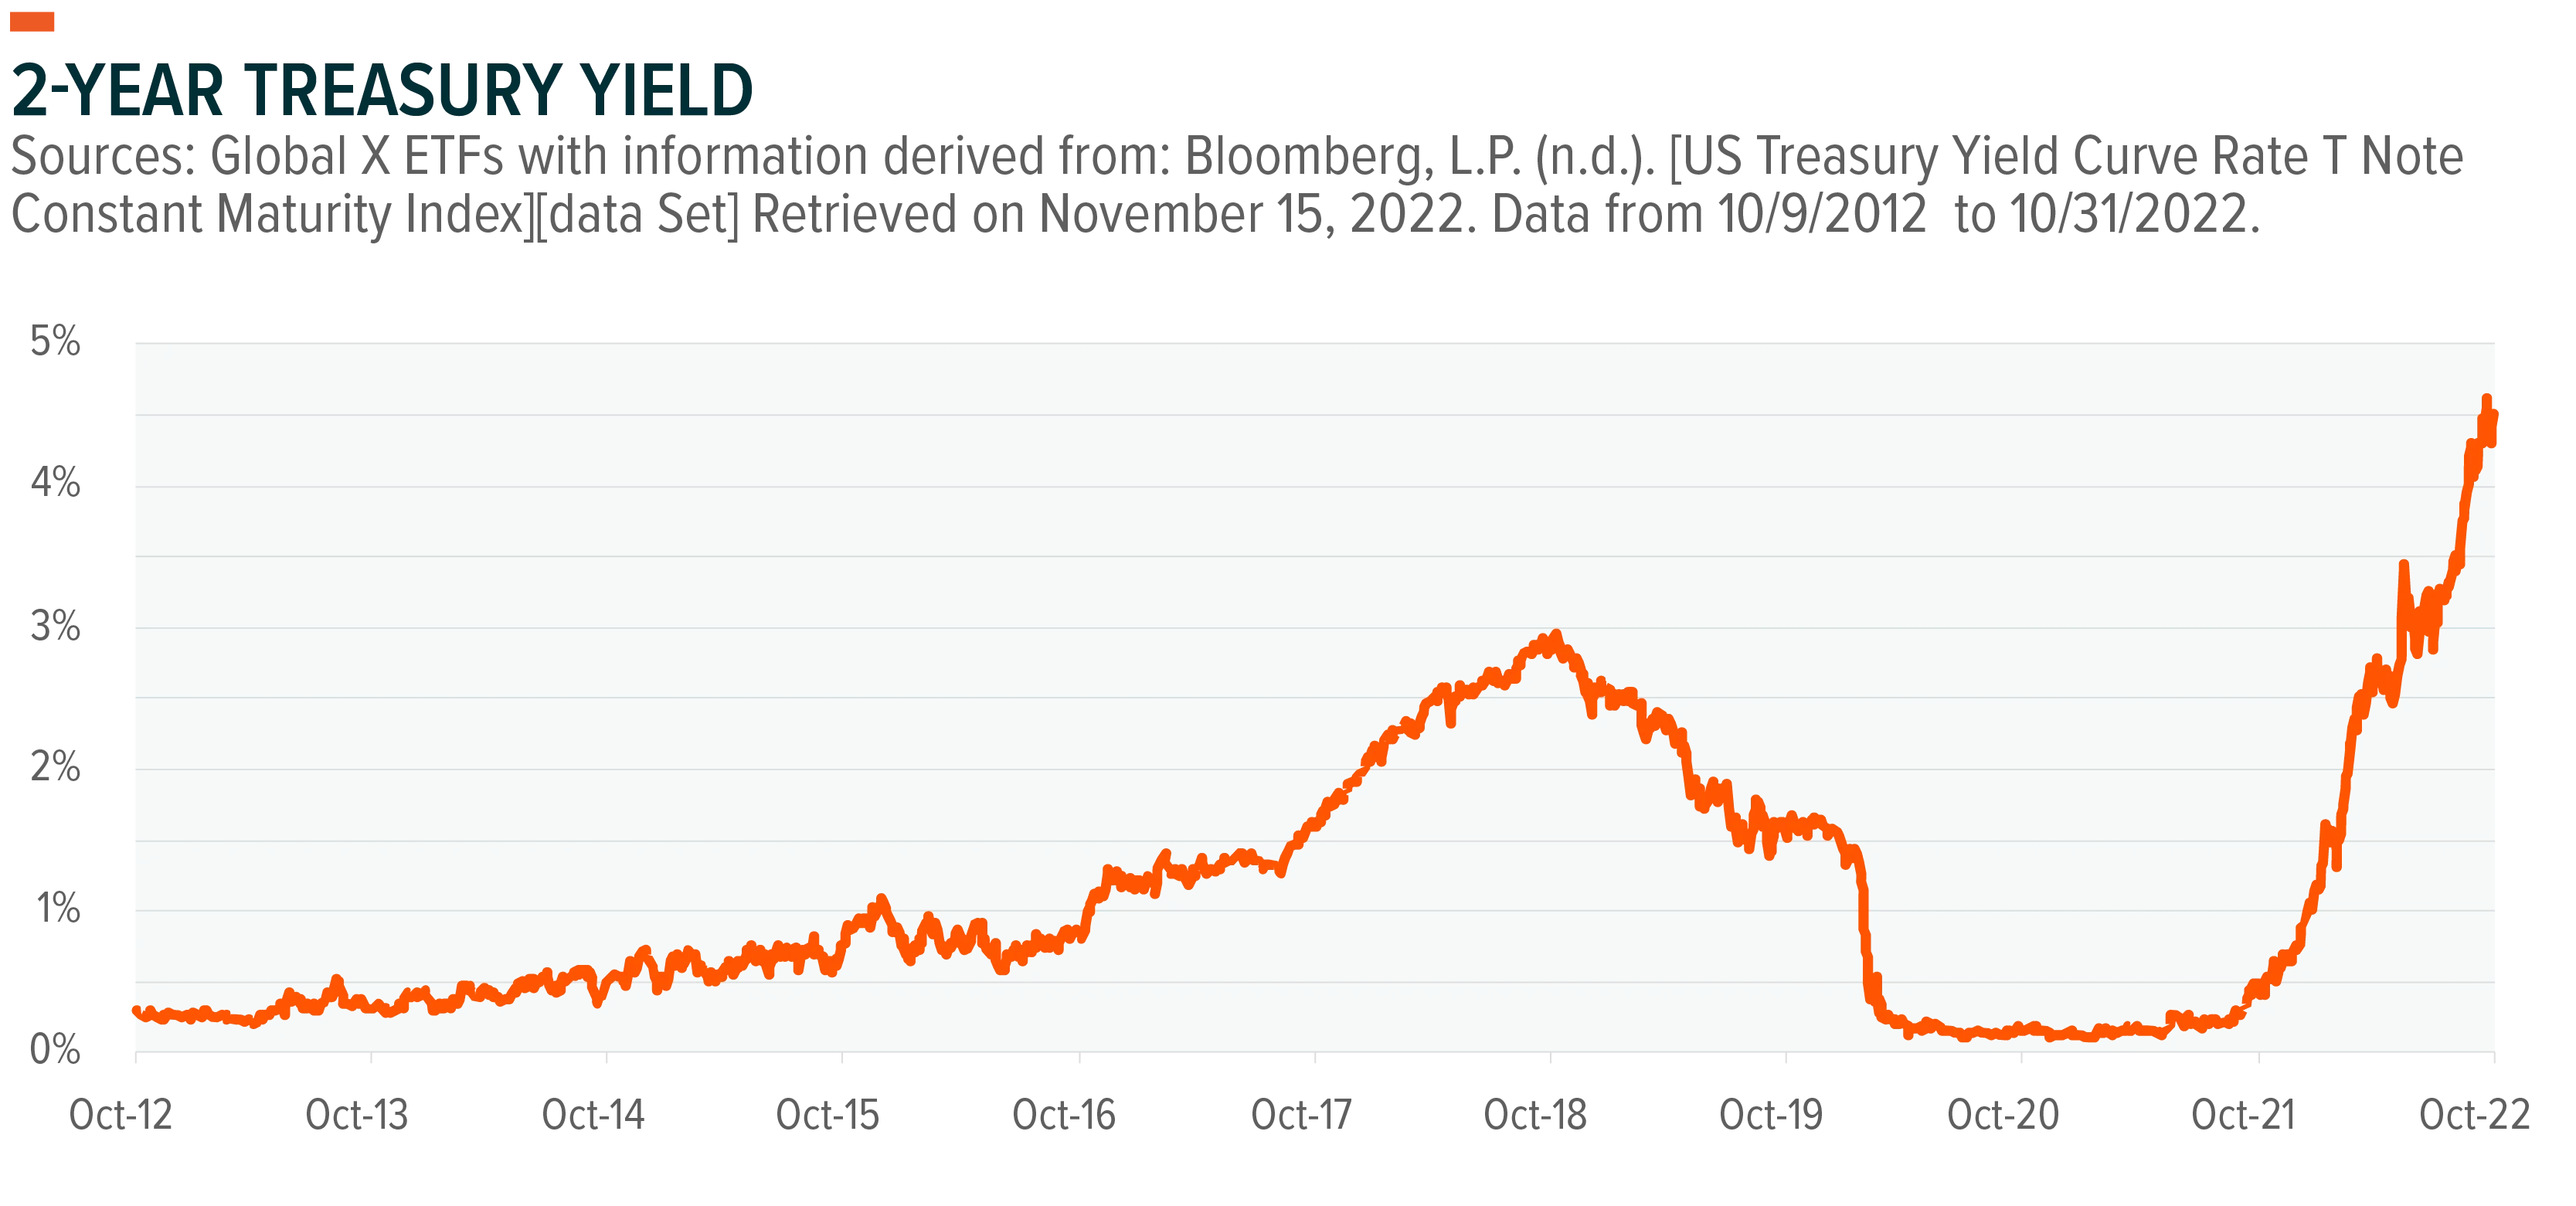
After the higher than expected sticky aspects of inflation, short-term treasury yields climbed to the highest level since June 29th, 2007 on the speculation that the Fed will remain hawkish for the foreseeable future.
The 2-Year US treasury note yield jumped to the highest level since 2007 as the expected policy rate peak (terminal rate) breached the 5% level. The acceleration of yields has caused a magnified effect on high duration assets such as +20-year treasury bonds. For example, the ICE U.S. Treasury 20+ Year Bond Index is down -29.69% year-to-date as of 11/30/2022, Traditional 60/40 portfolios have been stressed as fixed income yields rise, compressing price multiples and bearing down the fixed income sleeve of portfolios.6 The cross-asset decline of equities and fixed income is leaving investors looking for pockets of the market that can produce income and potentially provide shelter against the backdrop of rising borrowing costs.
TIPS Sticking Around Amid Lasting Inflation
Investors are stuck in a difficult situation – take a higher level of interest rate risk with high duration treasuries or move down the credit ladder for potentially higher yielding investments, increasing credit risk which may not be ideal as the Fed’s biggest concern is with taming inflation at the moment.
Investors have started moving towards Treasury inflation-protected securities also known as TIPS. One challenge with TIPS is they take on a higher level of interest rate risk (Duration) compared to a similar maturity treasury bond but is currently balanced by benefiting from higher than expected inflation This adds a layer of asymmetrical risk for investors as treasury yields across the treasury curve spectrum are below the current inflation level.7
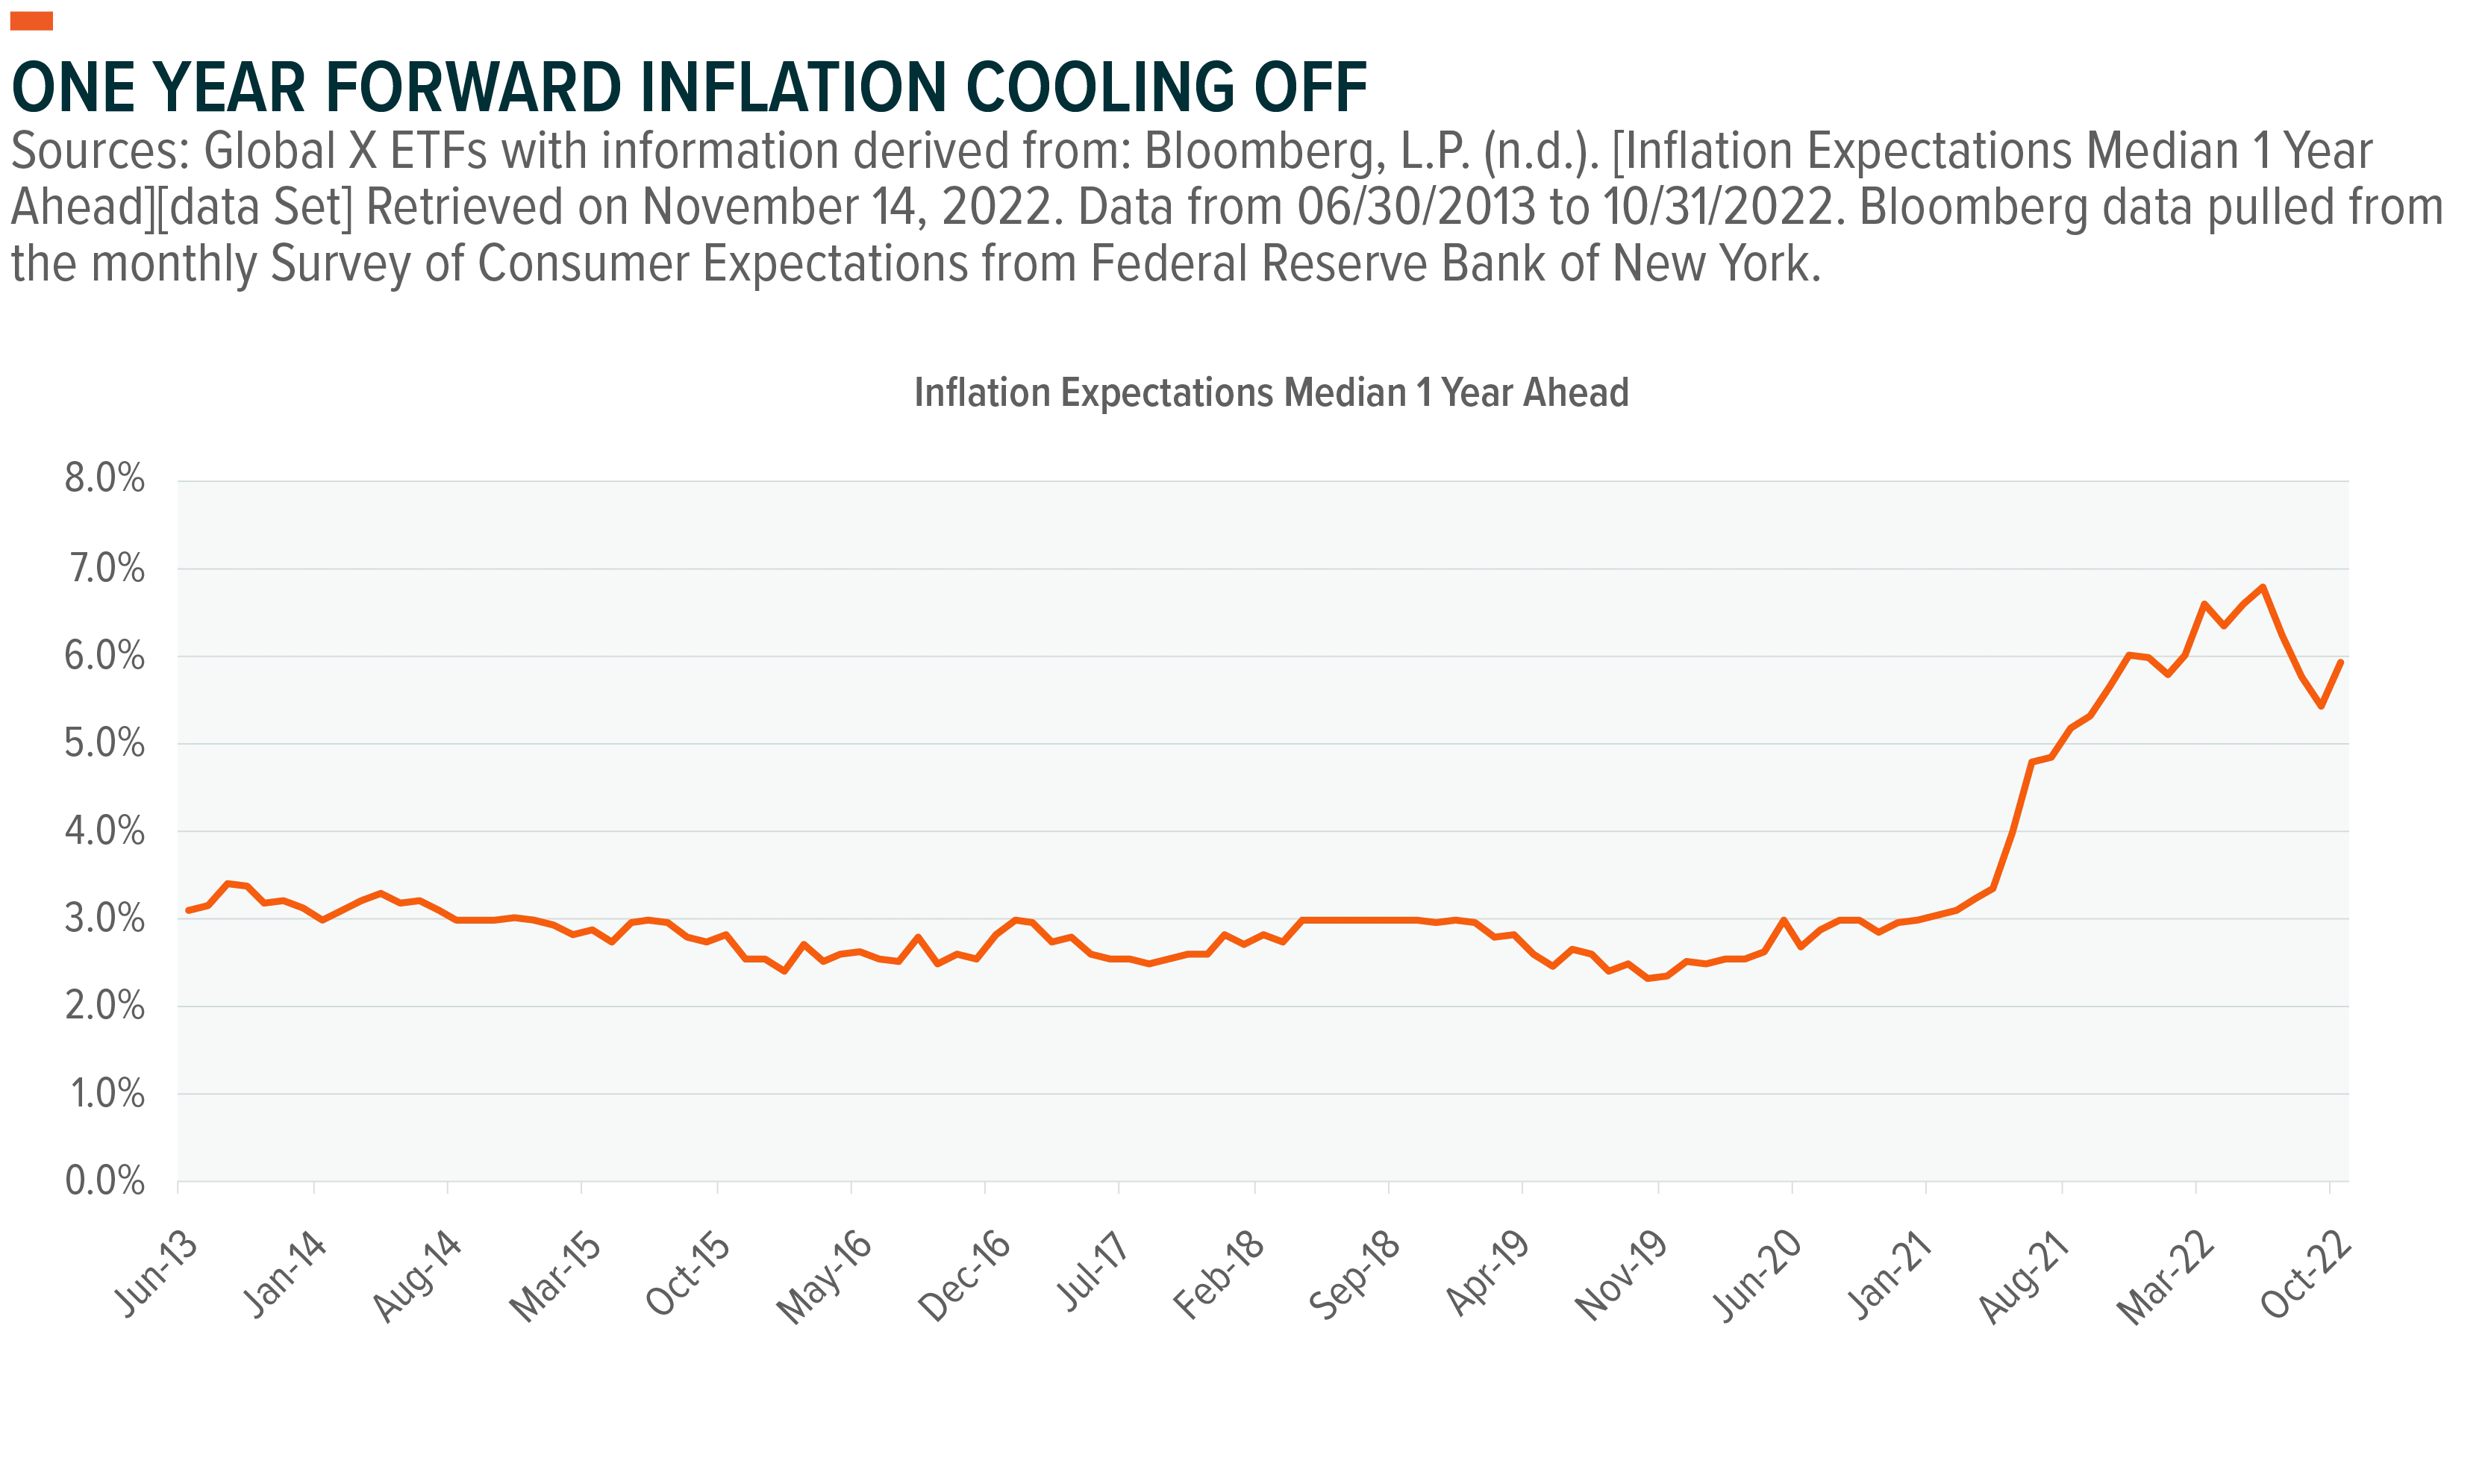
The Global X Interest Rate Volatility and Inflation Hedge ETF (IRVH) is a potential investment for investors that targets inflation-protected income while potentially benefiting from a steepening of the yield curve and an increase in interest rate volatility. The fund is actively managed and is a potential diversifier and hedge for a traditional asset allocation. The weighting between the two legs (TIPS & interest rate curve spread options) is designed to help balance the risk between rising inflation and interest rate risk. The fund can help hedge against interest rate movements arising from a steepening of the US interest rate curve and is expected to benefit from periods of market stress when interest rate volatility increases, while providing inflation protected income from the TIPS allocation. The chart below outlines the expected contraction in inflation one year out, which may help TIPS performance if you see inflation continue to persist.
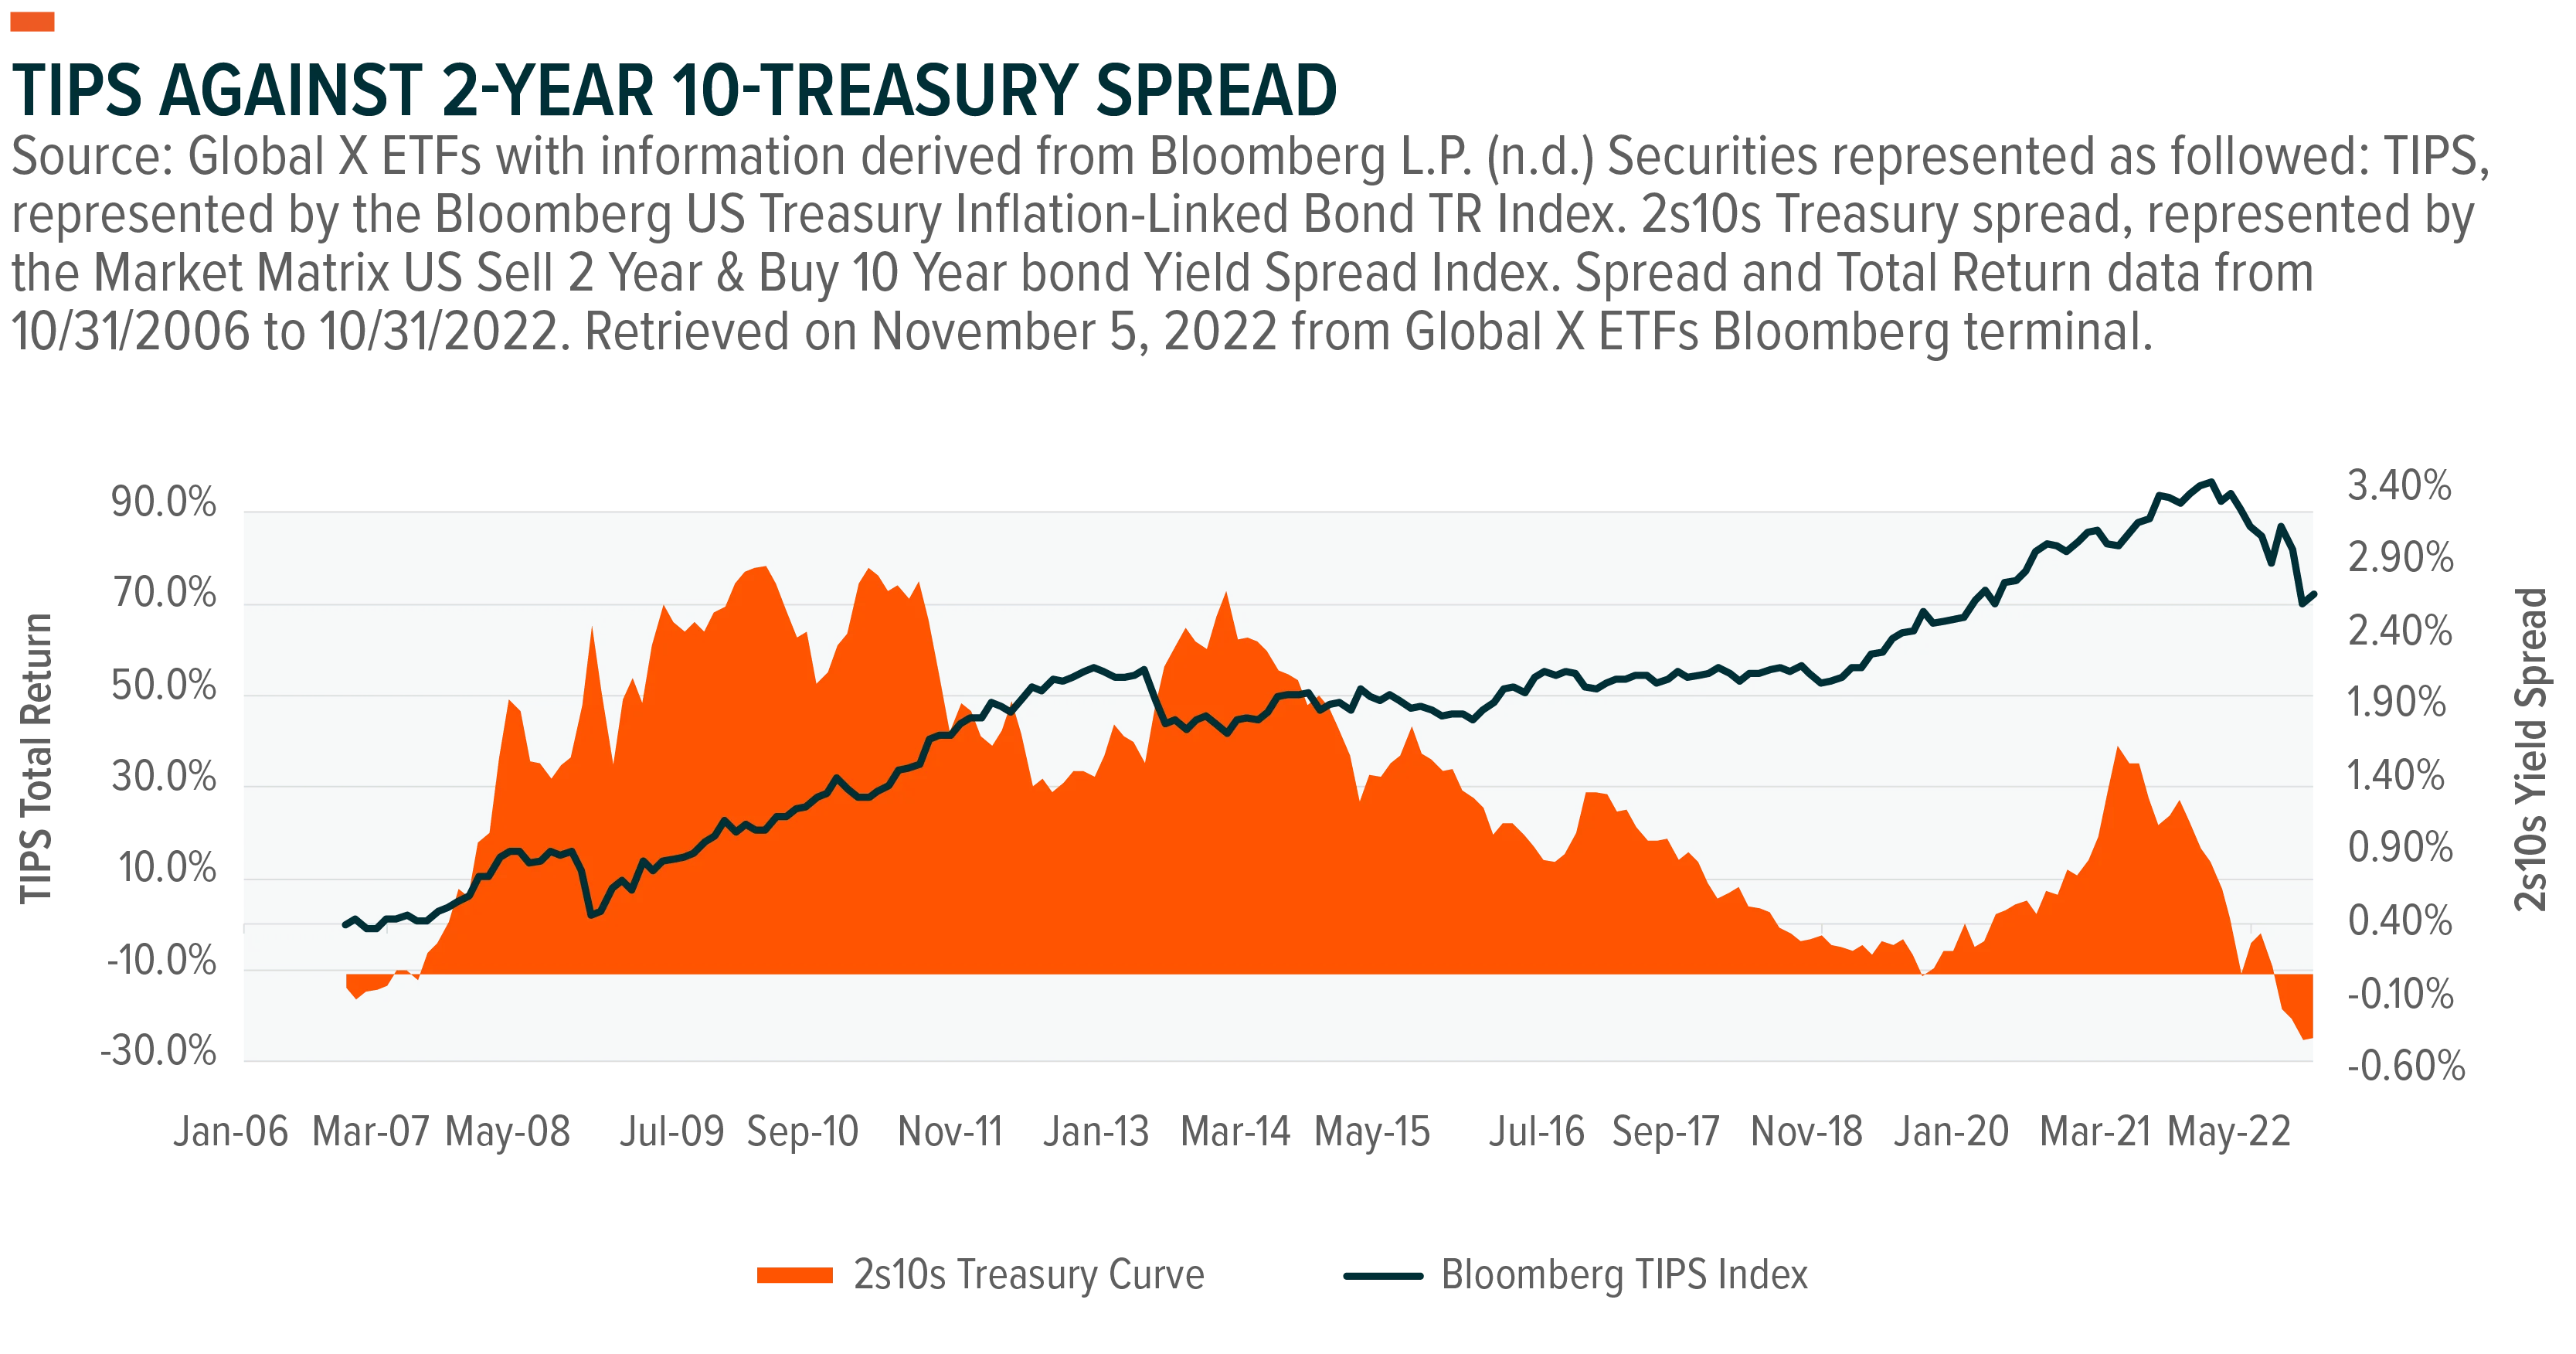
The 2s10s inversion, which refers to the occurrence of a higher yield on two-year US Treasury bonds compared to ten-year Treasury bonds, is typically seen as a signal that market participants anticipate an increase in short-term interest rates in the near future. This dynamic can lead investors to accept lower yields on longer-term bonds to mitigate the perceived risk of holding these securities. The inversion of the 2s10s curve may have implications for investment strategies such as IRVH, which may be impacted on both a total return basis and in terms of volatility, as these strategies often rely on a steep yield curve to generate income. For reference, the curve is at the highest level of inversion since 1981, with the curve being positive 85.3% of the time and having an inversion of over 60 basis points only 8 months or 4.35% of the time since 1977.8 The curve options may mitigate downside pressure from the TIPS allocation as inflation tends to dwindle in parallel with lower demand, increasing pressure for the Fed to cut rates. This can cause a bull steepener scenario (Fed lowering the front-end rates) in an effort to stimulate the economy, mitigating the volatility compared to simply owning a basket of TIPS. A scenario of higher than anticipated inflation may cause both legs (TIPS and Curve Options) to perform well, as forward inflation would remain high, while the curve options should benefit from the bull steepener.
Increased Cost of Capital Magnifying Equity Volatility
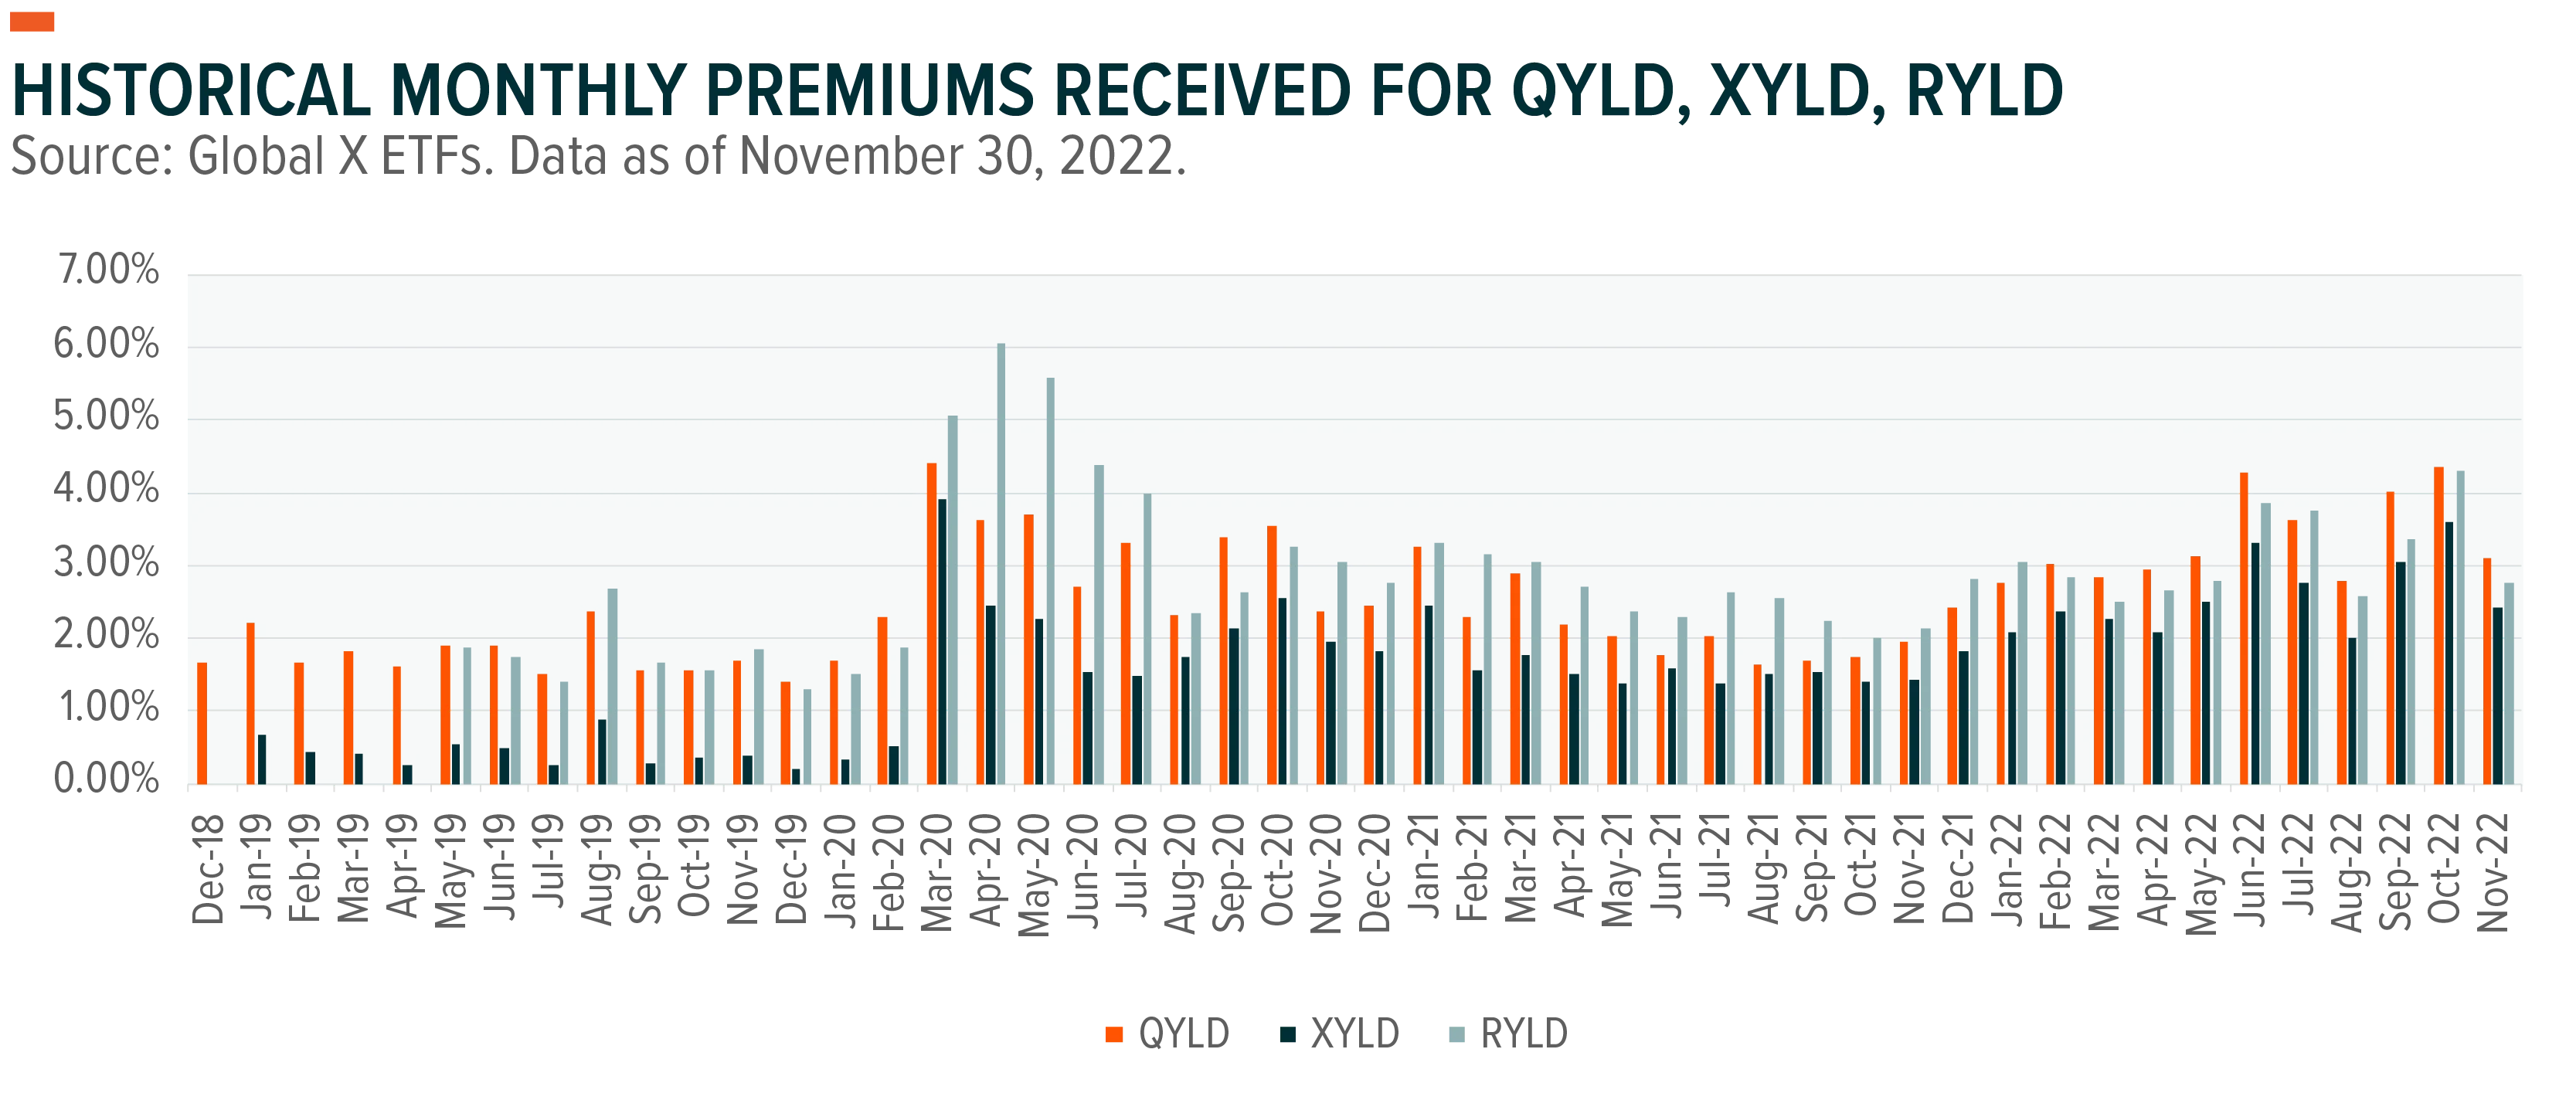
In the current environment, we are favorable on covered call strategies and risk managed income strategies in particular. Covered call strategies work by buying a particular asset, such as the stocks in an index, and selling call options on the same asset to generate income. We believe an at-the-money (ATM) covered call approach may be best suited for income-oriented investors given the higher premiums generated relative to out-of-the-money (OTM) covered call strategies. Global X offers a variety of ATM money covered call strategies on the Nasdaq-100 (QYLD), S&P 500 (XYLD), Russell 2000 (RYLD), and Dow Jones Industrial average (DJIA).
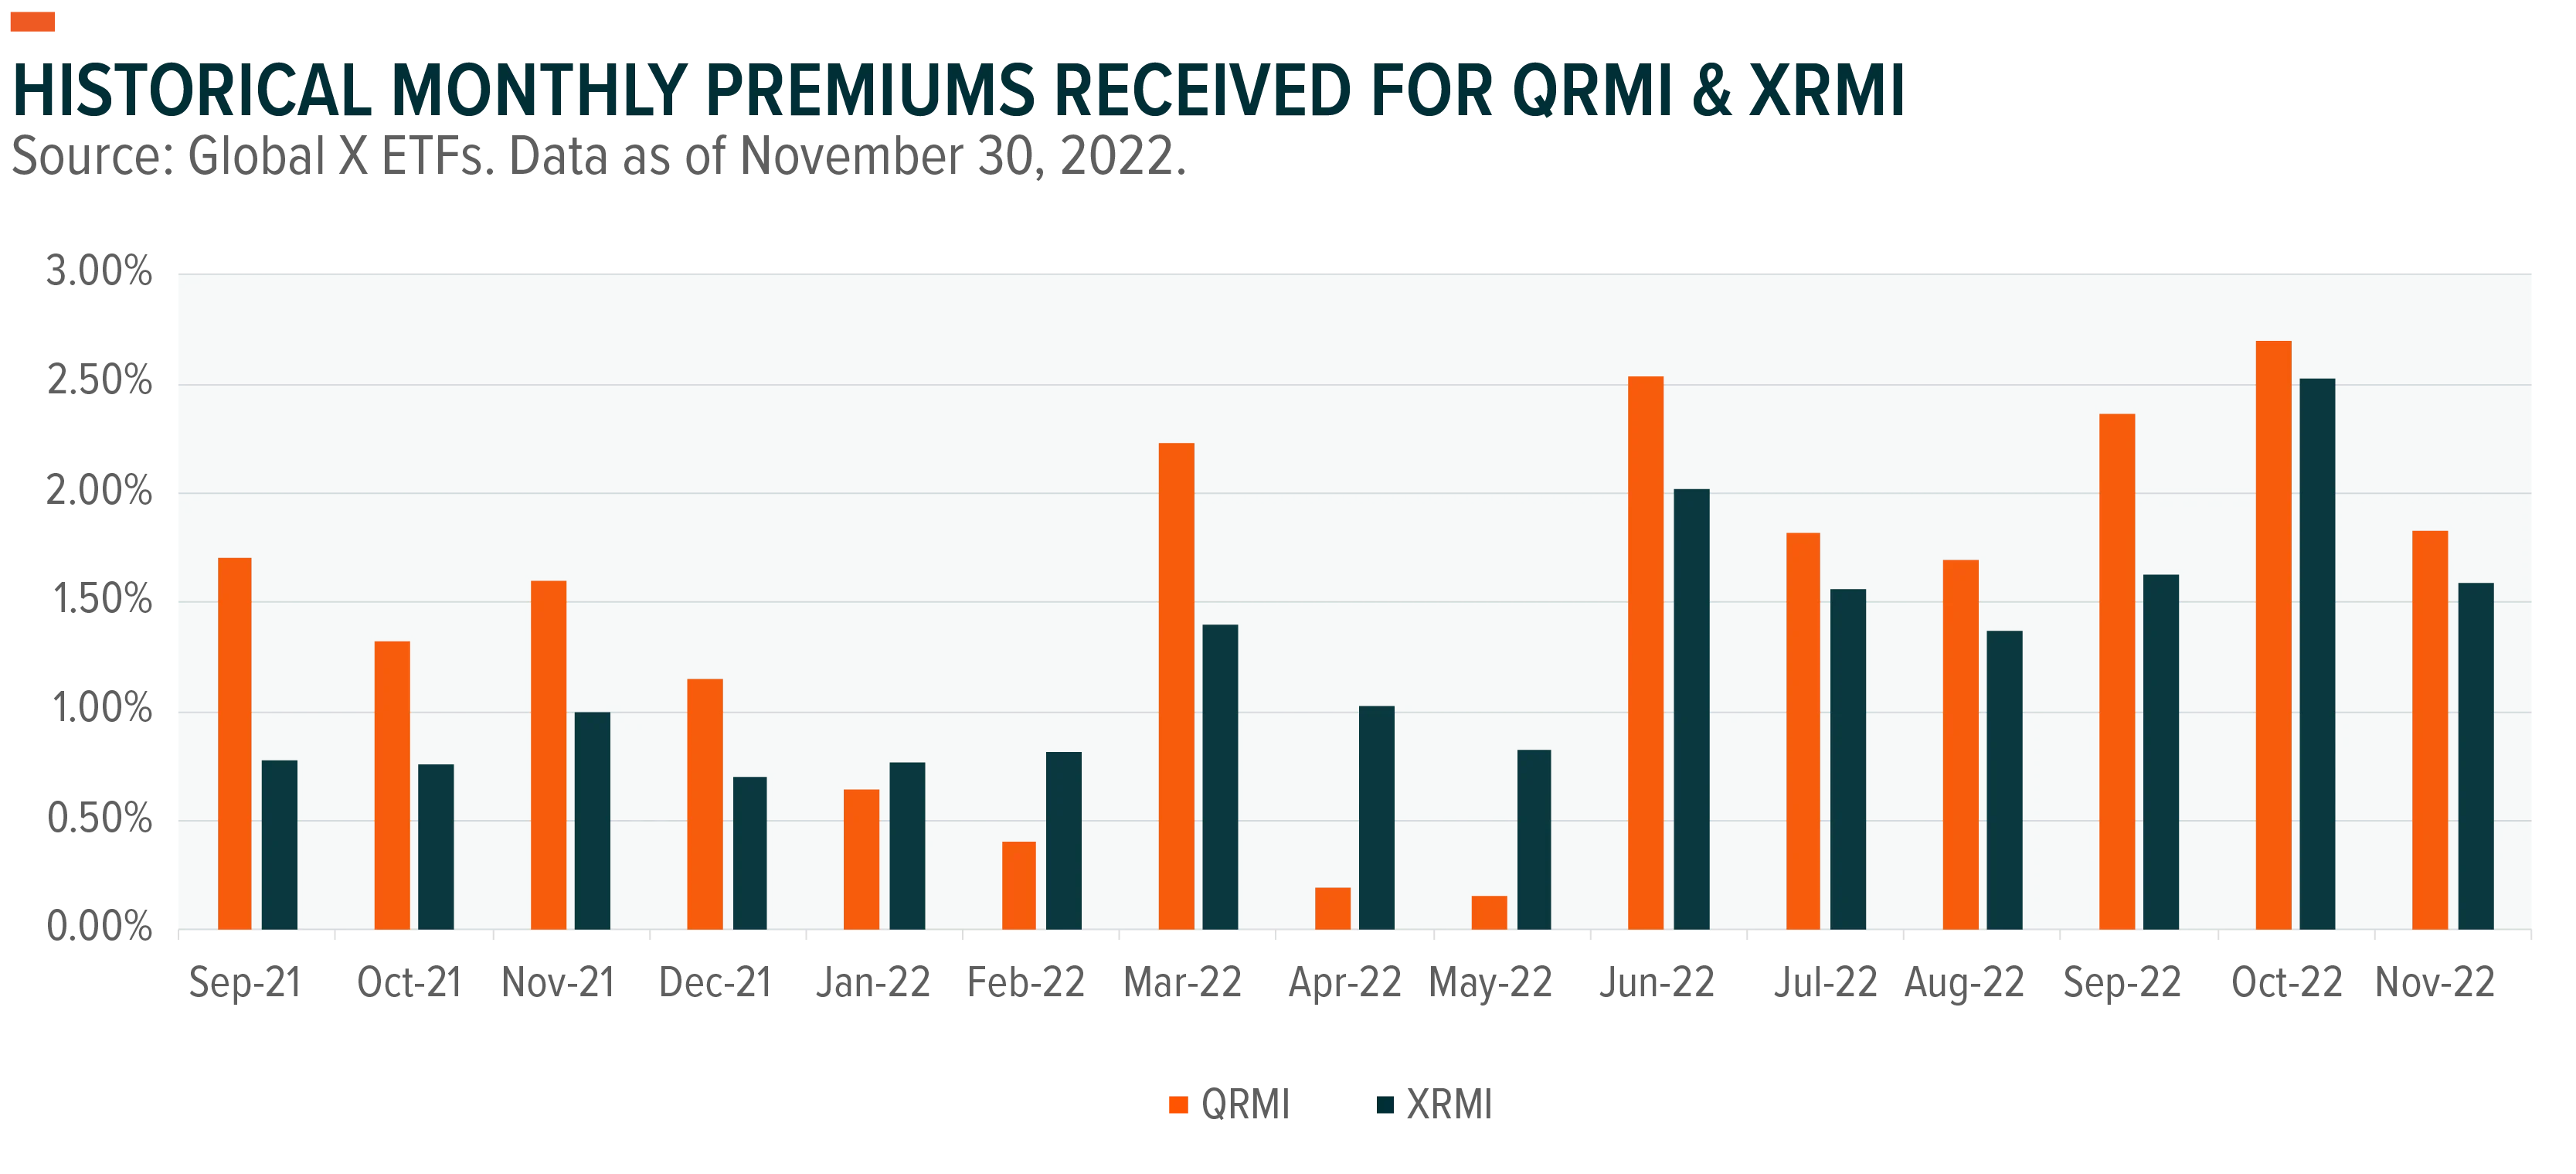
For investors looking for a degree of downside protection amid market volatility, Global X’s risk managed income (RMI) strategies may be an alternative. These strategies are covered call strategies overlaid with protective puts, known as a collar strategy. The RMI lineup writes ATM calls and buys OTM put options to provide an additional layer of downside risk mitigation, translating potential market volatility into an income stream. The major difference is the risk/reward trade-off in a collar strategy as compared to covered call; in addition to giving up the upside potential, a collar strategy gives up a piece of the premium income received from selling the call to buy the protective puts. Like the covered call strategies, Global X offers net credit collars (premium from selling the calls is higher than the premium of buying the puts) on two major US indices the S&P 500 (XRMI) and the Nasdaq-100 (QRMI).
These strategies can potentially outperform equities and fixed income investments in a period of choppy sideways markets. These funds are best suited for investors seeking higher income than provided by typical equity dividends and fixed income yields, or for investors looking to mitigate a degree of downside risk, from lower expected growth. On the fixed income side, these strategies may lower interest rate risk, as volatility tends to spike when the markets see an above average rise in short-term rates, increasing the premium received.
Preferreds as a Lower Duration Alternative
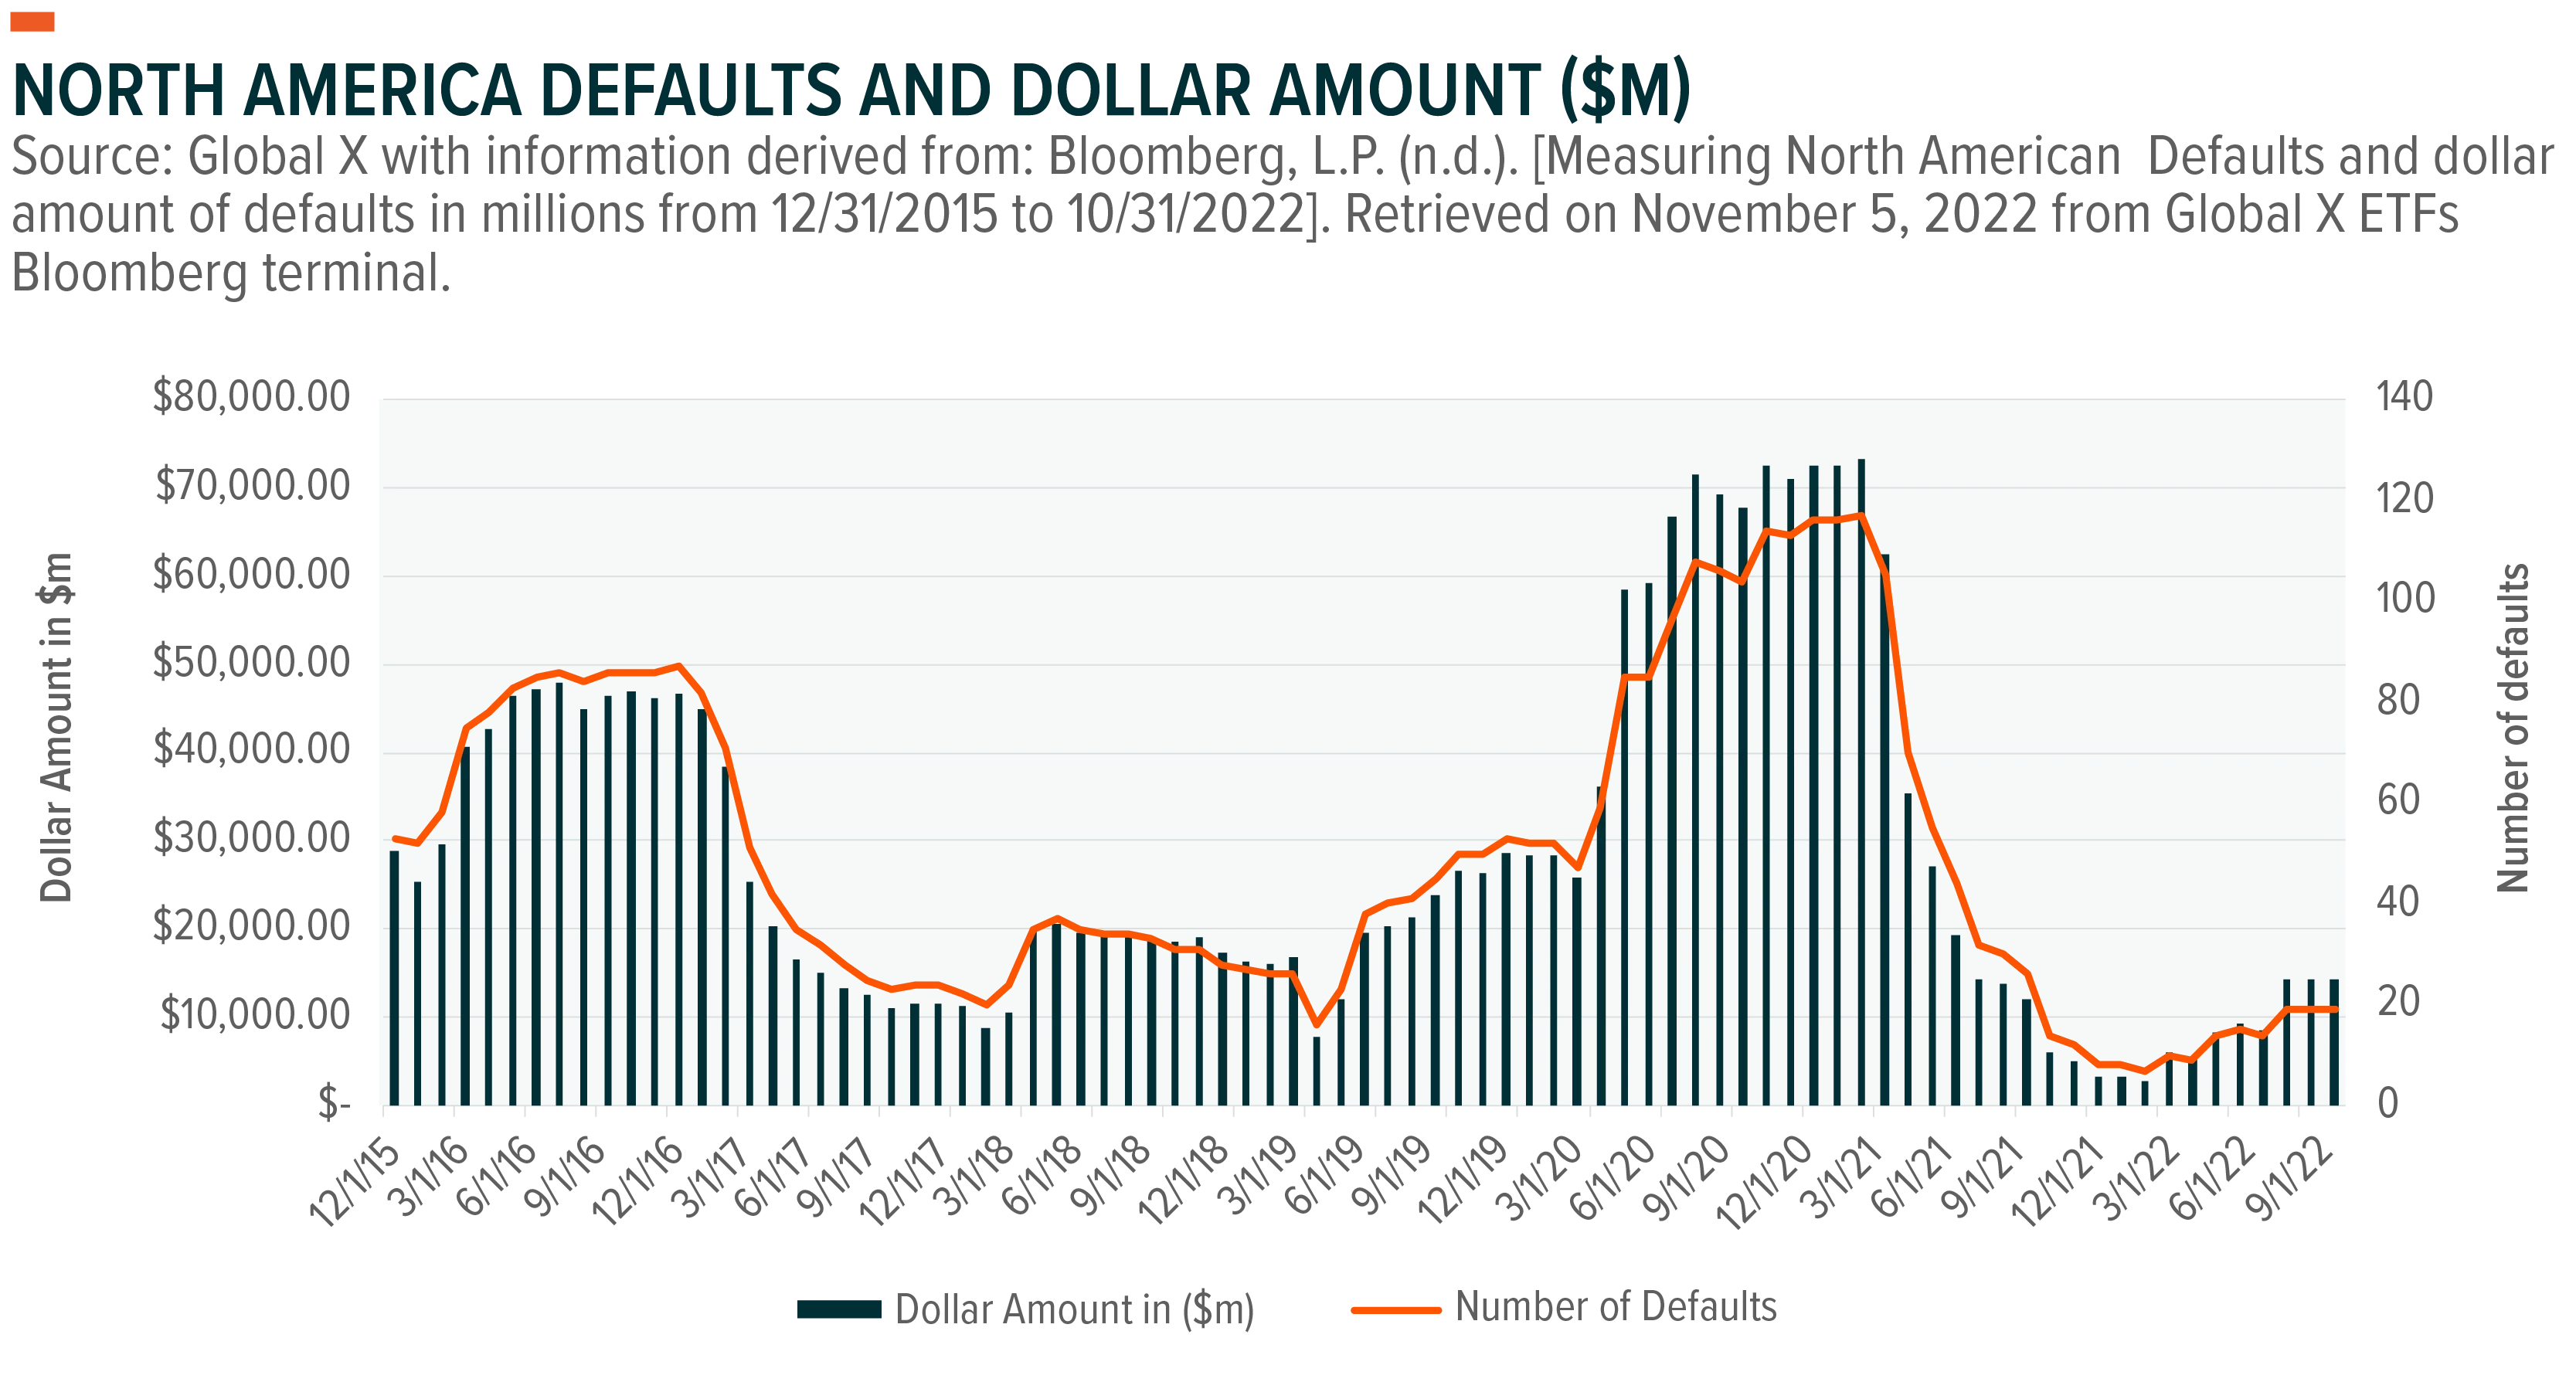
In a year when prices of both equities and traditional fixed income investments have fallen in unison, investors started looking at other alternatives to achieve income objectives such as high yield bonds. As these bonds have a higher probability of defaulting based on credit ratings, high yield issuers must pay a higher coupon payment to the bondholder or lender to encourage investment. The issue is that in a period of low growth and tight financial conditions we are starting to see the cracks forming within the high yield credit market. The chart below highlights the recent rise in North American defaults, which may signal a shift from interest rate risk to credit risk as option adjusted spreads tend to rise in parallel with rising defaults. As mentioned, Defaults have slowly started ticking up, potentially raising the risks of high yield bonds.
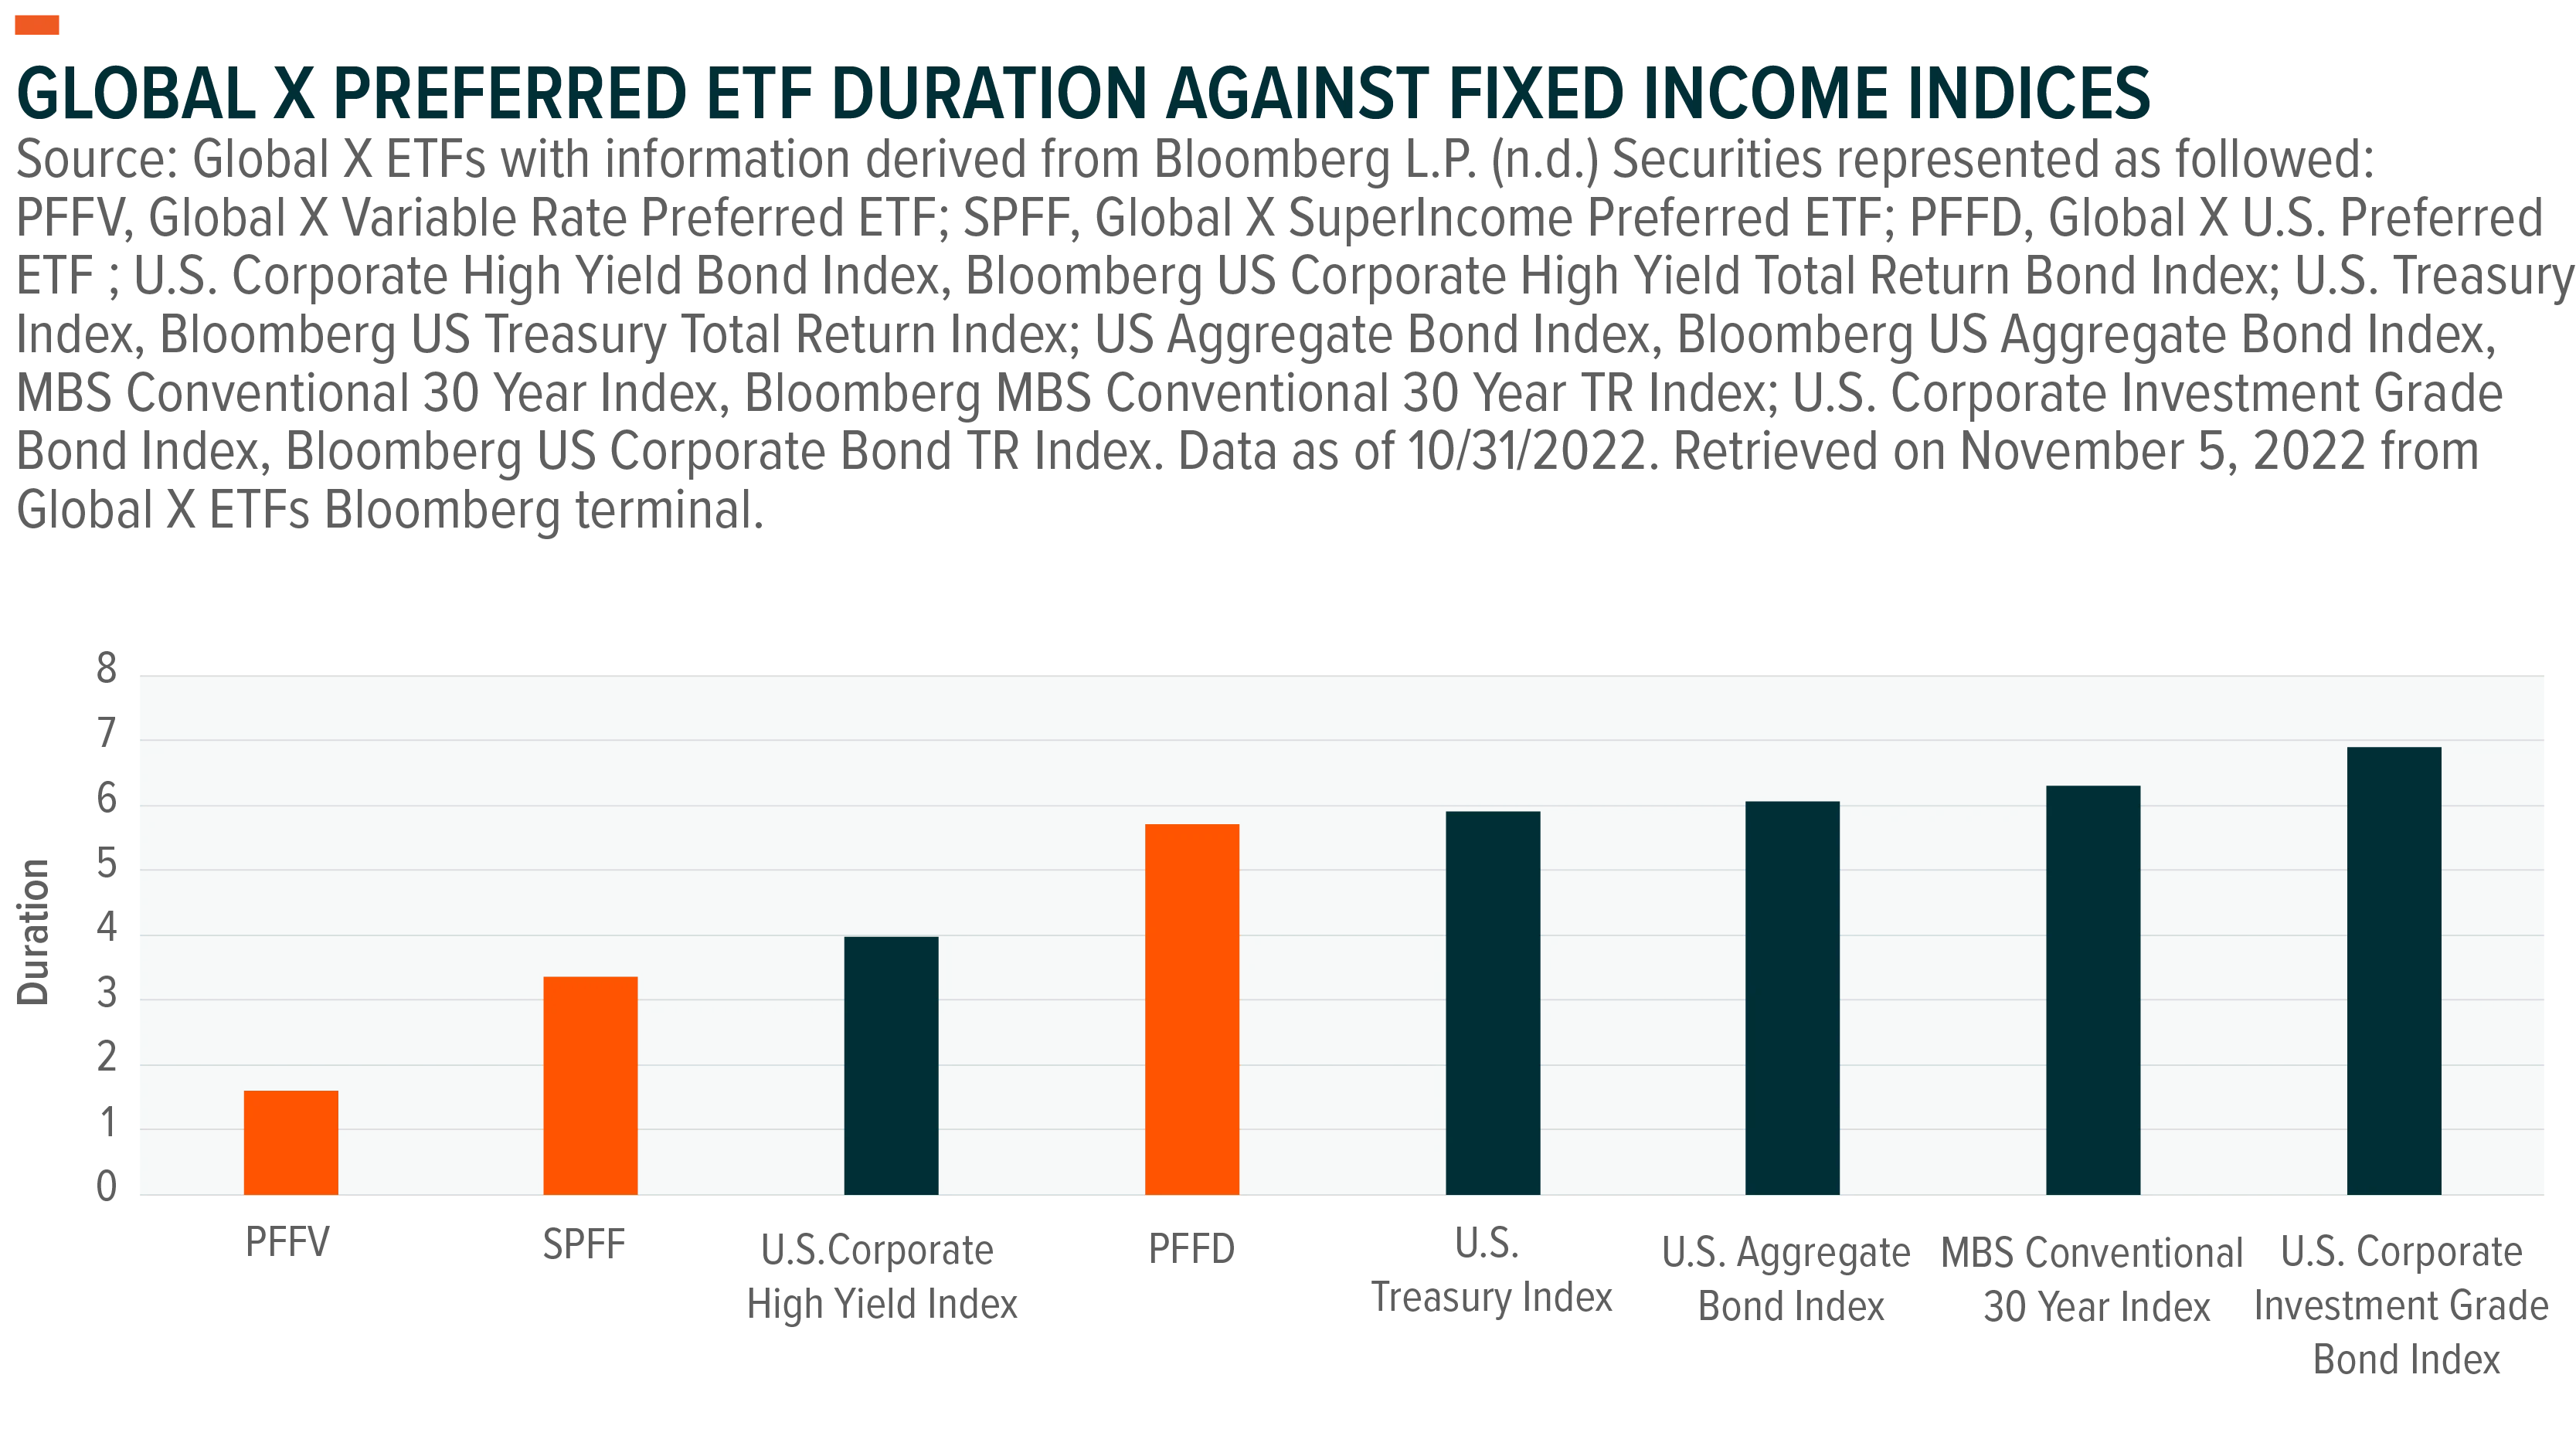
Preferred stock may be an alternative for income investors, as preferred stock tends to produce a higher yield than their other fixed income counterparts with similar credit rating, lowering the overall duration (shown below). The fact that preferreds are generally issued by large financial institutions and defensive sectors such as utilities, means that these hybrid products should be able to withstand the storm of tighter financial conditions.
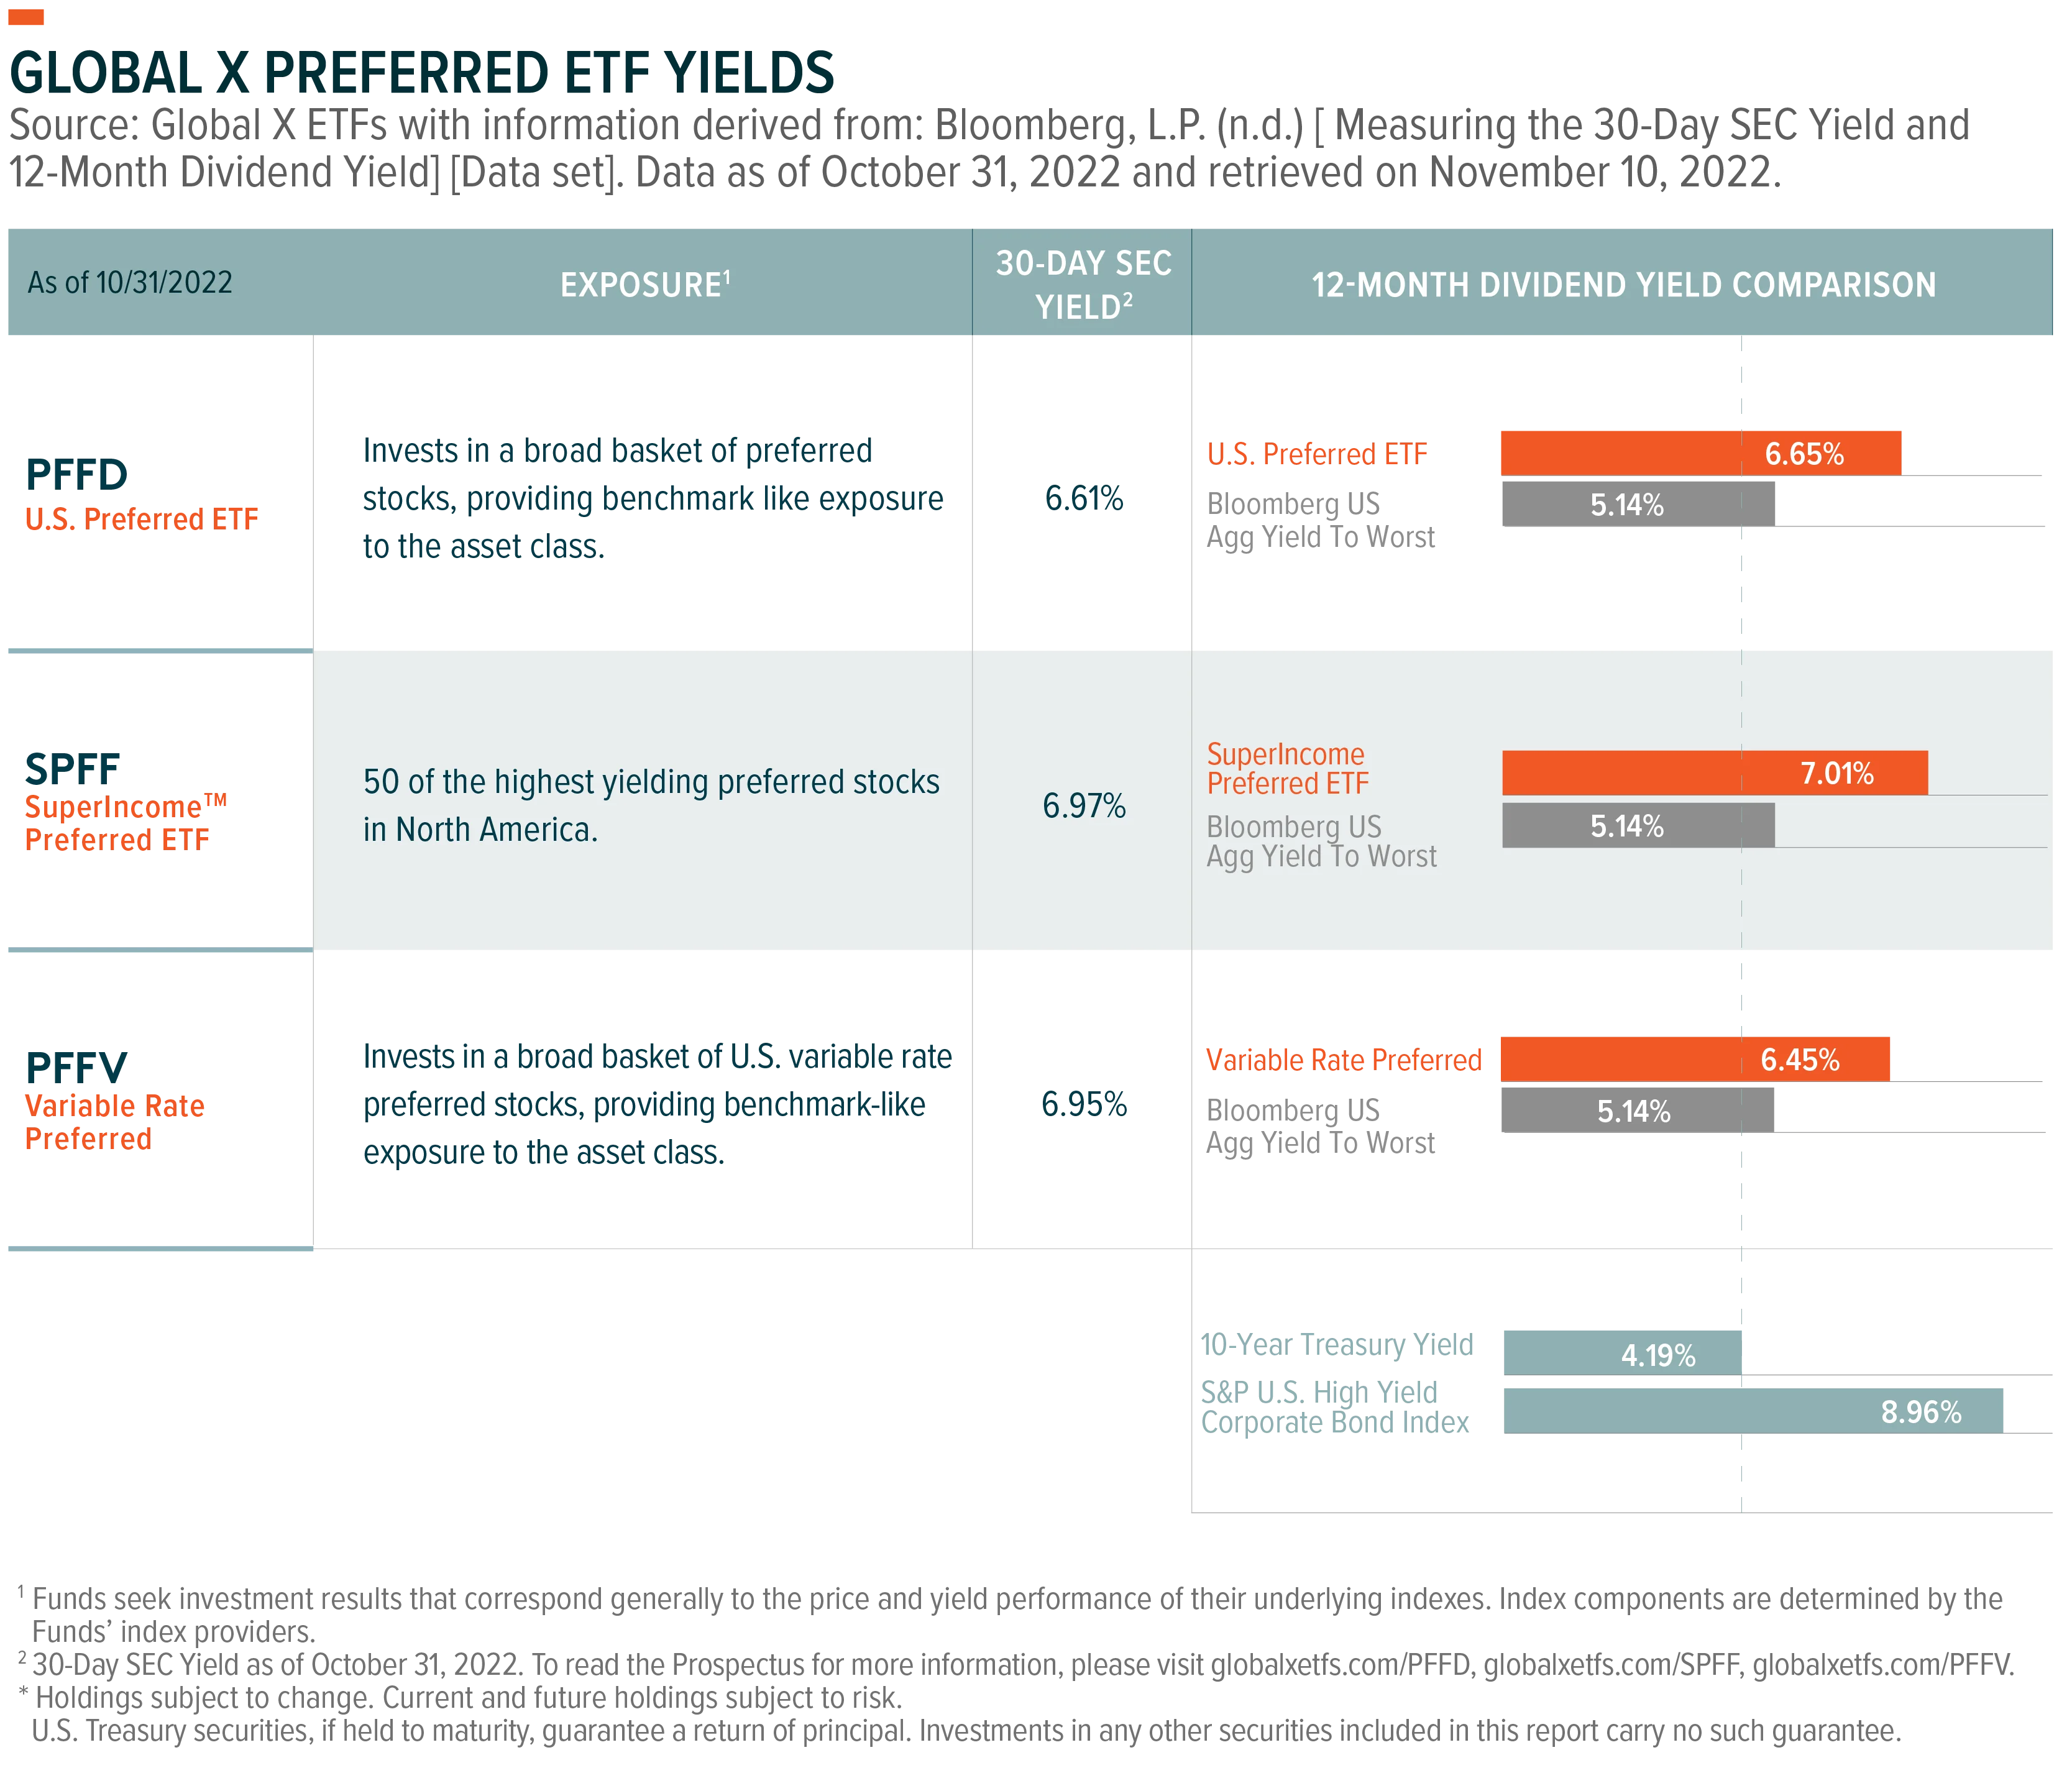
Global X offers three preferred ETFs with exposure that can be implemented in place for floating rate, non-investment grade, and corporate bond exposure.
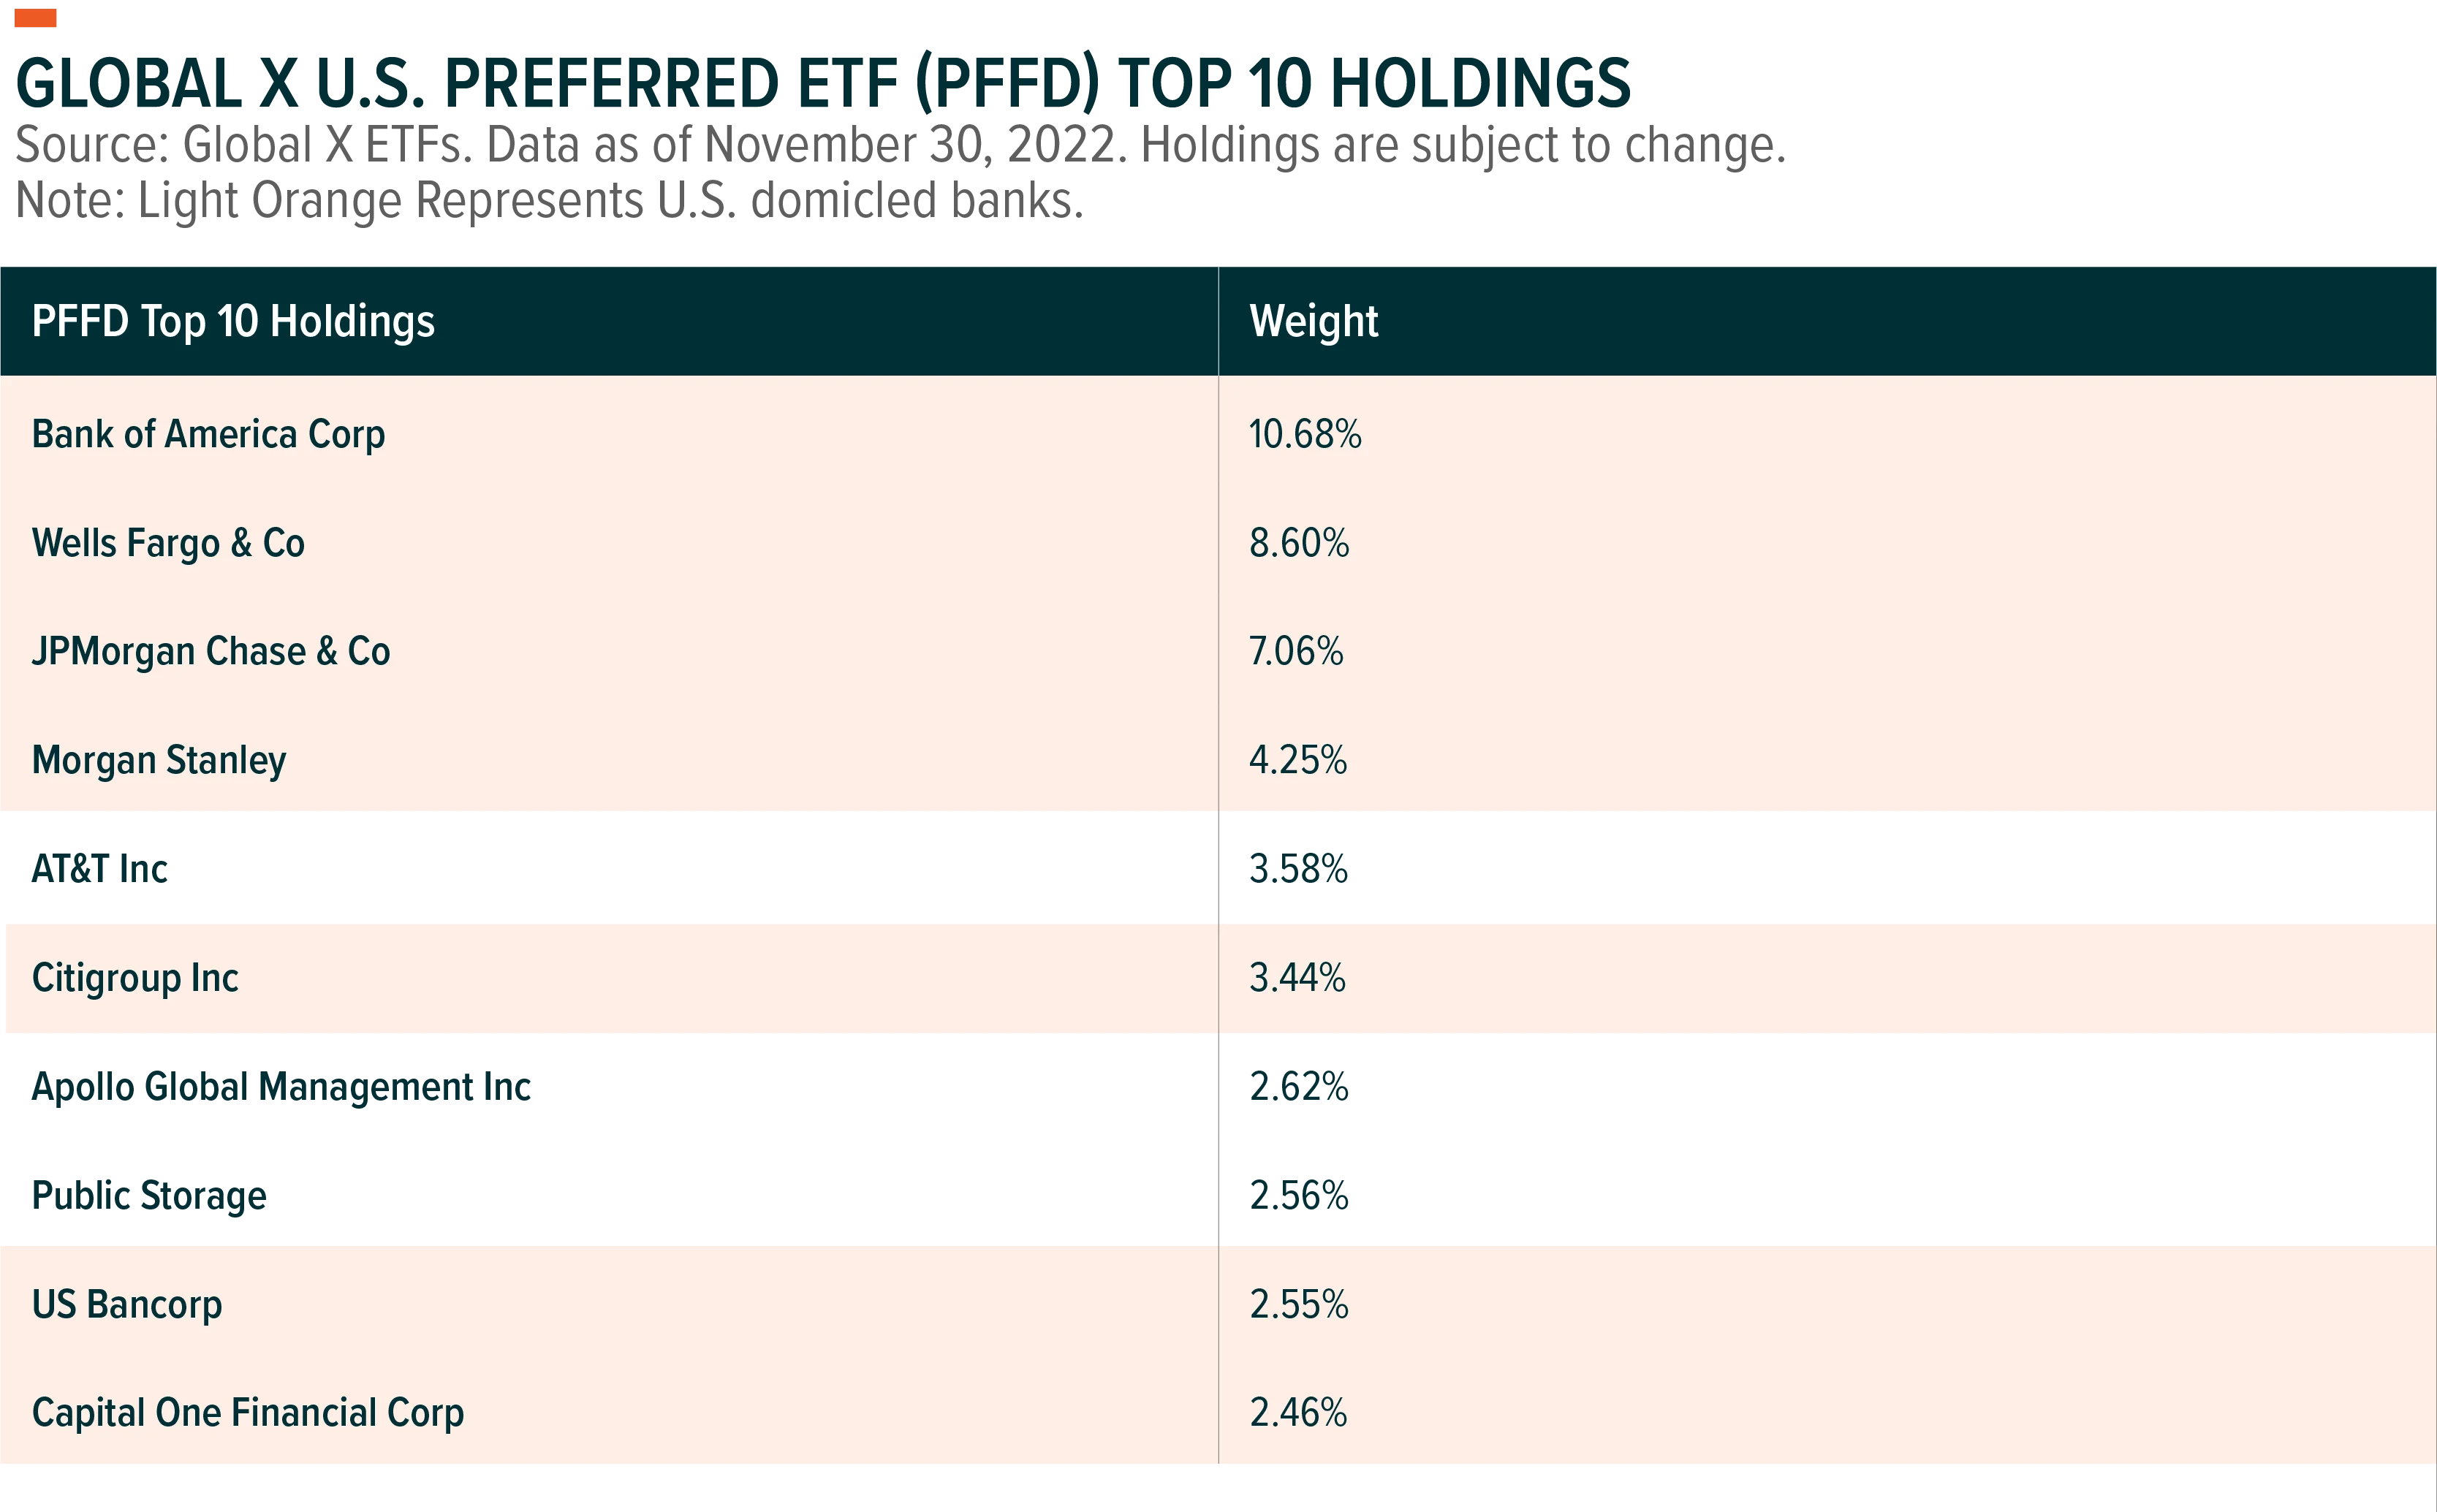
The Global X U.S. Preferred ETF (PFFD) offers investors a diverse basket of U.S. preferred stocks across 109 companies and 247 preferred stocks as of 11/30/2022 and each security must have a rating by Moddy’s, S&P, or Fitch (except convertible preferreds) making it an interesting choice as an alternative for investment grade bond exposure, for investors looking for a potentially higher yield.
For investors looking for a yield potential above PFFD, Global X offers the SuperIncome Preferred ETF (SPFF) may be an enticing solution. The strategy invests in 50 of the highest yielding preferreds in the U.S. and Canada, potentially increasing a portfolio’s yield. The higher yield potential lowers the duration of the fund making it less sensitive towards interest rate moves.
For investors looking for a yield that varies with changes in the risk-free rate allowing for a heightened level of diversification potential relative to traditional fixed income assets, the Global X Variable Rate Preferred ETF (PFFV) may be a viable solution. The Global X Variable Rate Preferred ETF has exposure towards fixed-to-floating rate preferreds. These equity securities pay a fixed dividend amount for a specific period, typically 5 to 10 years.9 Thereafter, they switch to a floating rate dividend on a predetermined schedule.
Performance quoted represents past performance, which is not a guarantee of future results. The investment return and principal value of an investment will fluctuate so that an investor's shares, when sold or redeemed, may be worth more or less than their original cost and current performance may be lower or higher than the performance quoted. For each fund’s prospectus and performance current to the most recent month- and quarter-end, please click the fund name below.
Conclusion
The omnipresent ramp up in companies' cost of capital, as rising risk-free rates continues, means that savvy income investors need to be on the lookout for the impact on their income portfolios. Broader fixed income assets may face continued pressure as the Fed keeps the gas on the peddle albeit with less pressure. TIPS offer investors the potential to monetize higher than expected inflation releases, as the market may be discounting the difficulty of reversing sticky inflation. Covered Call and Collar strategies can help mitigate the risk of dividend cuts, as option premiums historically rise during periods of increased volatility.
Related ETFs
IRVH – Global X Interest Rate Volatility & Inflation Hedge ETF
PFFD – Global X U.S. Preferred ETF
SPFF- Global X SuperIncome Preferred ETF
PFFV- Variable Rate Preferred ETF
XRMI- Global X S&P 500 Risk Managed Income ETF
QRMI - Global X NASDAQ 100 Risk Managed Income ETF
QYLD - Global X NASDAQ 100 Covered Call ETF
XYLD - Global X S&P 500 Covered Call ETF
RYLD - Global X Russell 2000 Covered Call ETF
Click the fund name above to view current performance and holdings. Holdings are subject to change. Current and future holdings are subject to risk.