
Content loaded
Get the latest news and updates from our team.
Copyright © 2026 Global X. All rights reserved.
SEI Investments Distribution Co. (1 Freedom Valley Drive, Oaks, PA, 19456) is the distributor for the Global X Funds.
Check the background of SIDCO and Global X's Registered Representatives on FINRA's BrokerCheck.
The Global X Income Outlook for Q2 2023 can be viewed here. This report seeks to provide macro-level data and insights across several income-oriented asset classes and strategies.
The first quarter of 2023 sent a sign of mixed signals amidst increasing volatility in the banking sector as depositors sought alternative options. All the while, major markets indices across both equity and fixed income markets saw a strong rebound. We spoke last quarter about expectations for interest rates to peak and the potential for a reversal in monetary policy. These trends appear to be materializing when examining the short-term yields of the U.S. treasury interest rate curve. As these trends potentially materialize further, income investors may find equity income strategies with a defensive stance an enticing option.
Short term rates and futures markets are pointing to an eventual reversal in hawkish Federal Reserve monetary policy as investors gauge economic data like inflation and the state of the banking sector.
Uncertainty in the global economy has increased investor interest in companies with strong fundamentals, steady balance sheets, and attractive valuations to supplement equity income portfolios, a trend we believe will continue in the near term.
In periods of elevated uncertainty, market volatility often rises, making the options markets a potentially useful tool to monetize volatility for income focused investors with a risk management lens.
The shape of the yield curve is leading to questions about what the economic outlook could entail, as well as Federal Reserve policy. With the curve firmly inverted, 2-year treasury rates moved past the 4% level while 30-year treasury rates sat at 3.7%.1 2-year U.S. treasury bonds have a demonstrated history of front-running the effective Federal Funds Rate, potentially being a predictor of future Federal Reserve monetary policy. Typically when sharp changes in interest rates occur, there is a larger catalyst behind current trends.
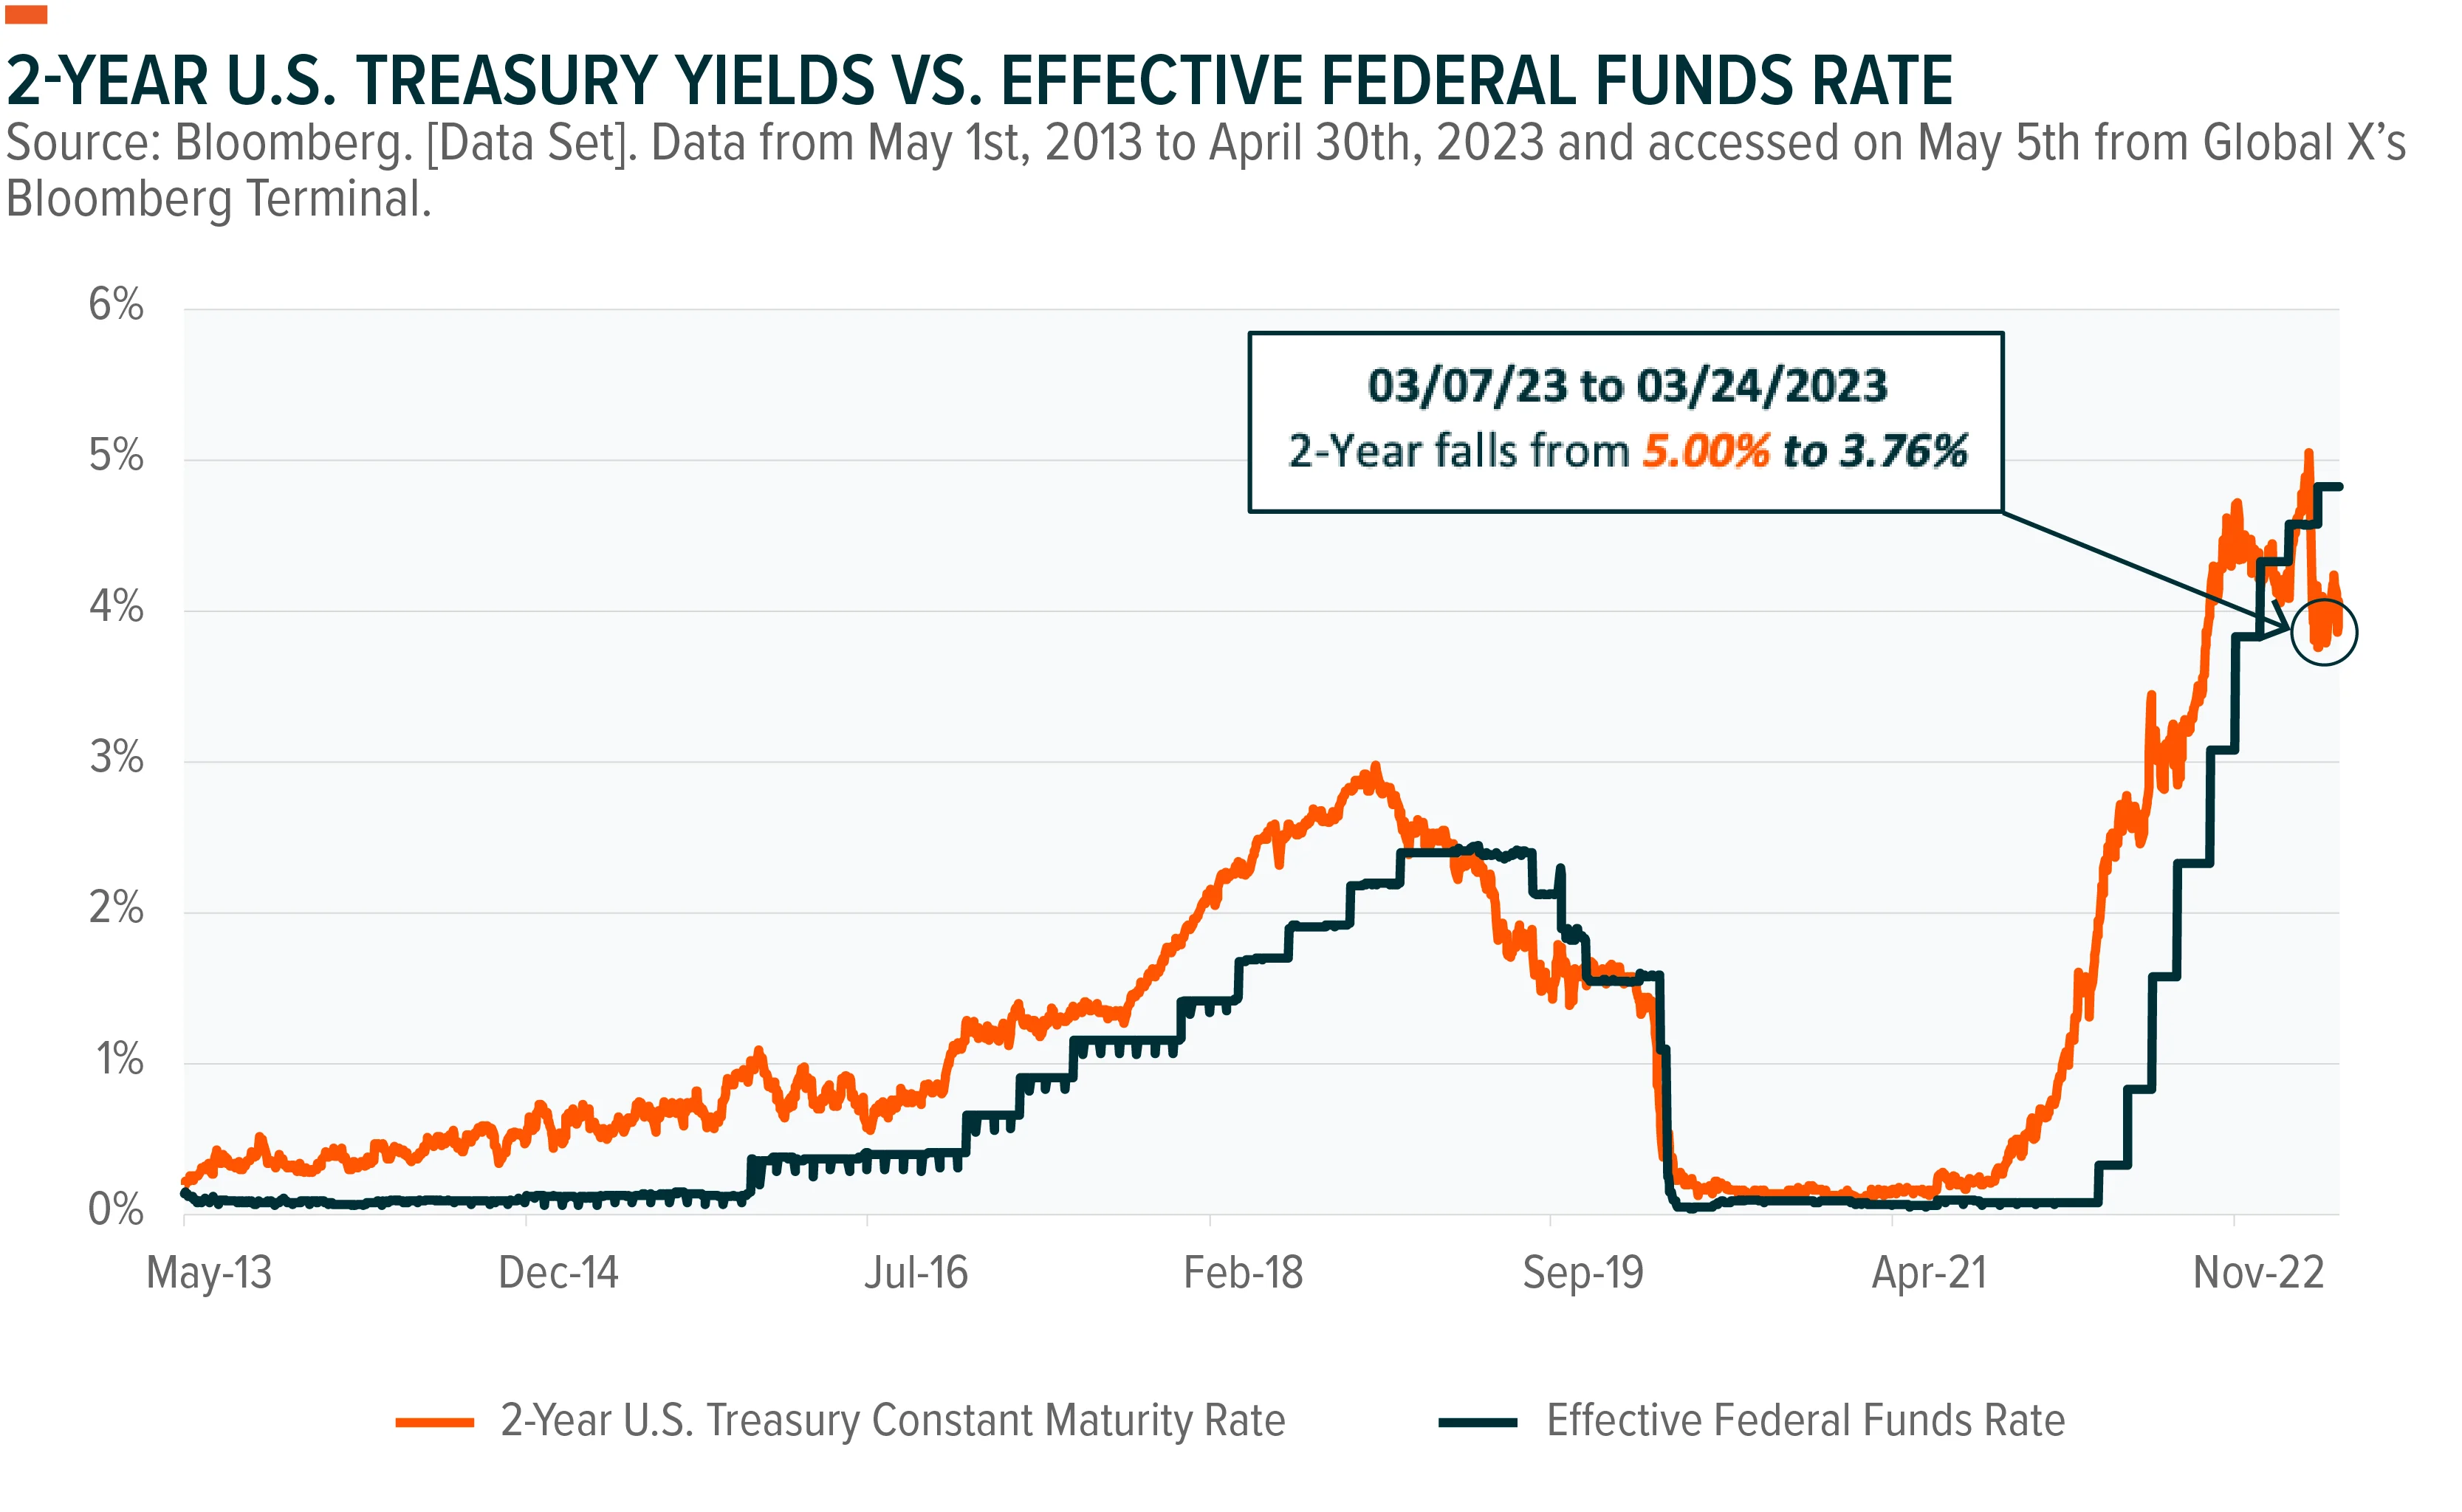
On March 10th, 2023, Silicon Valley Bank (SVB) experienced a significant bank run, leading to the bank being put under receivership of the Federal Deposit Insurance Corporation (FDIC). This means that the agency assumed total control over the failed bank. By March 24th, 2-year treasury yields had fallen over 100 basis points. This may indicate that the market believed the Federal Reserve may continue to soften its monetary policy towards a 2023 year-end 4.5% federal funds rate, implied by futures markets, as of 04.30.2023.2,3 As the ICE BofA MOVE Index, a measurement of U.S. Treasury rate implied volatility, traded 61% above its 5-year average as of 04.30.2023,equity income investors, in particular, may want to seek strategies that invest in companies with robust balance sheets.4 Strategies monetizing equity market implied volatility from selling options in exchange for a premium is another enticing option.
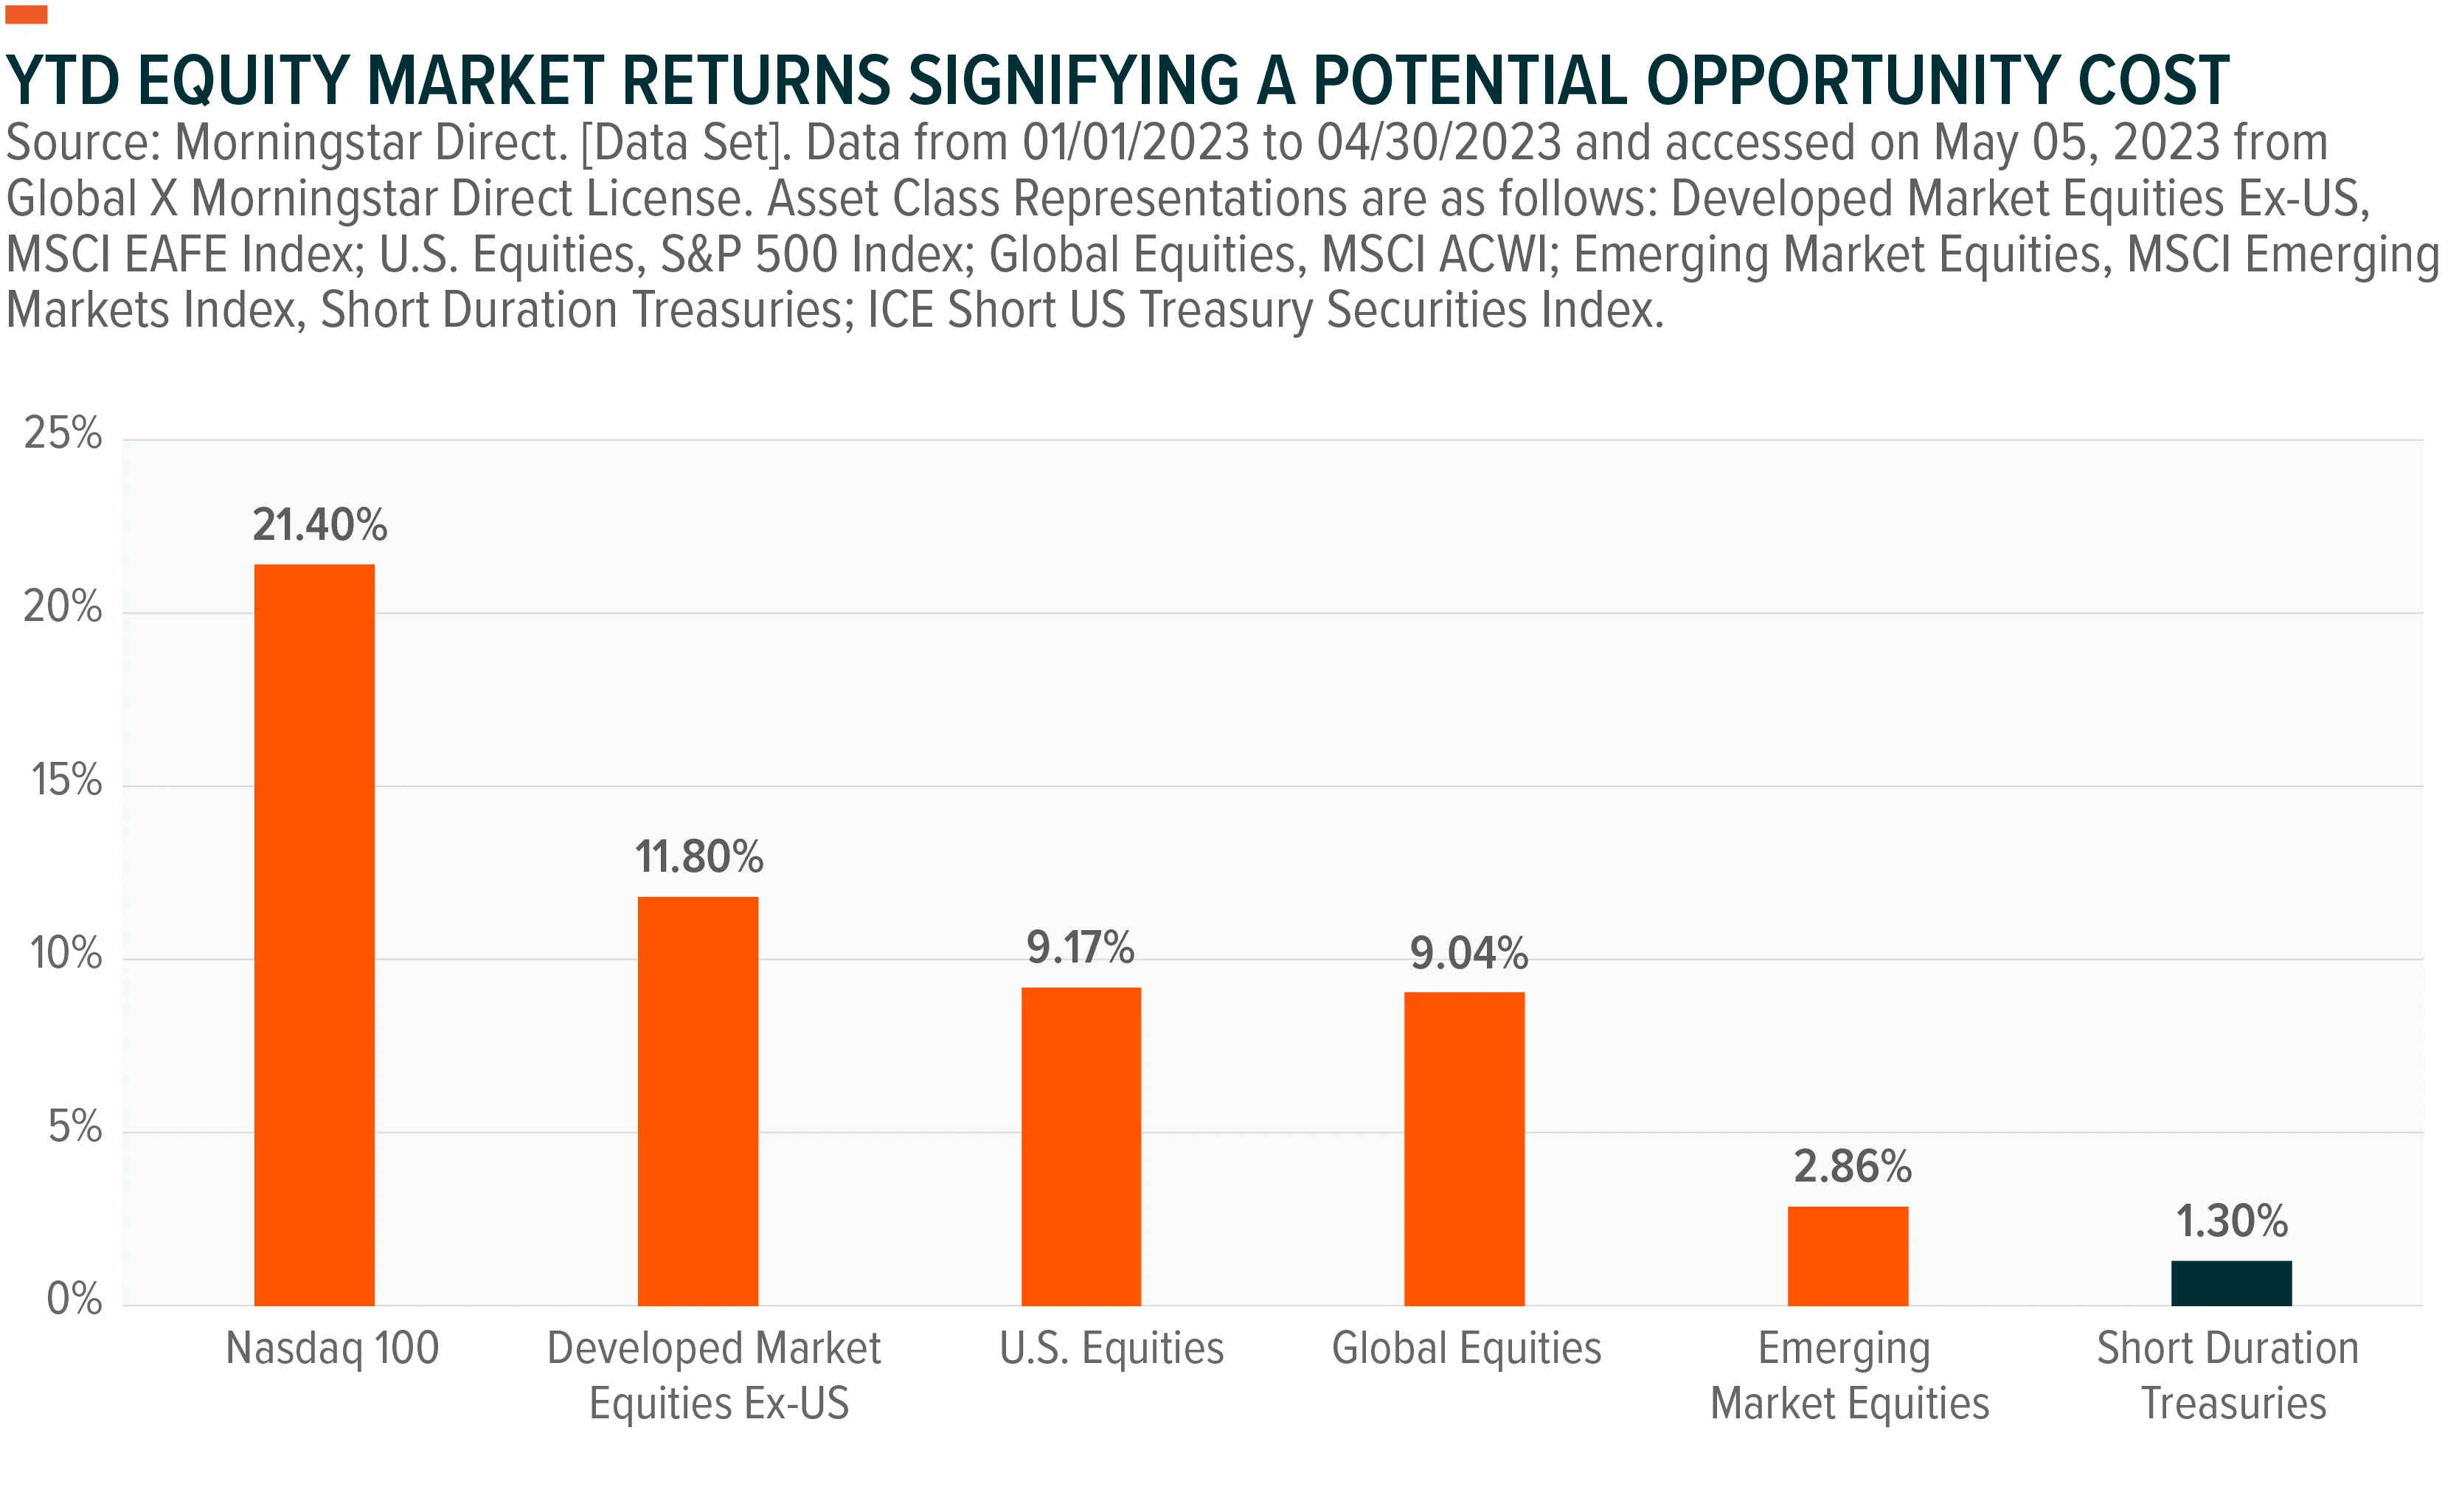
With a 5.1% 3-month U.S. treasury yield, as of 04.30.2023, coupled with no credit risk and minimal interest rate risk, the shorter-end of the yield curve is looking attractive.5 However, there may be an opportunity cost to investors who decide to sit on the sidelines, moving forward. As discussed, rates have likely peaked and are expected to decline moving forward. We believe global equity markets are pricing this in given attractive year-to-date returns, relative to short duration treasuries. Interest rate sensitive sectors such as Technology and Communication Services, which have returned 21% and 25%, respectively, over the same timeframe, are potentially signifying declining rates moving forward as well.6
Past performance is not a guarantee of future results.
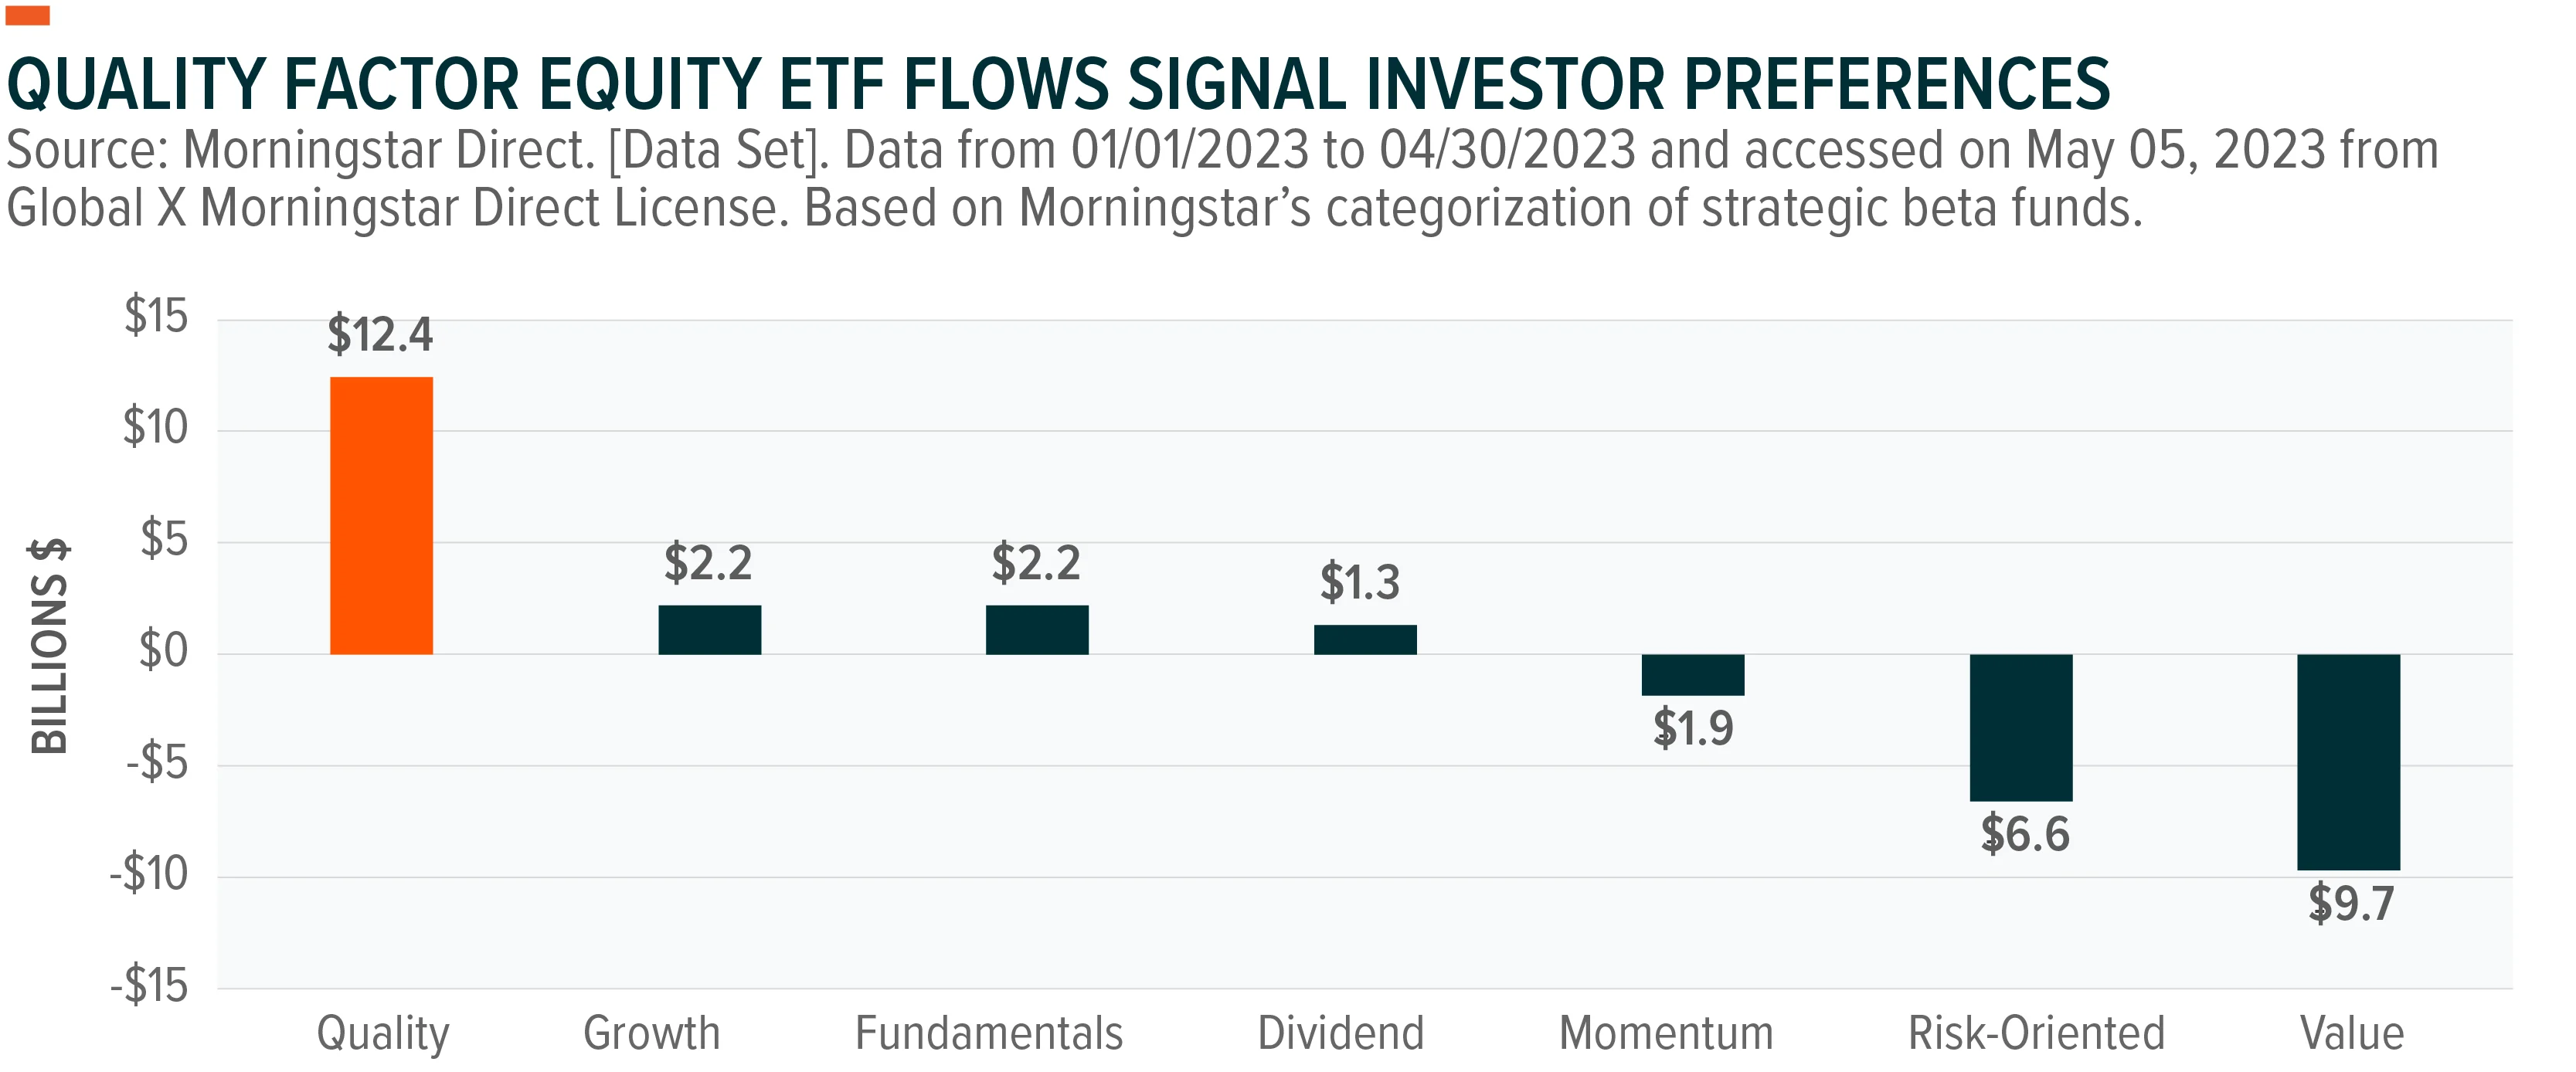
Year-to-date, as of 04/30/2023, U.S.-listed equity strategic beta ETFs utilizing a quality factor screen have seen over $12B in net flows, leading all other single factor strategic beta strategies and speaks to defensive positioning from equity investors.7 Income investors seeking to take a similar stance within their equity dividend portfolios may find that a quality, high dividend equity portfolio offers the potential for both sustainable dividends and growth.
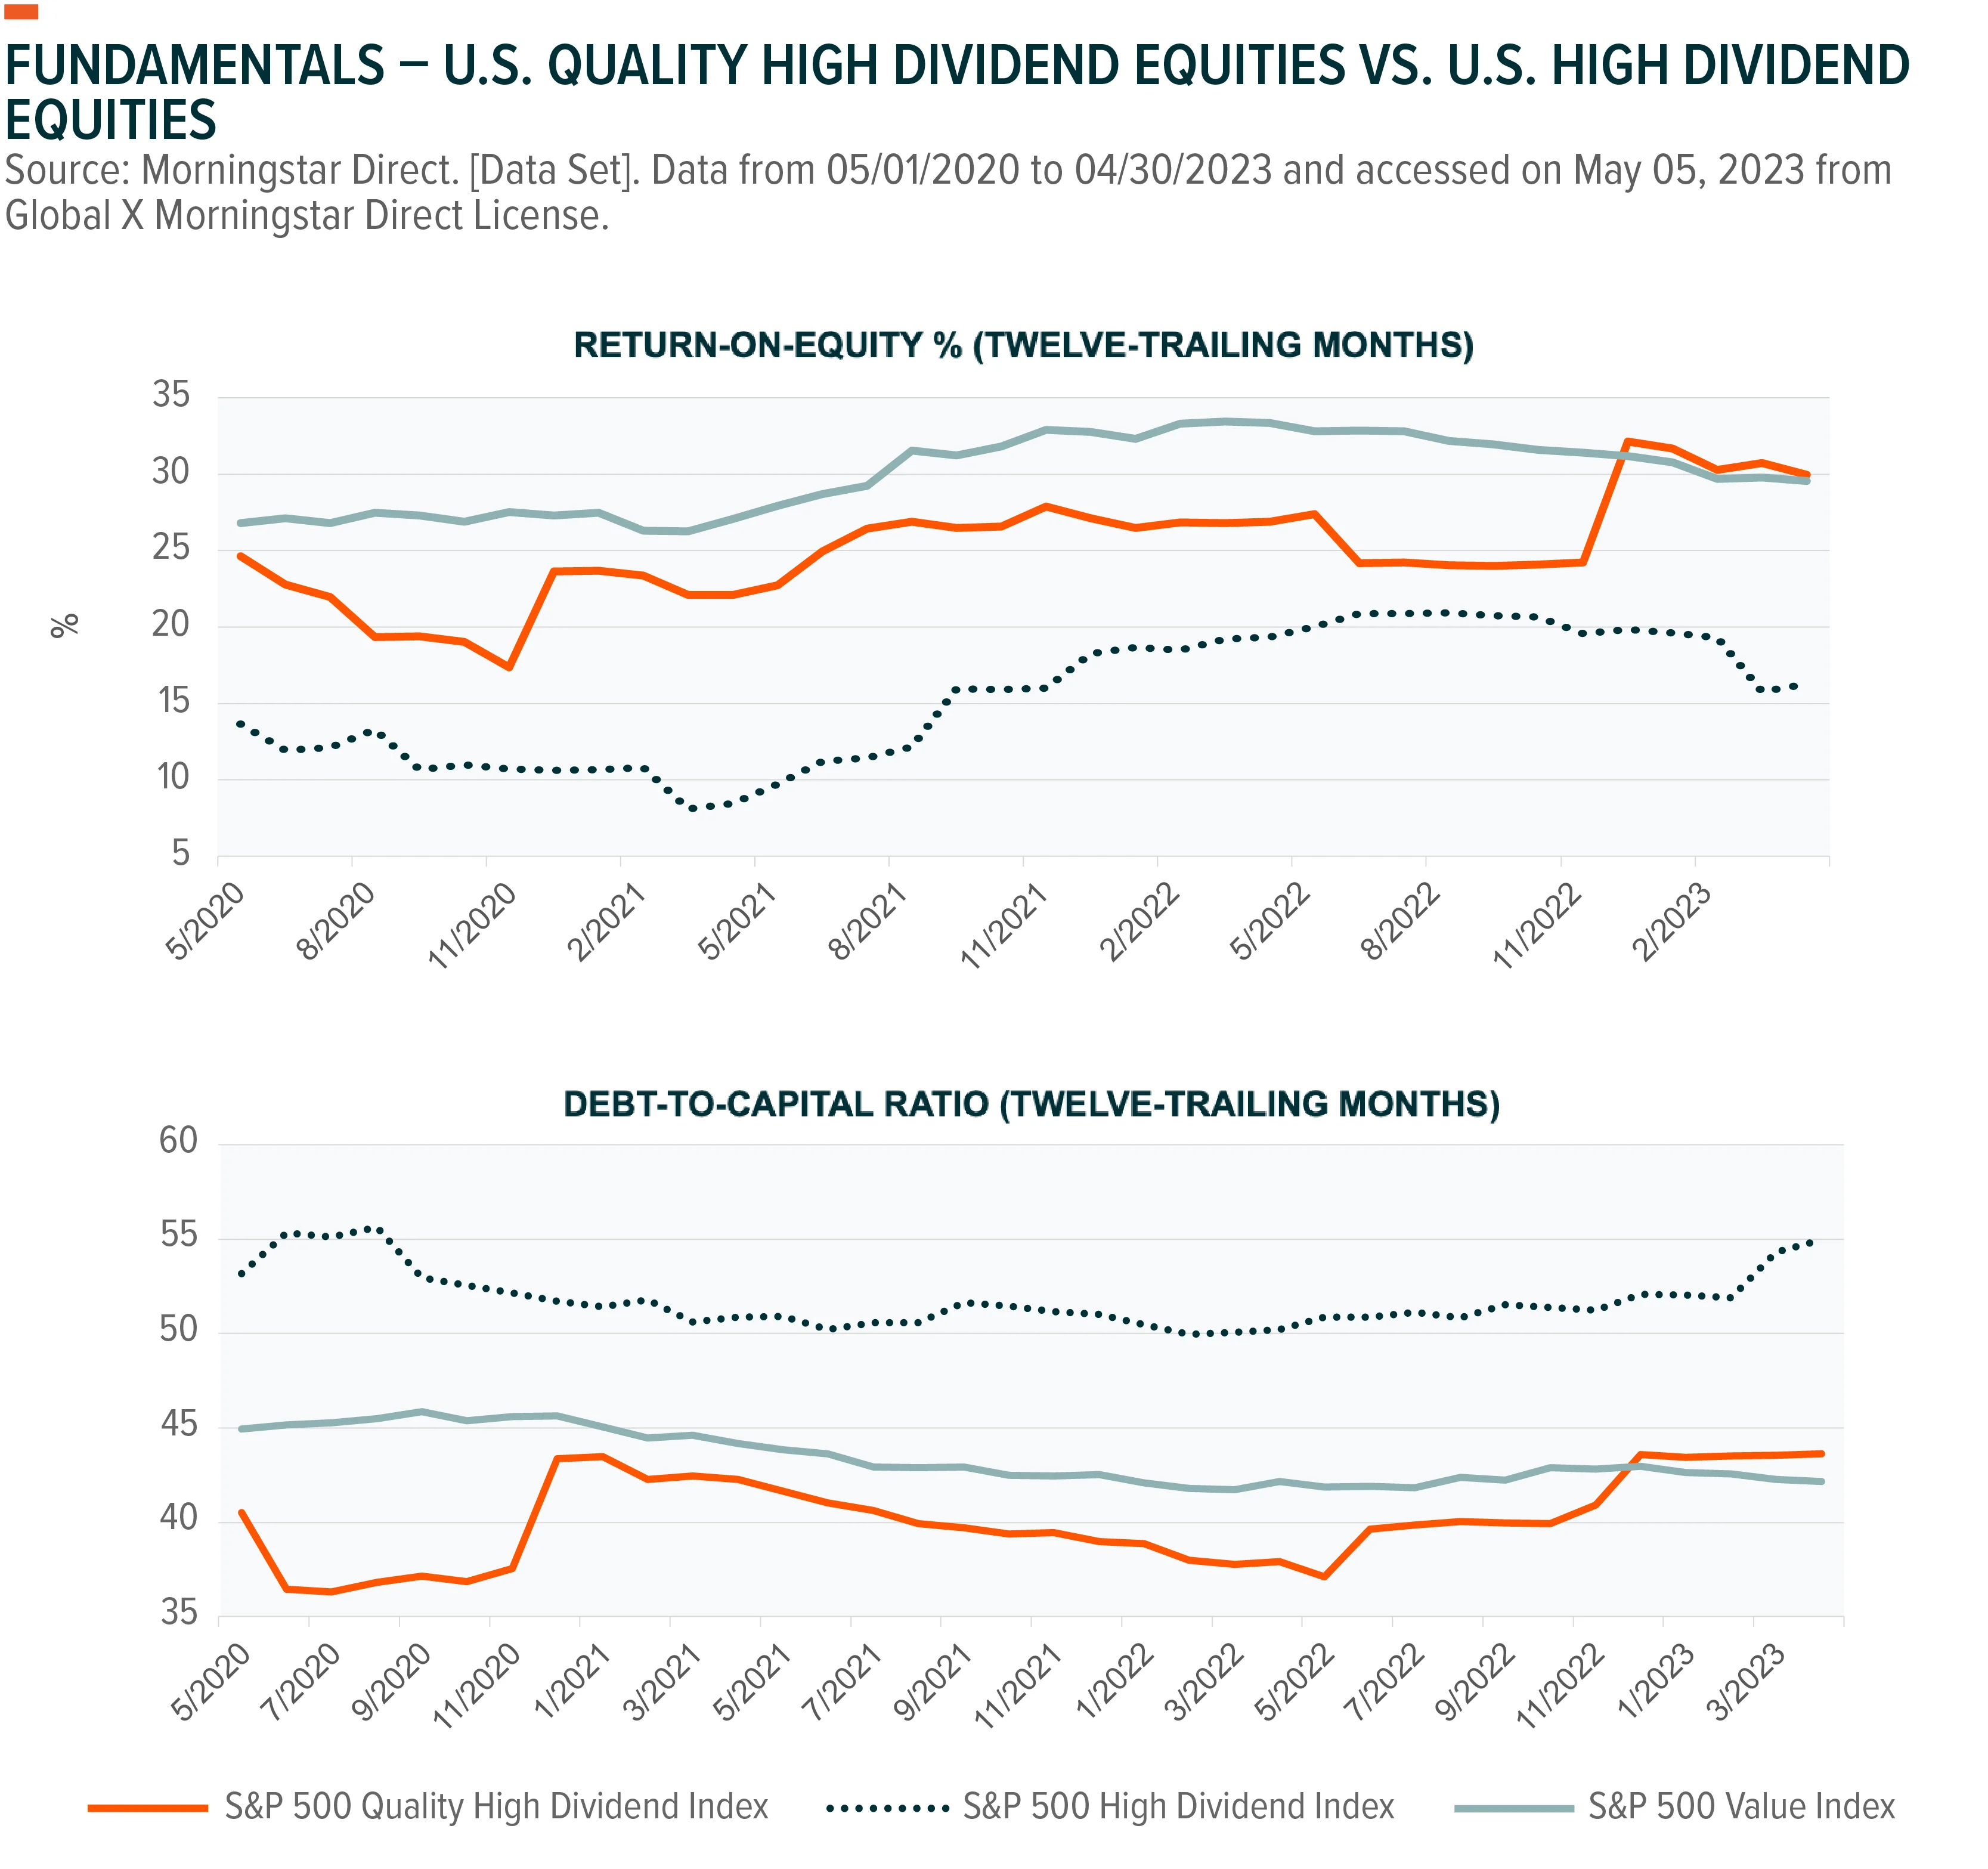
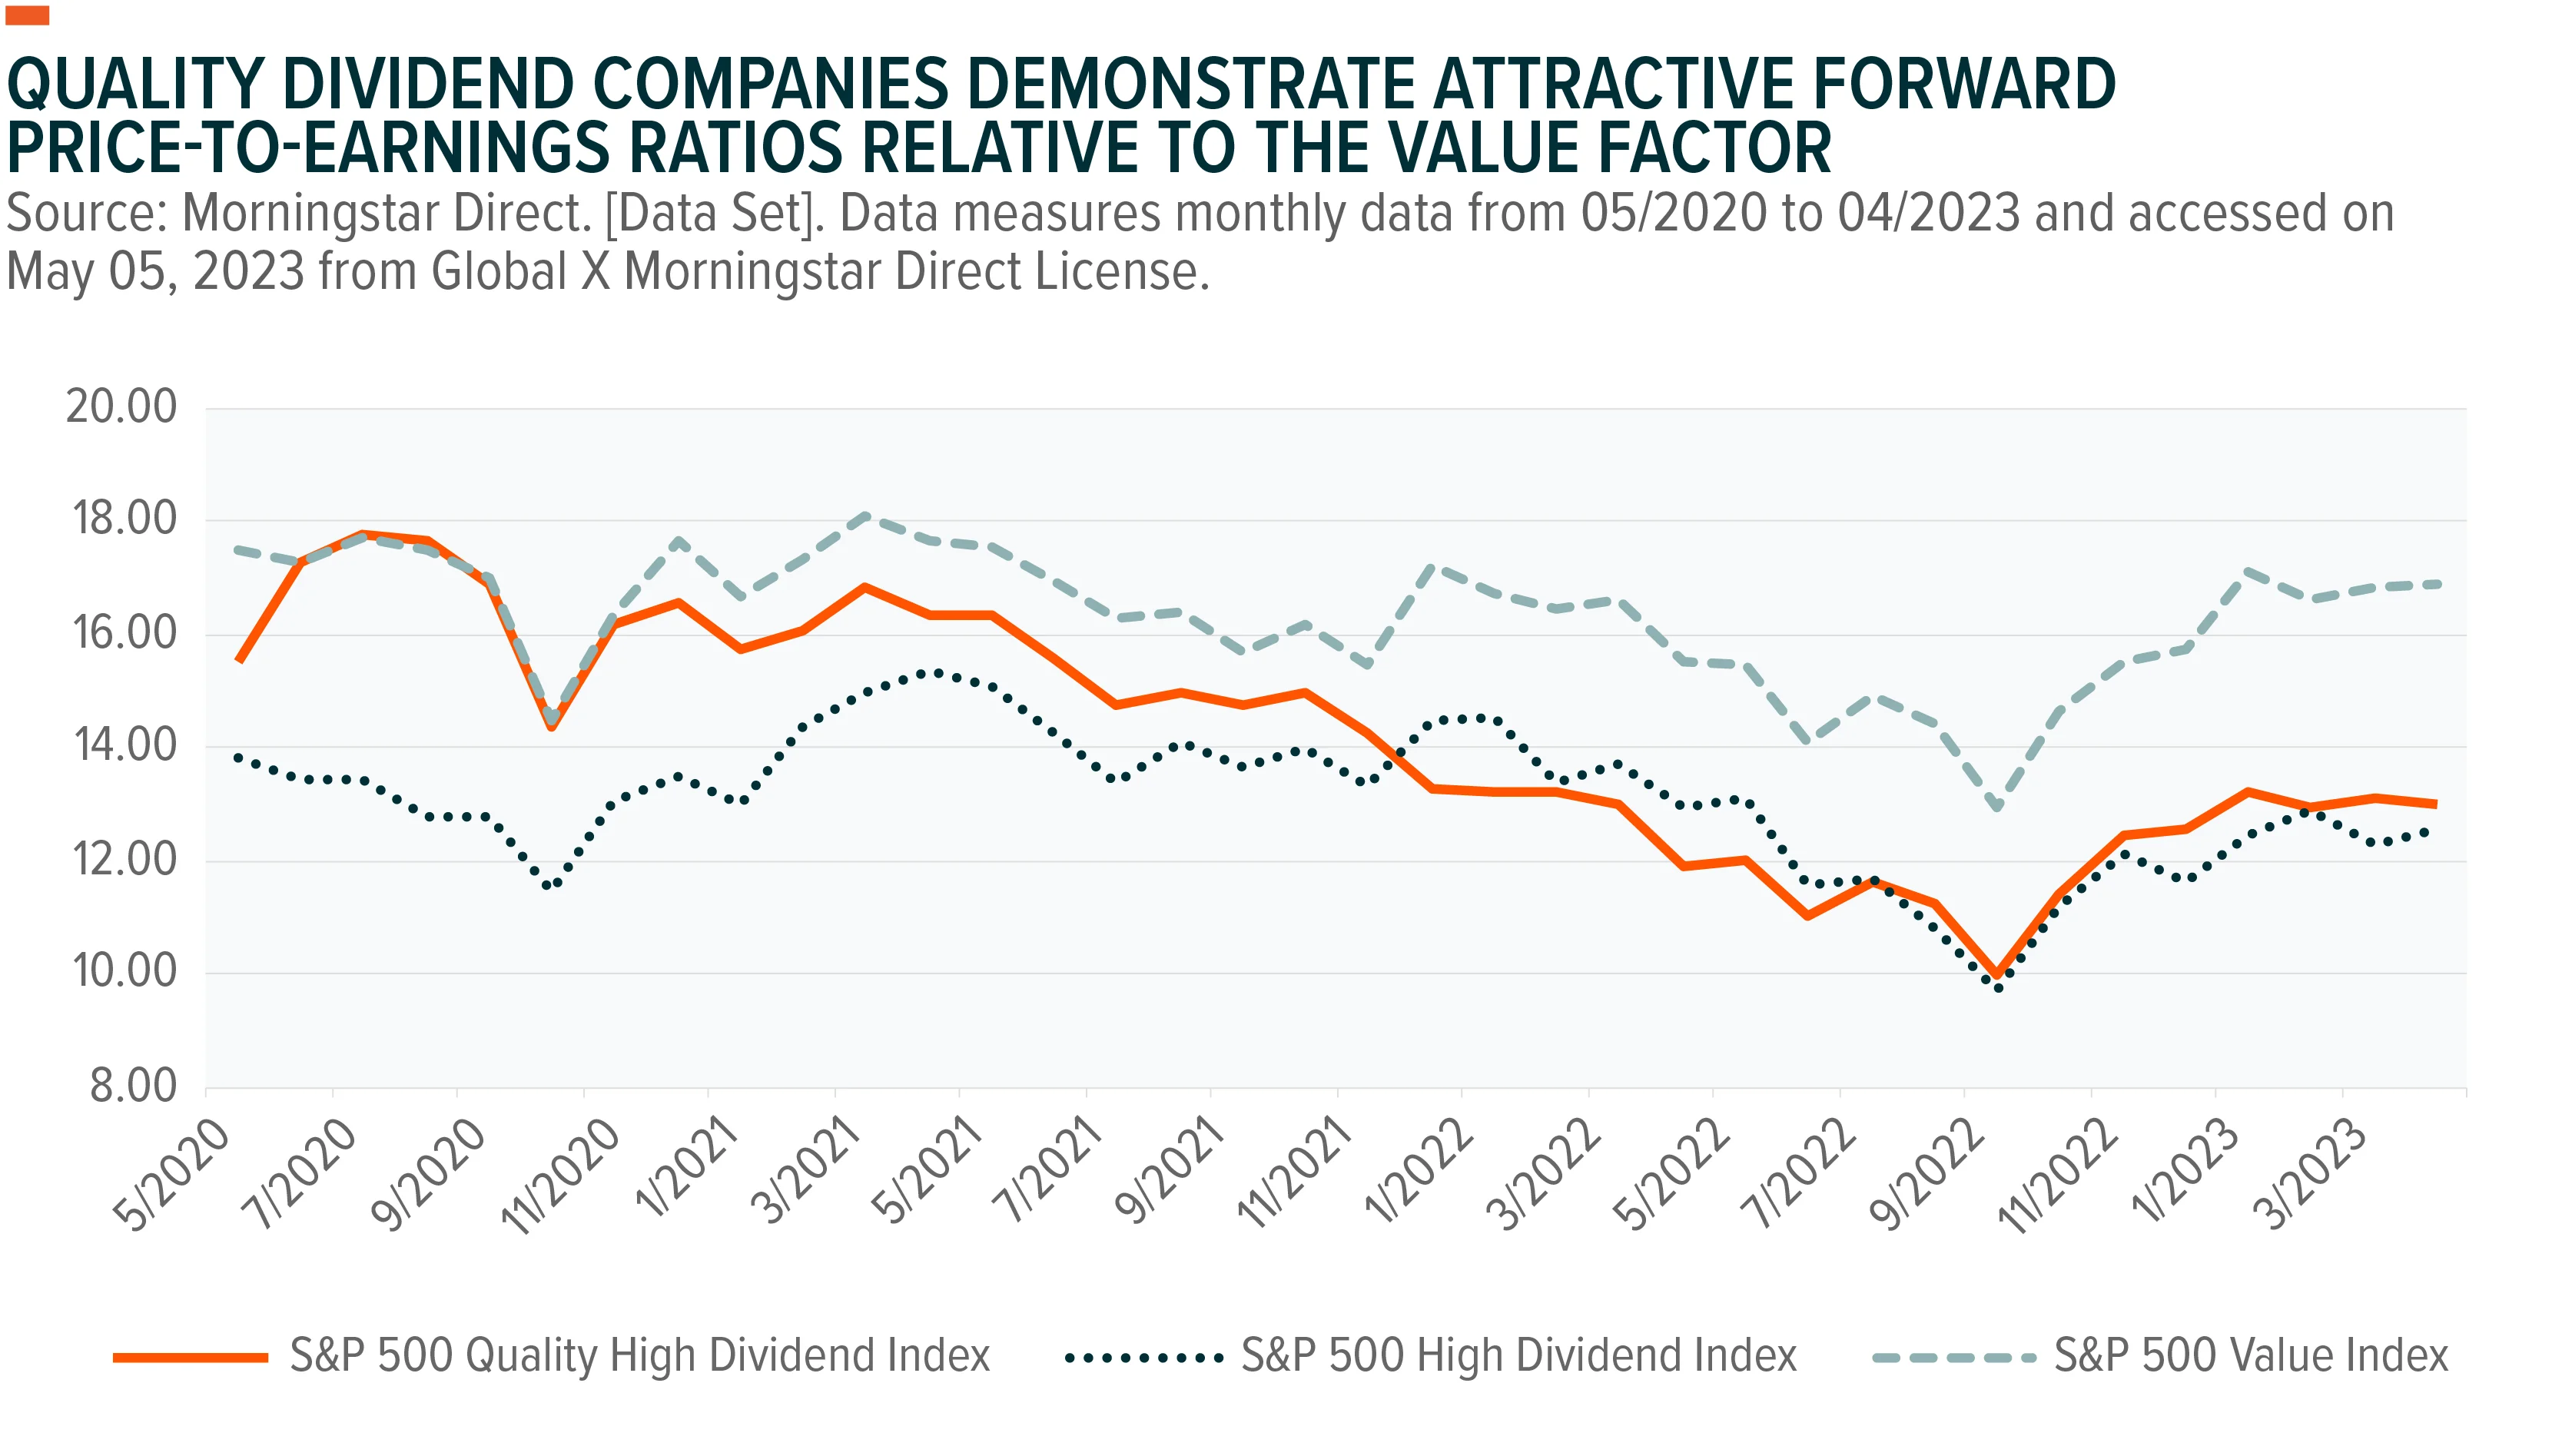
The S&P 500 Quality High Dividend Index has benefitted from the its quality factor screen based on balance sheet ratios such as return on equity, financial leverage, and accruals ratio to define quality characteristics within its constituent selection process. We believe this is key since 463 U.S. equities, a 162% increase in number of companies from the prior year, as of 03.31.2023, saw their dividends decrease over the past twelve trailing months.8 However, 72 out of the 77 constituents in the S&P 500 Quality High Dividend Index increased their dividends during their 2022 fiscal years.9 This same index, which the Global X S&P 500 Quality Dividend ETF (QDIV) seeks to track, exhibited a higher level of return-on-equity with lower leverage relative to that of a high dividend portfolio, represented by the S&P 500 High Dividend Index.10 Higher levels of return-on-equity may translate to higher levels of retained earnings on the balance sheet, therefore, translating to lower levels of needed leverage in an environment of elevated interest rates.
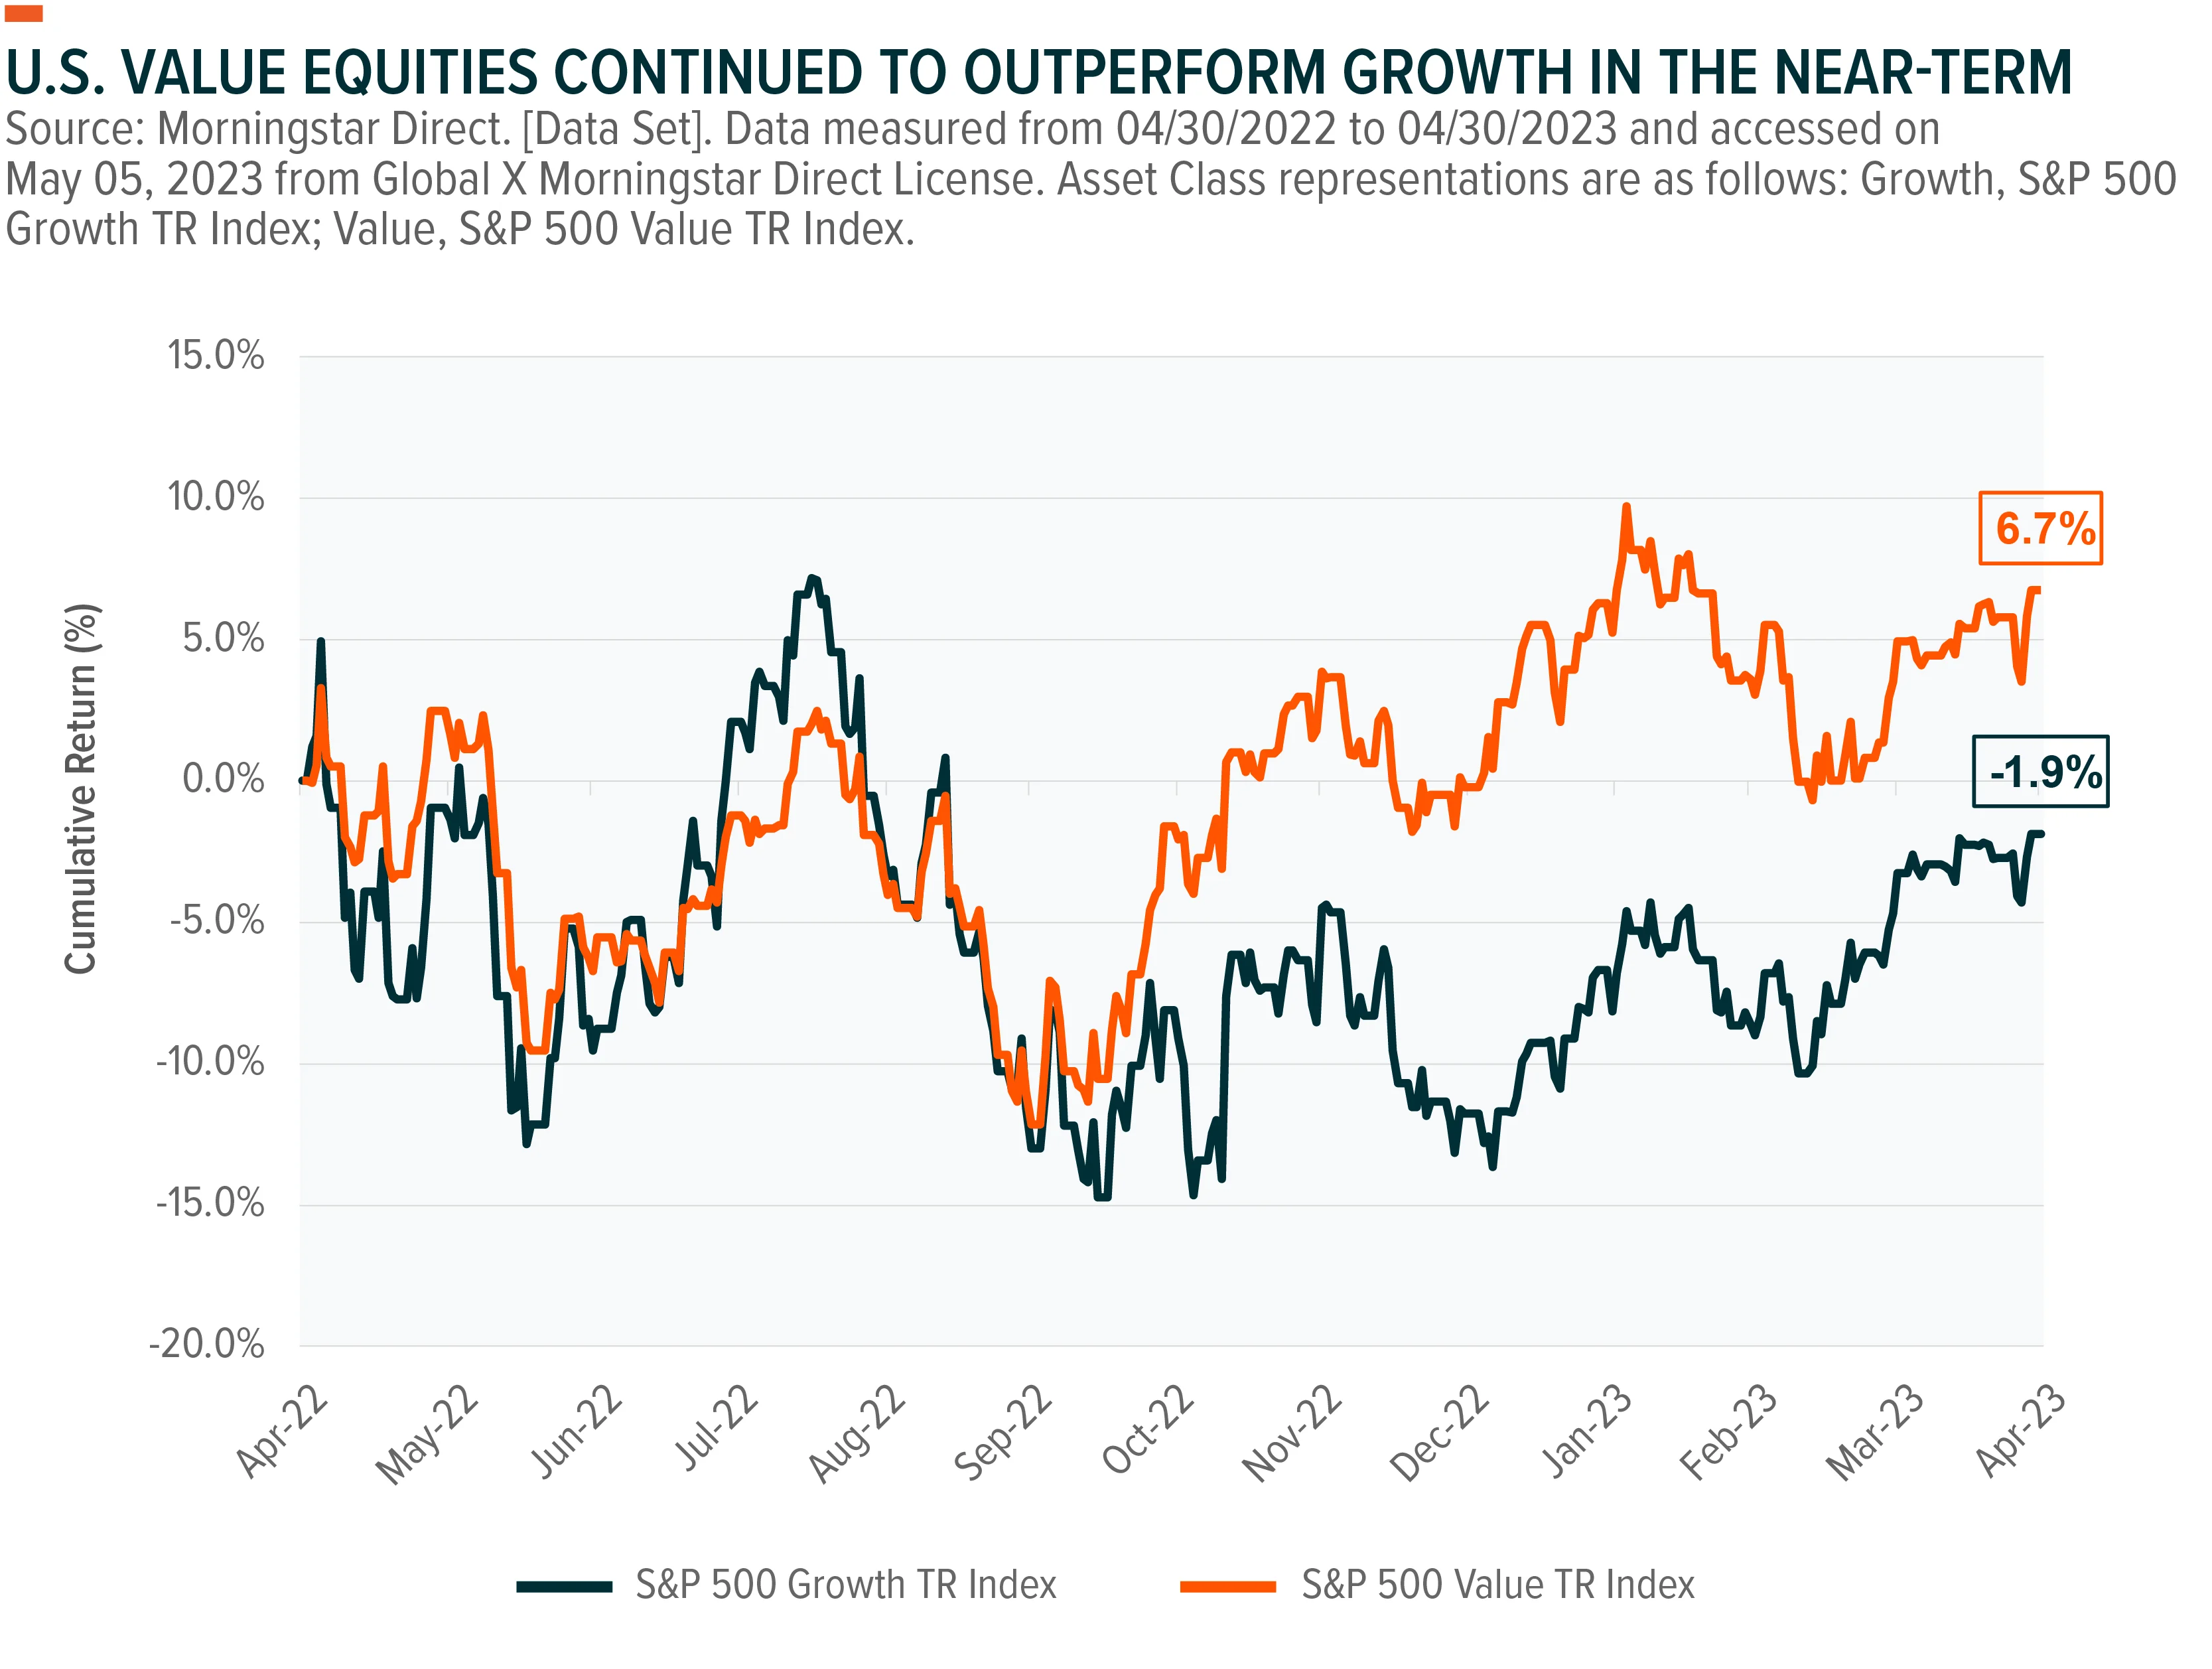
Notably, as interest rates rose significantly in 2022, the value factor, relative to growth equities, outperformed.11 This trend may continue as interest rates show signs of peaking, potentially resulting in a steeper yield curve. This may signal the early stages of economic expansion in the longer-term, allowing the value factor, a pro-cyclical factor, to potentially outperform. Since the recent collapse of Silicon Valley Bank, the yield difference between 10-year U.S. treasuries and 2-year U.S. treasuries (“2s10s”) has steepened, signifying this.12
Past performance is not a guarantee of future results.
Higher dividend yielding strategies tend to exhibit a level of exposure to the value factor. Historically, companies that pay high dividends relative to peers are more likely to be in the more mature phase of their business cycle in which less earnings are retained but distributed to shareholders in the form of a dividend. Quality dividend companies generally maintain similar levels of exposure to this factor too while simultaneously offering a higher chance of avoiding potential value traps associated with high dividend strategies that do not implement a quality screen.
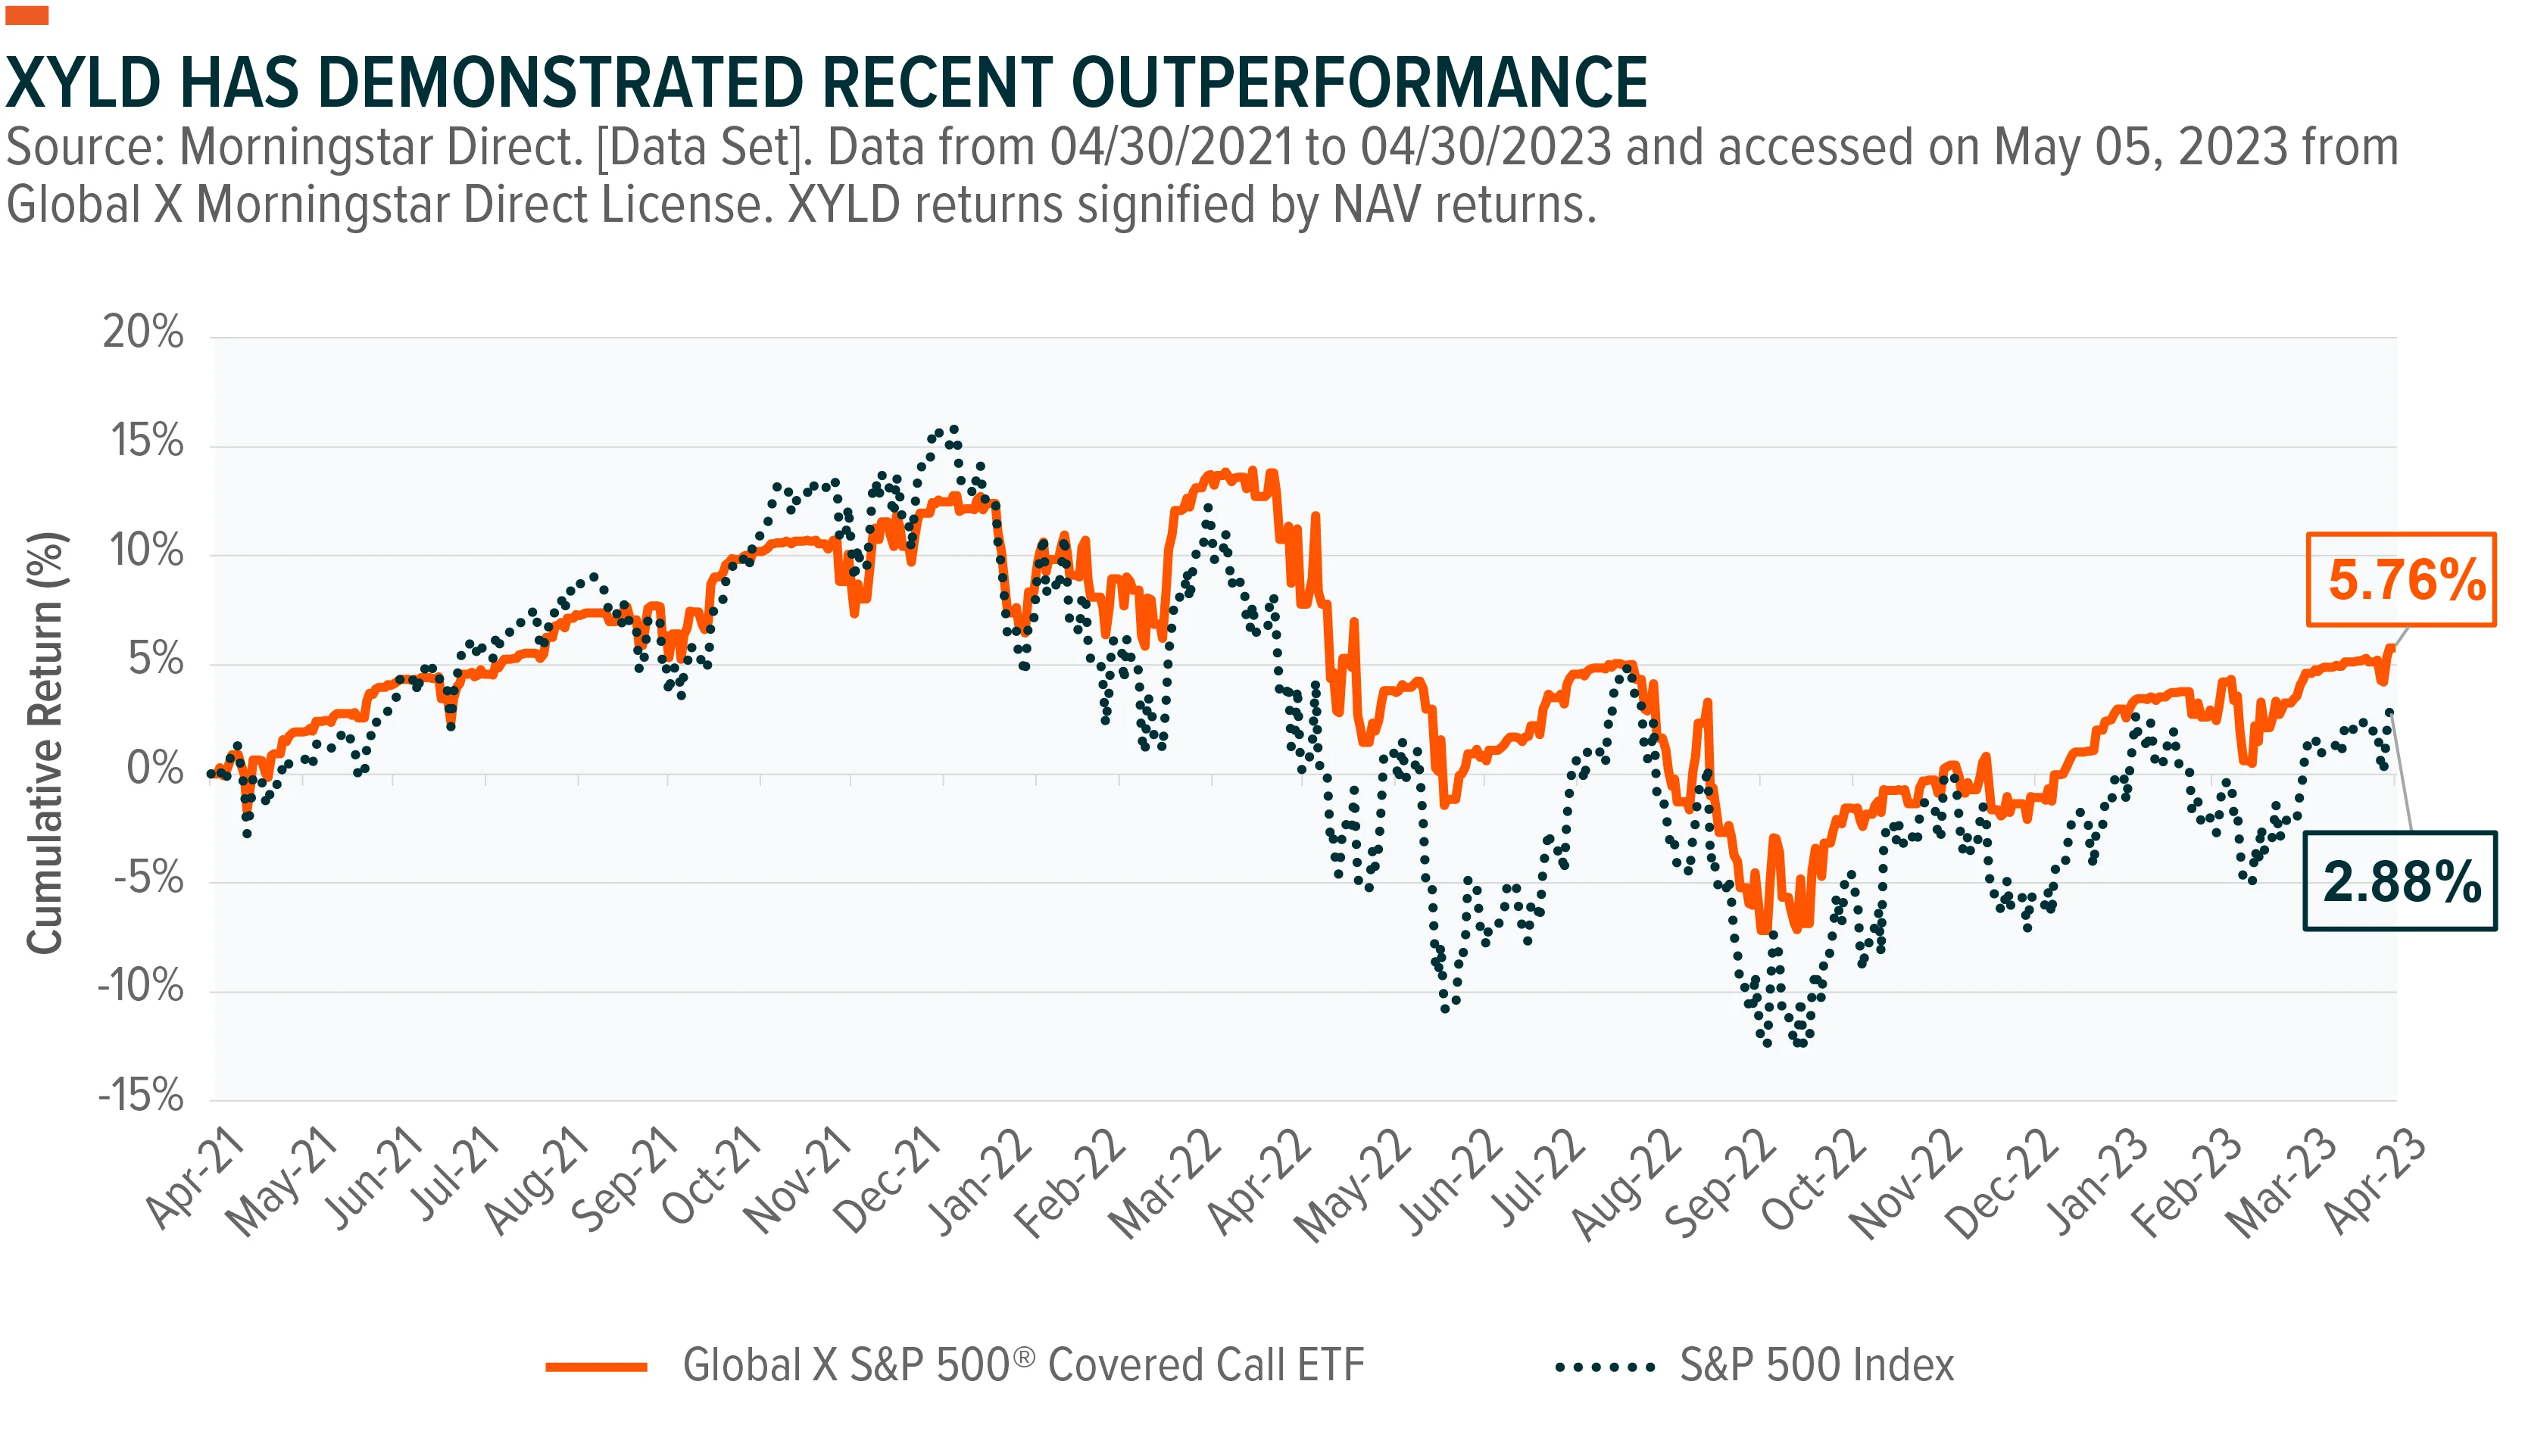
Amidst macroeconomic concerns in the banking system there have still been economic bright spots, such as a U.S. unemployment rate of 3.4%.13 These mixed signals may be have been a driver for the modest increase in the S&P 500’s total return of 2.88% from 04.30.2021 to 04.30.2023.14 During periods of equity market uncertainty, selling covered calls on an equity index offers the potential for outperformance when the reference index is expected to demonstrate a return less than the premium received. An “at-the-money” covered call strategy may prove to be the most beneficial in such a scenario. Typically, all else equal, the closer the call option strike price is to the price level of the index at contract initiation, the higher the expected premium.
Performance data quoted represents past performance. Past performance is not a guarantee of future results. The investment return and principal value of an investment will fluctuate so that an investor's shares, when sold or redeemed, may be worth more or less than their original cost and current performance may be lower or higher than the performance quoted. For performance current to the most recent month- and quarter-end, click to the fund web page here.
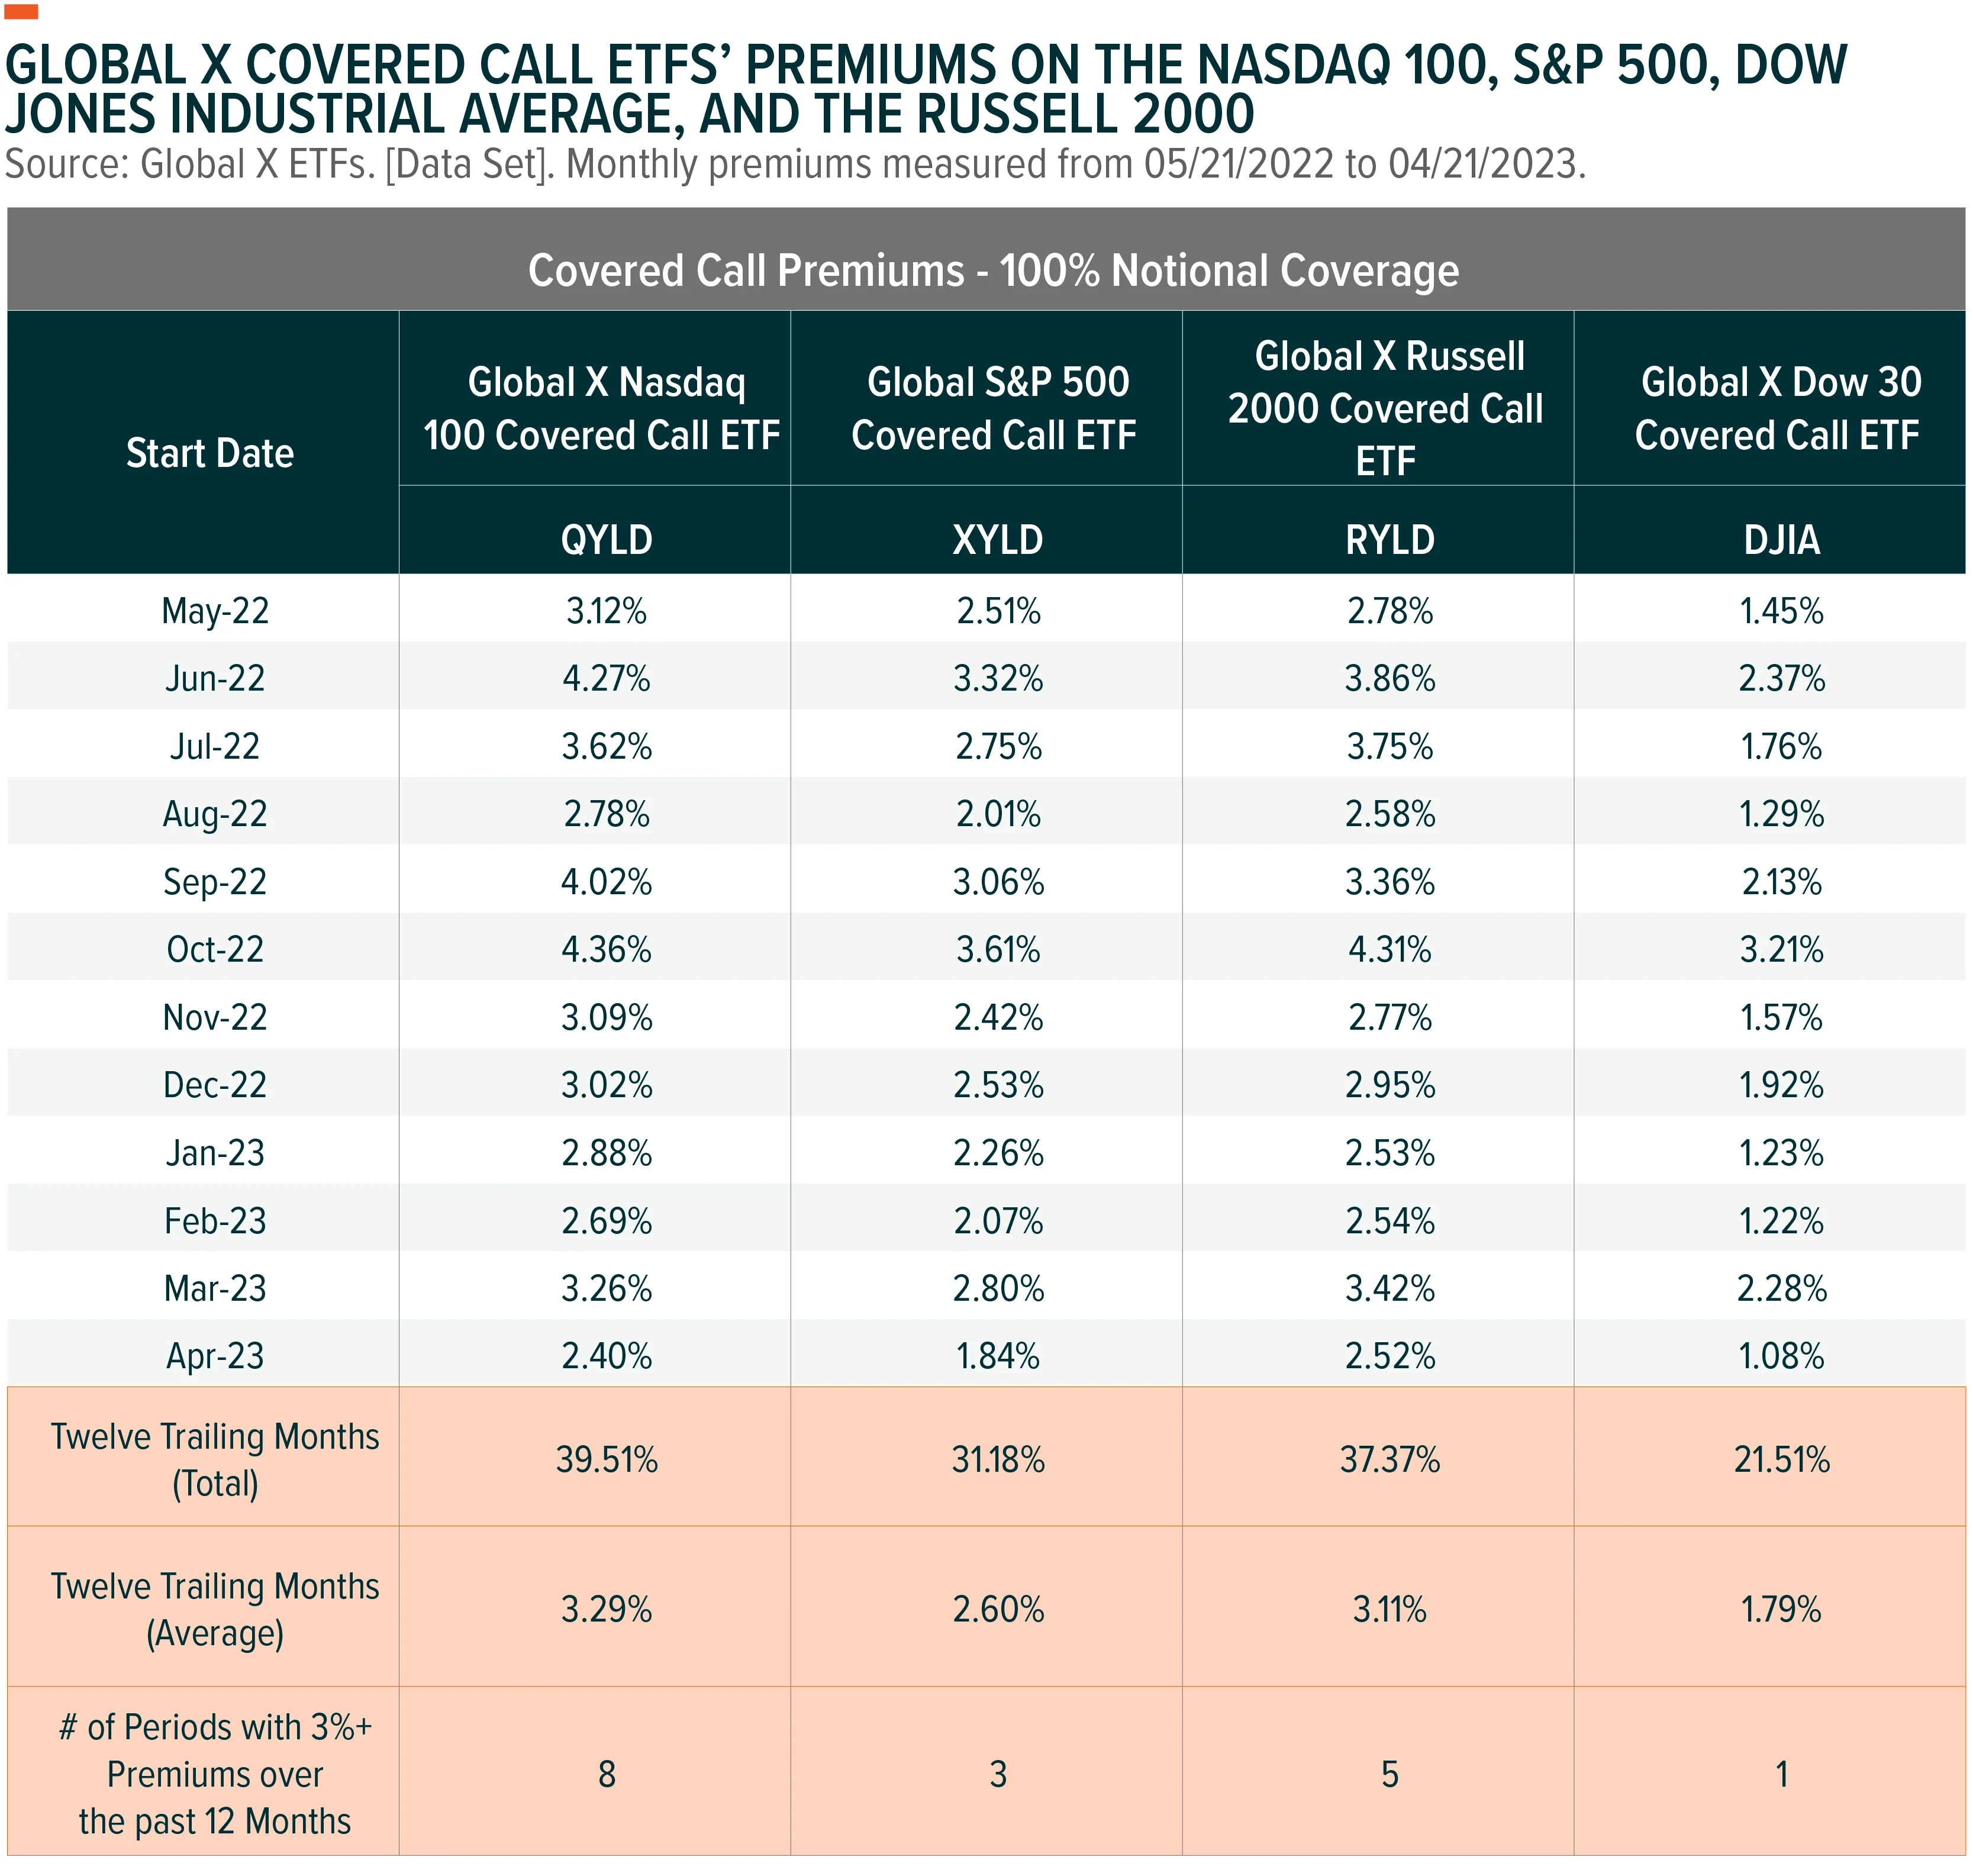
The premium proposition from a covered call strategy may be the main attraction. Covered call strategies offer a diversification opportunity in which upside participation in the underlying asset is sacrificed for premiums that are received for selling call options. This is different than a pure equity strategy, where income is reliant on company dividends. For fixed income securities, income is correlated to the level of interest rates. Global X’s covered call ETFs’ premiums have historically moved higher during periods of heightened market volatility. Below, we can see a twelve trailing month comparison of options premiums generated from Global X’s at-the-money, covered call writing strategies on 100% of the notional coverage of the Nasdaq 100 (QYLD), S&P 500 (XYLD), Russell 2000 (RYLD), and Dow Jones Industrial Average (DJIA).
The first quarter of the new year saw a promising shift in equity market sentiment amidst recent volatility in the banking sector. This has led income investors to a crossroads of mixed signals such as low unemployment paired with elevated interest rate volatility. Taking a defensive stance in the form of quality dividends offers investors the potential to avoid value traps and maintain sustainable dividend growth. For investors who believe the aforementioned, mixed signals may persist, a covered call strategy, monetizing implied volatility of an equity index, may be prudent in providing option premium income with an elevated chance of lowering risk within the equity sleeve of a portfolio.
Related ETFs
QDIV – Global X S&P 500 Quality Dividend ETF
QYLD: The Global X Nasdaq 100 Covered Call ETF
XYLD: The Global X S&P 500 Covered Call ETF
RYLD: The Global X Russell 2000 Covered Call ETF
DJIA: The Global X Dow 30 Covered Call ETF
Click the fund name above to view current performance and holdings. Holdings are subject to change. Current and future holdings are subject to risk.
1. Bloomberg. [Data Set]. data as of 04/30/2023 and accessed on May 5th from Global X’s Bloomberg Terminal.
2. Bloomberg. [Data Set]. 2-year Treasury Yield data from 03/07/2023 to 03/24/2023 and accessed on April 24th from Global X’s Bloomberg Terminal.
3. Bloomberg. [Data Set]. Federal Fund Rate futures curve data as of 04/30/2023 and accessed on May 5th from Global X’s Bloomberg Terminal.
4. Global X ETFs with information derived from Bloomberg. [Data Set]. Data from 04/30/2018 through 04/30/2023 and accessed on May 5th, 2023 from Global X Bloomberg Terminal.
5. Morningstar Direct. [Data Set]. Data as of 04/30/2023 and accessed on May 5th, 2023 from Global X’s Morningstar Direct License.
6. Morningstar Direct. [Data Set]. Data from 01/01/2023 to 04/30/2023 and accessed on May 5th, 2023 from Global X’s Morningstar Direct License. Technology sector is represented by the S&P Technology Select Sector Index and Communication Services is represented by the S&P Communication Services Select Sector Index.
7. Ibid.
8. S&P Dow Jones Indices. (2023, April 4). S&P Dow Jones Indices Reports U.S. Common Indicated Dividend Payments Increased $9.7 Billion During Q1 2023; 12-month Gain was $59.7 Billion.
9. Morningstar Direct. [Data Set]. Data as of 03/31/2023 and accessed on April 24th, 2023 from Global X’s Morningstar Direct License.
10. Morningstar Direct. [Data Set]. Data as of 04/30/2023 and accessed on May 5th, 2023 from Global X’s Morningstar Direct License.
11. Morningstar Direct. [Data Set]. Data from 01/01/2022 to 12/31/2022 and accessed on April 24th, 2023 from Global X Morningstar Direct License. Asset Class representations are as follows: Growth, S&P 500 Growth TR Index; Value, S&P 500 Value TR Index. The S&P 500 Growth TR Index fell -29.41% during the measured timeframe. The S&P 500 Value Index fell -5.22% during this same timeframe.
12. Bloomberg. [Data Set]. 2-year Treasury Yield from 03/10/2023 to 04/30/2023 and accessed on May 5th from Global X’s Bloomberg Terminal.
13. Bloomberg. [Data Set]. Unemployment rate data as of 04/30/2023 and accessed on May 5th from Global X’s Bloomberg Terminal.
14. Morningstar Direct. [Data Set]. Data from 04/30/2021 to 04/30/2023 and accessed on May 5th, 2023 from Global X Morningstar Direct License.


