The Global X Income Outlook for Q1 2023 can be viewed here. This report seeks to provide macro-level data and insights across several income-oriented asset classes and strategies.
Last quarter, we discussed the ongoing trends of inflation pulling back in tandem with the Federal Reserve (Fed) slowing down the pace of rate hikes. These trends became more pronounced in the fourth quarter of 2022 and into the first part of 2023 as the U.S. Consumer Price Index (CPI) increased 6.0% in February, year-over-year, which is a significant decrease in percentage growth from the June 2022 inflation rate of 9.1%.1 Overall, rate hikes decelerated from four consecutive increments of 75bps, easing to 50bps in December and followed by a 25bps hike in February.2 Despite employment and consumer spending data continuing to reflect a relatively robust economic landscape, we believe that investors have various options to pursue higher levels of income via alternative income strategies. These approaches can provide diversification and may prove to be resilient in this market environment.
Key Takeaways
Implementing a strategy that can monetize market uncertainty or volatility while maintaining partial upside potential, as market returns tend to remain elevated during the recovery period, may be an interesting approach for investors. A covered call and growth strategy that allows for equity upside may be one such strategy.
The December shift in fixed income may benefit long-duration assets and strategies with built-in credit risk. Preferred stock for income potential has become an increasingly popular strategy, as well as emerging market (EM) debt, which presents a compelling case given positive real yields and strong GDP growth forecasts.
Energy assets that derive their value from the velocity of energy rather than solely from price, such as master limited partnerships (MLPs) and energy infrastructure equities, possess strong fundamentals in this environment.
Derivative Markets Suggest Inflation Is Subsiding
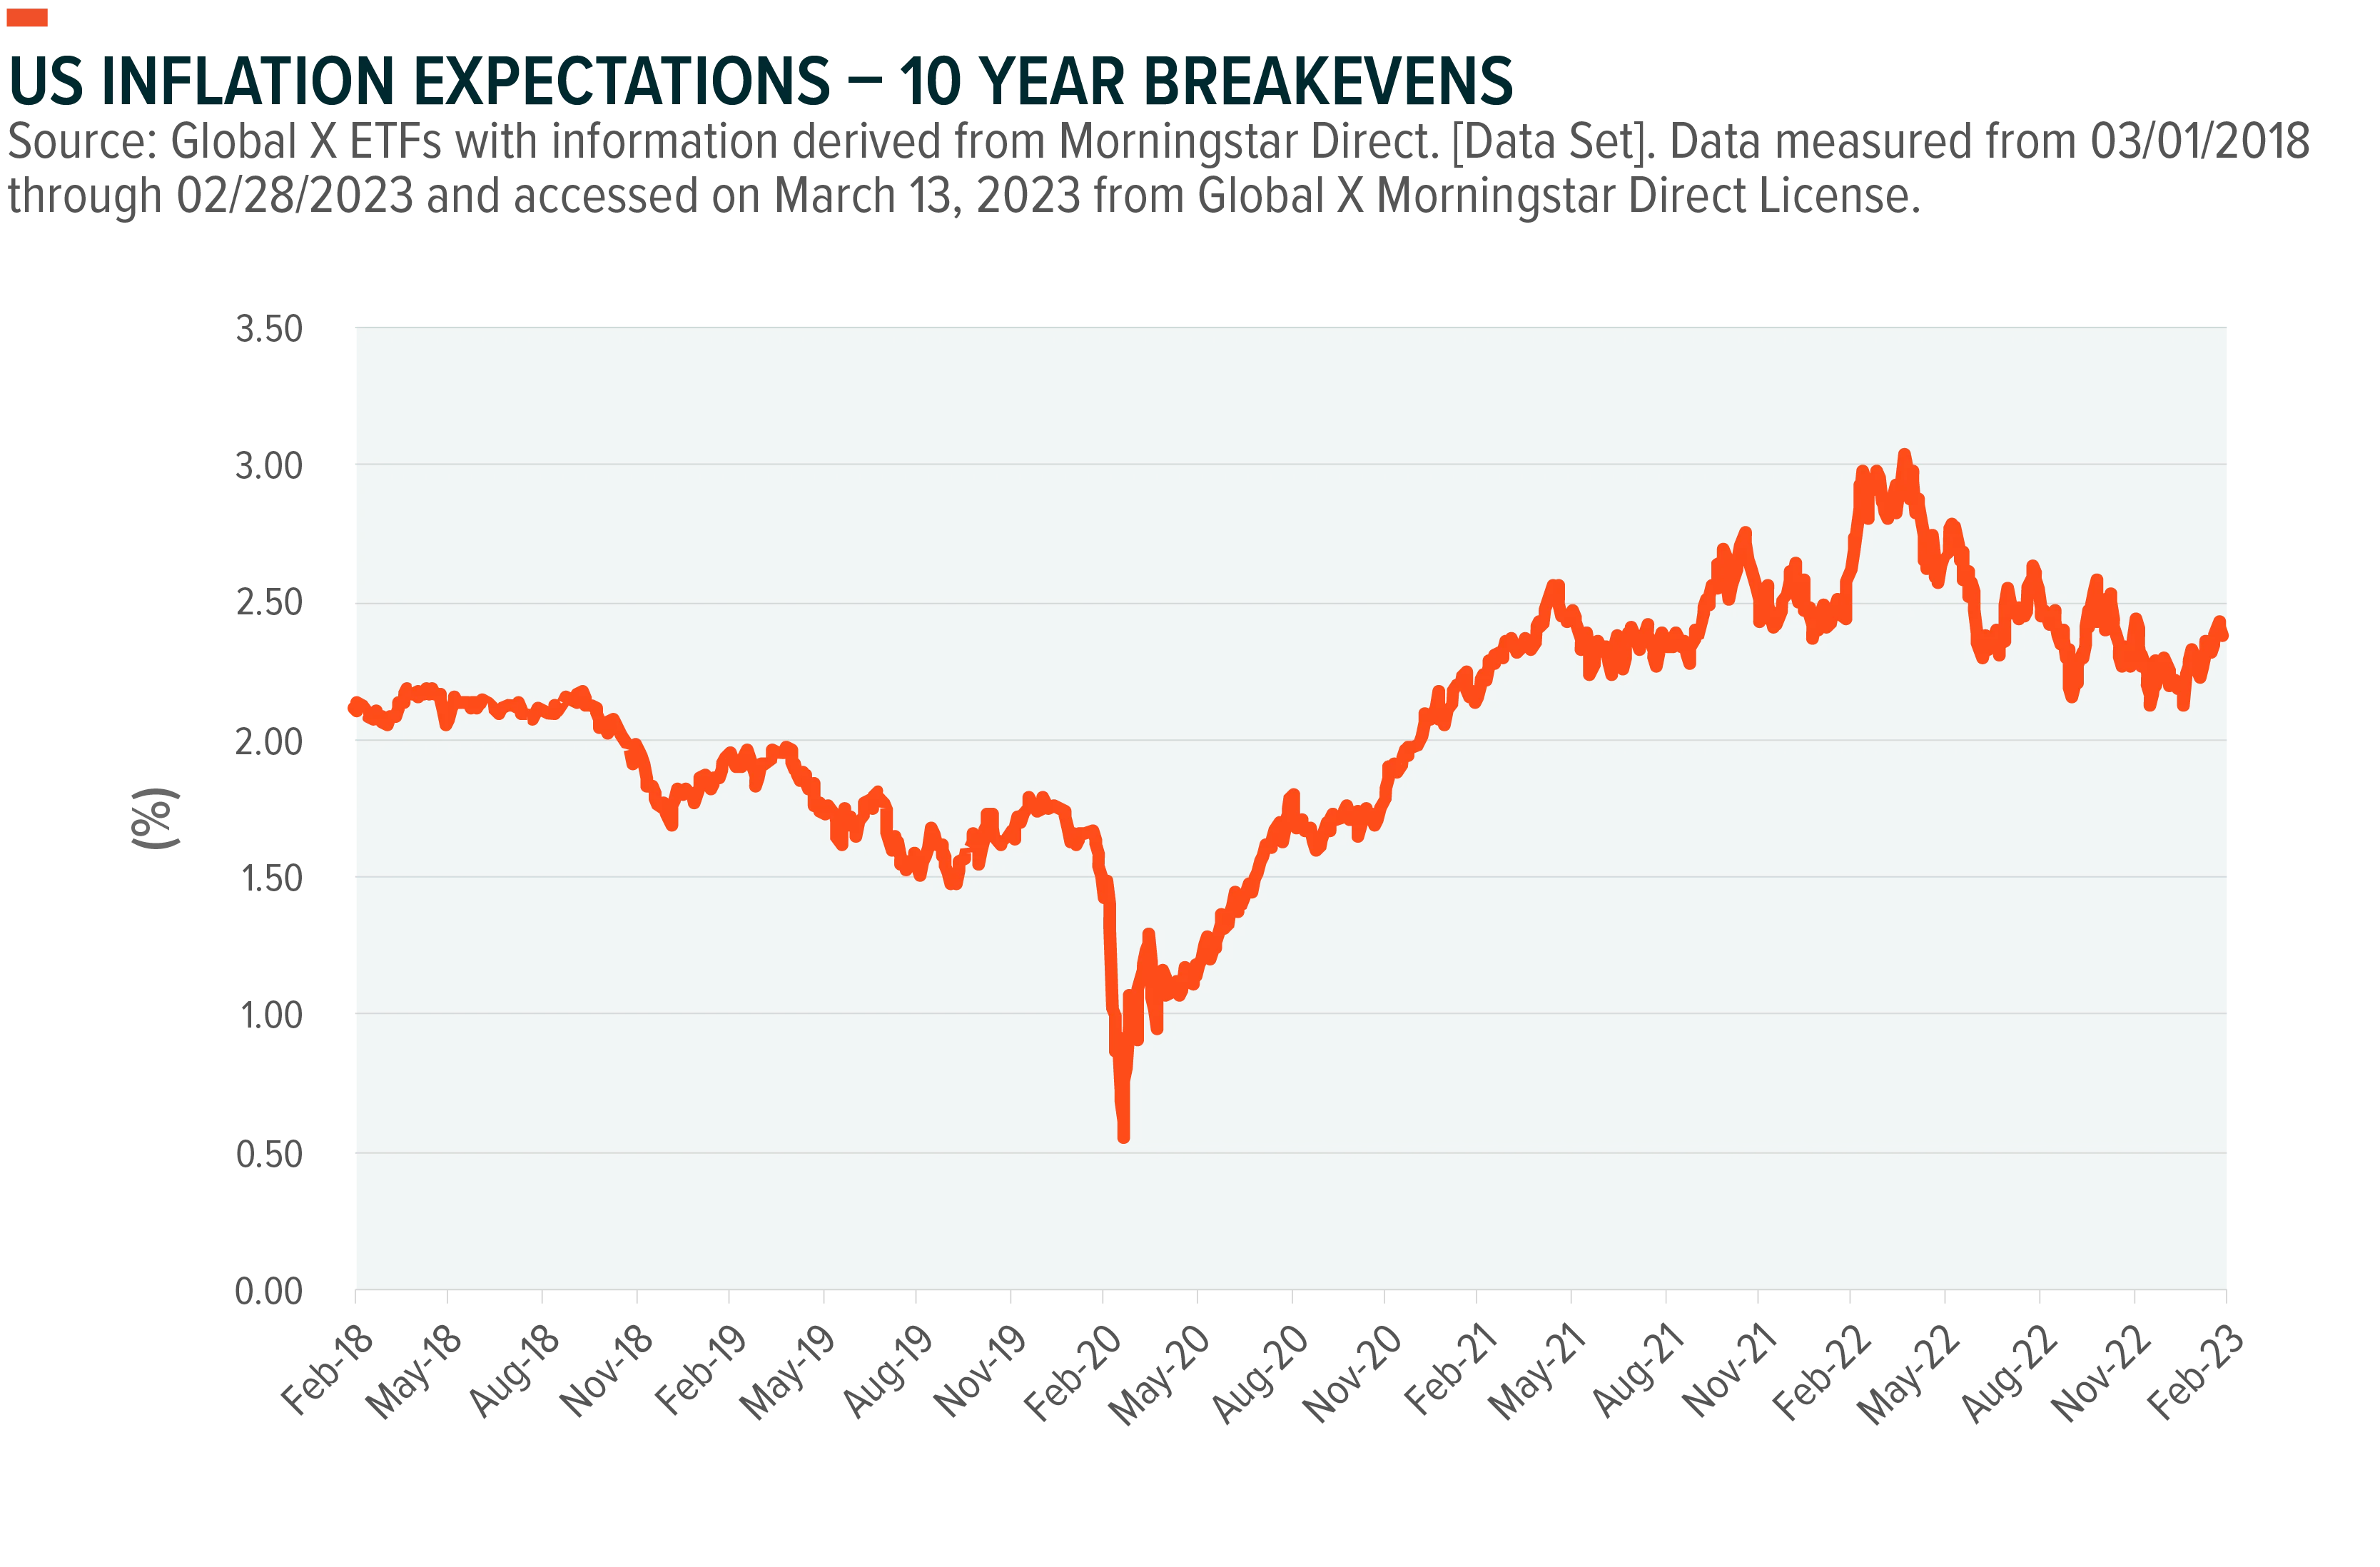
Entering 2023, U.S. equity indices have experienced a level of volatility due to concerns about prolonged high interest rates and geopolitical tensions. Recent government data shows that US consumer prices (measured by CPI) increased by 6.0% in February from the previous year, surpassing consensus estimates and remaining significantly above the Fed's target of 2% annual inflation.3 However, there is still room for optimism in the current market landscape. The chart below illustrates that 10-year breakevens, the difference in yields between the most currently issued, 10-year U.S. treasury bonds and their equivalent maturity inflation-linked bonds, suggest CPI is closer to reaching the Federal Reserve’s 2% target, inflation rate.4 We believe this signal potentially mitigates the probability of an economic hard landing. Therefore, as investors continue to evaluate their portfolios in the early onsets of 2023, alternative income strategies in the options and fixed income markets may provide potential benefits amidst this positive sentiment shift.
A Covered Call and Growth Strategy as a Potential Balance
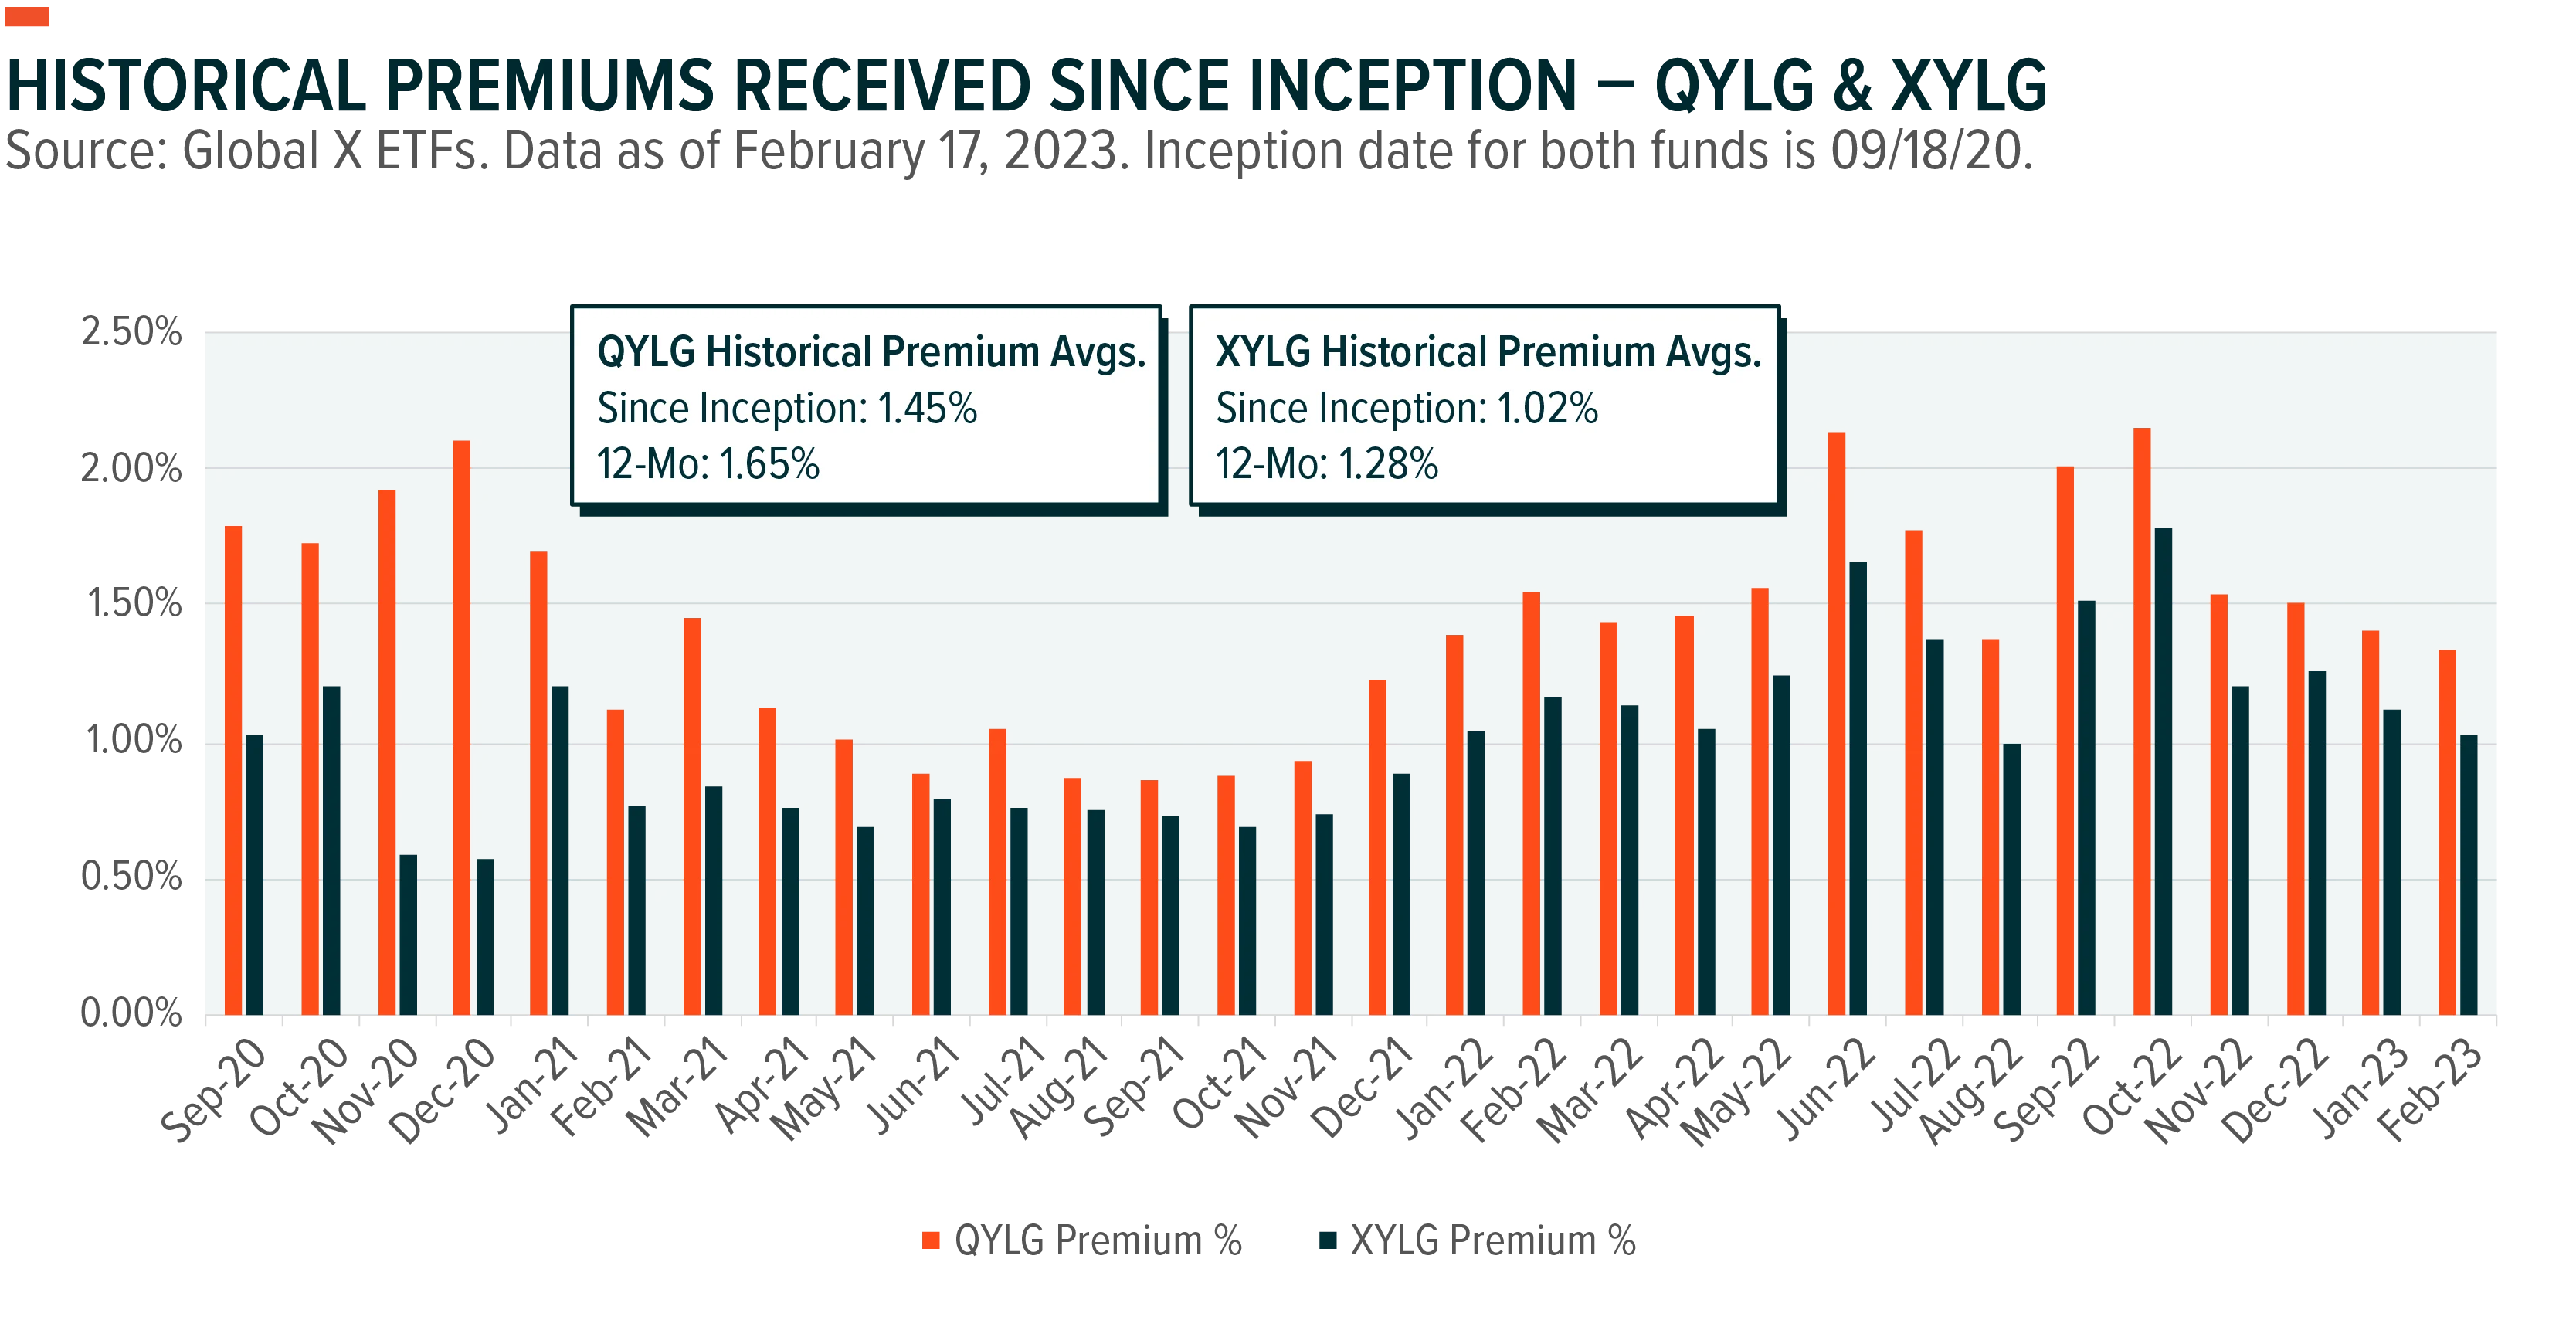
One short-term impact from the recent policy shifts of expected, lower rate hikes, has been a level of positive performance amongst interest rate sensitive segments of the equity markets. As of 02/28/2023, the S&P 500 (+3.69%), Nasdaq 100 (+10.26%), and Russell 2000 (+7.89%) have reversed course after significant underperformance in 2022.5 Income investors seeking to achieve a blend of both high income with potential growth upside may find that a covered call & growth strategy on a broad equity index can help provide a blended strategy within an income portfolio. This type of call writing strategy is implemented at Global X by investing in the underlying securities of an index while selling “at-the-money” call options on approximately 50% of the value of the portfolio of stocks in the same index or an ETF tracking the underlying equity index. Of this segment of the Global X Covered Call ETF suite, QYLG, which implements the aforementioned call writing strategy on the Nasdaq 100, and XYLG, which does the same on the S&P 500, are the longest tenured covered call & growth ETFs. In addition to their ability to provide a degree of upside participation, both ETFs demonstrated attractive distribution yields of 6.75% (QYLG) and 6.68% (XYLG), respectively, as of 02/28/2023.6
In addition to a covered call & growth strategy, a covered call strategy that covers 100% of its portfolio with call options may still be an option for income investors seeking a higher level of potential income. If there is a spike in implied volatility in the market or sideways market movements, fully covered call strategies may be able to monetize this level of market volatility through the sale of call options at higher premiums while maintaining equity allocations. Funds like QYLD, XYLD, RYLD, & DJIA are examples of this type of a 100% covered call strategy on major equity indexes.
Conditions for Emerging Market Debt Appear Favorable
In 2022, investors turned risk averse and sought more “risk-off” investments which led to underperformance within the EM debt asset class. The sluggish performance was primarily due to tighter financial conditions in the United States, which increased the costs of servicing dollar-denominated debt thus negatively impacting issuers, as borrowing became more expensive. However, the prospects for EM debt also appear promising, buoyed by the robust 2023 GDP growth projection. According to J.P. Morgan, EM GDP growth in 2023 is expected to be robust, reaching 2.9% - a considerable increase compared to the 1% projected for the United States and 0.8% for developed markets.7 This positive expectation is further reinforced by the anticipated decrease in EM ex-China and Turkey inflation from 7.9% at the end of 2022 to 4.3% by year-end 2023.8 Despite the current global growth outlook and potential headwinds pressuring commodity prices, prices have remained resilient as China, the second largest commodity importer, lowered COVID-19 restrictions thus expanding a new demand cycle. The reopening of the Chinese economy may increase overall demand, raising exports and GDP figures for EM countries with a trade surplus, even as demand from developed nations moderates. Another tailwind for EM countries is now coming from the weakening of the US dollar. Additional clarity about a potential end to the Fed’s rate hiking regime has given investors a level of confidence that a dollar peak may have emerged. We believe this development will help alleviate concerns about dollar-denominated debt for EM countries as the Federal Reserve seeks to slow its pace of interest rate hikes.
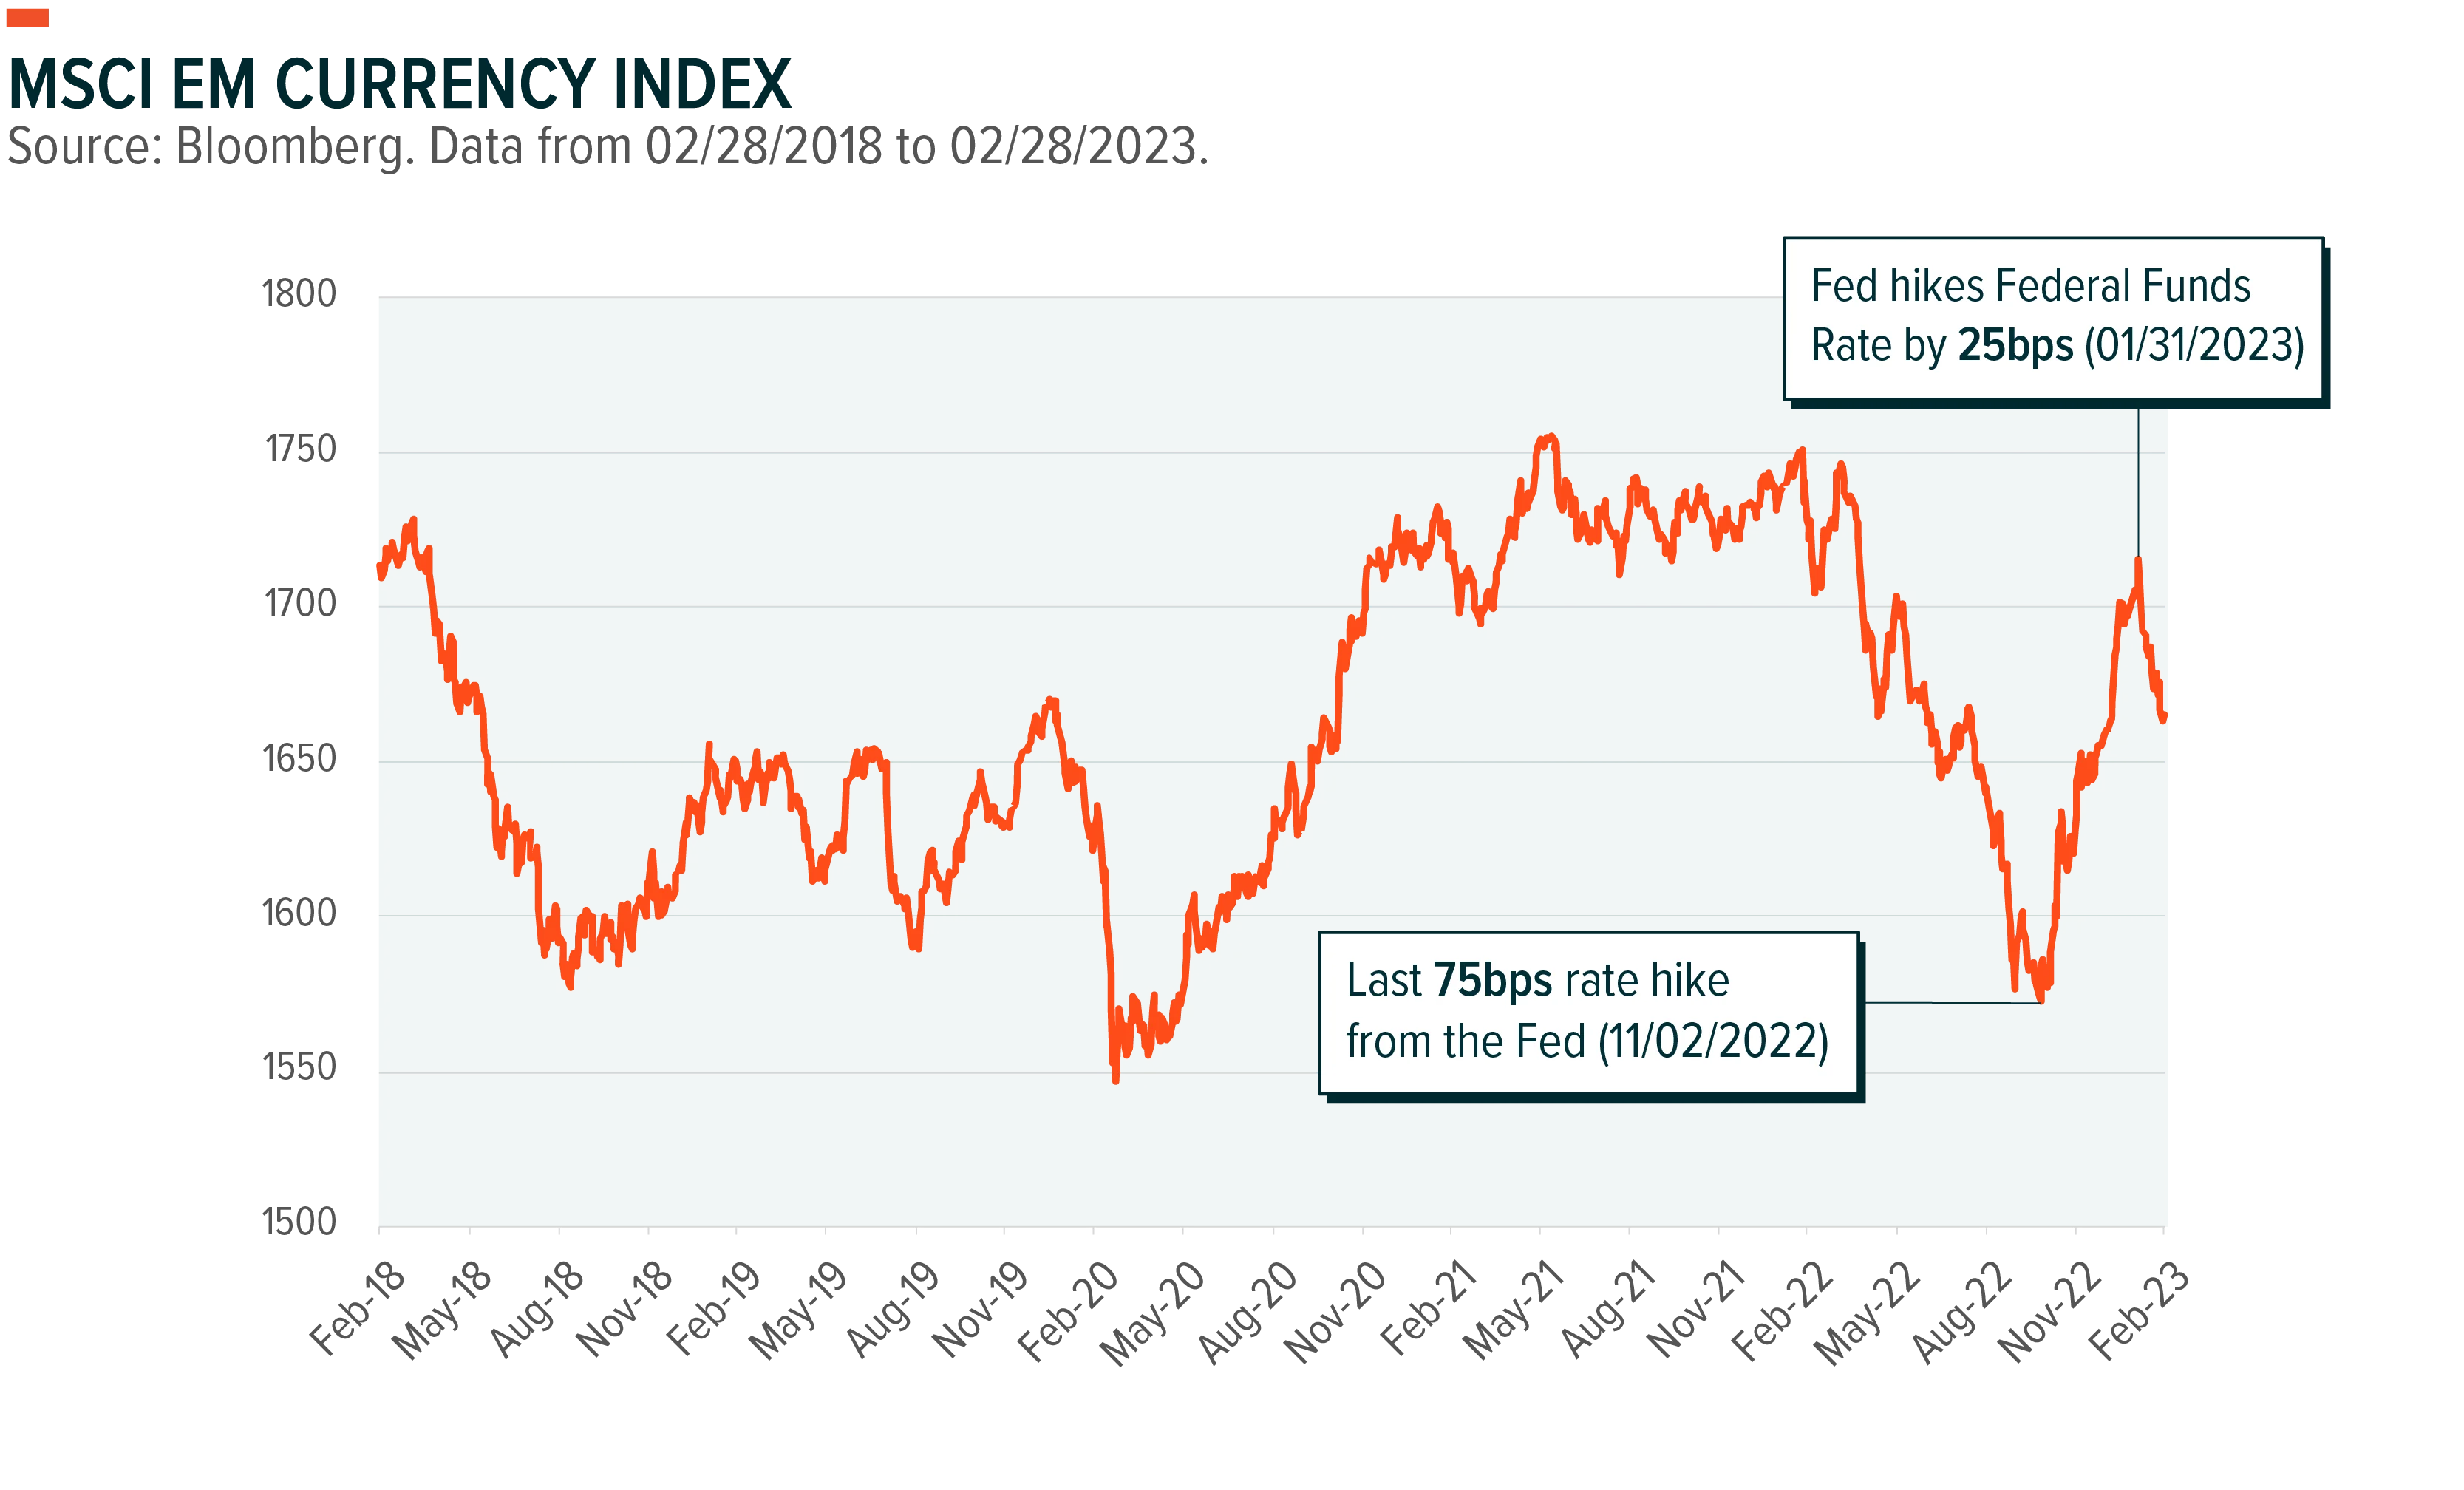
However, not all emerging markets will perform equally as the world continues to navigate the ongoing energy and food price shocks. Commodity-exporting nations appear better positioned to weather the current economic conditions than commodity importers. However, policy responses to these shocks vary, the result of which is larger debt burdens and higher inflation for certain EMs, which increases the credit risks of sovereign debt.
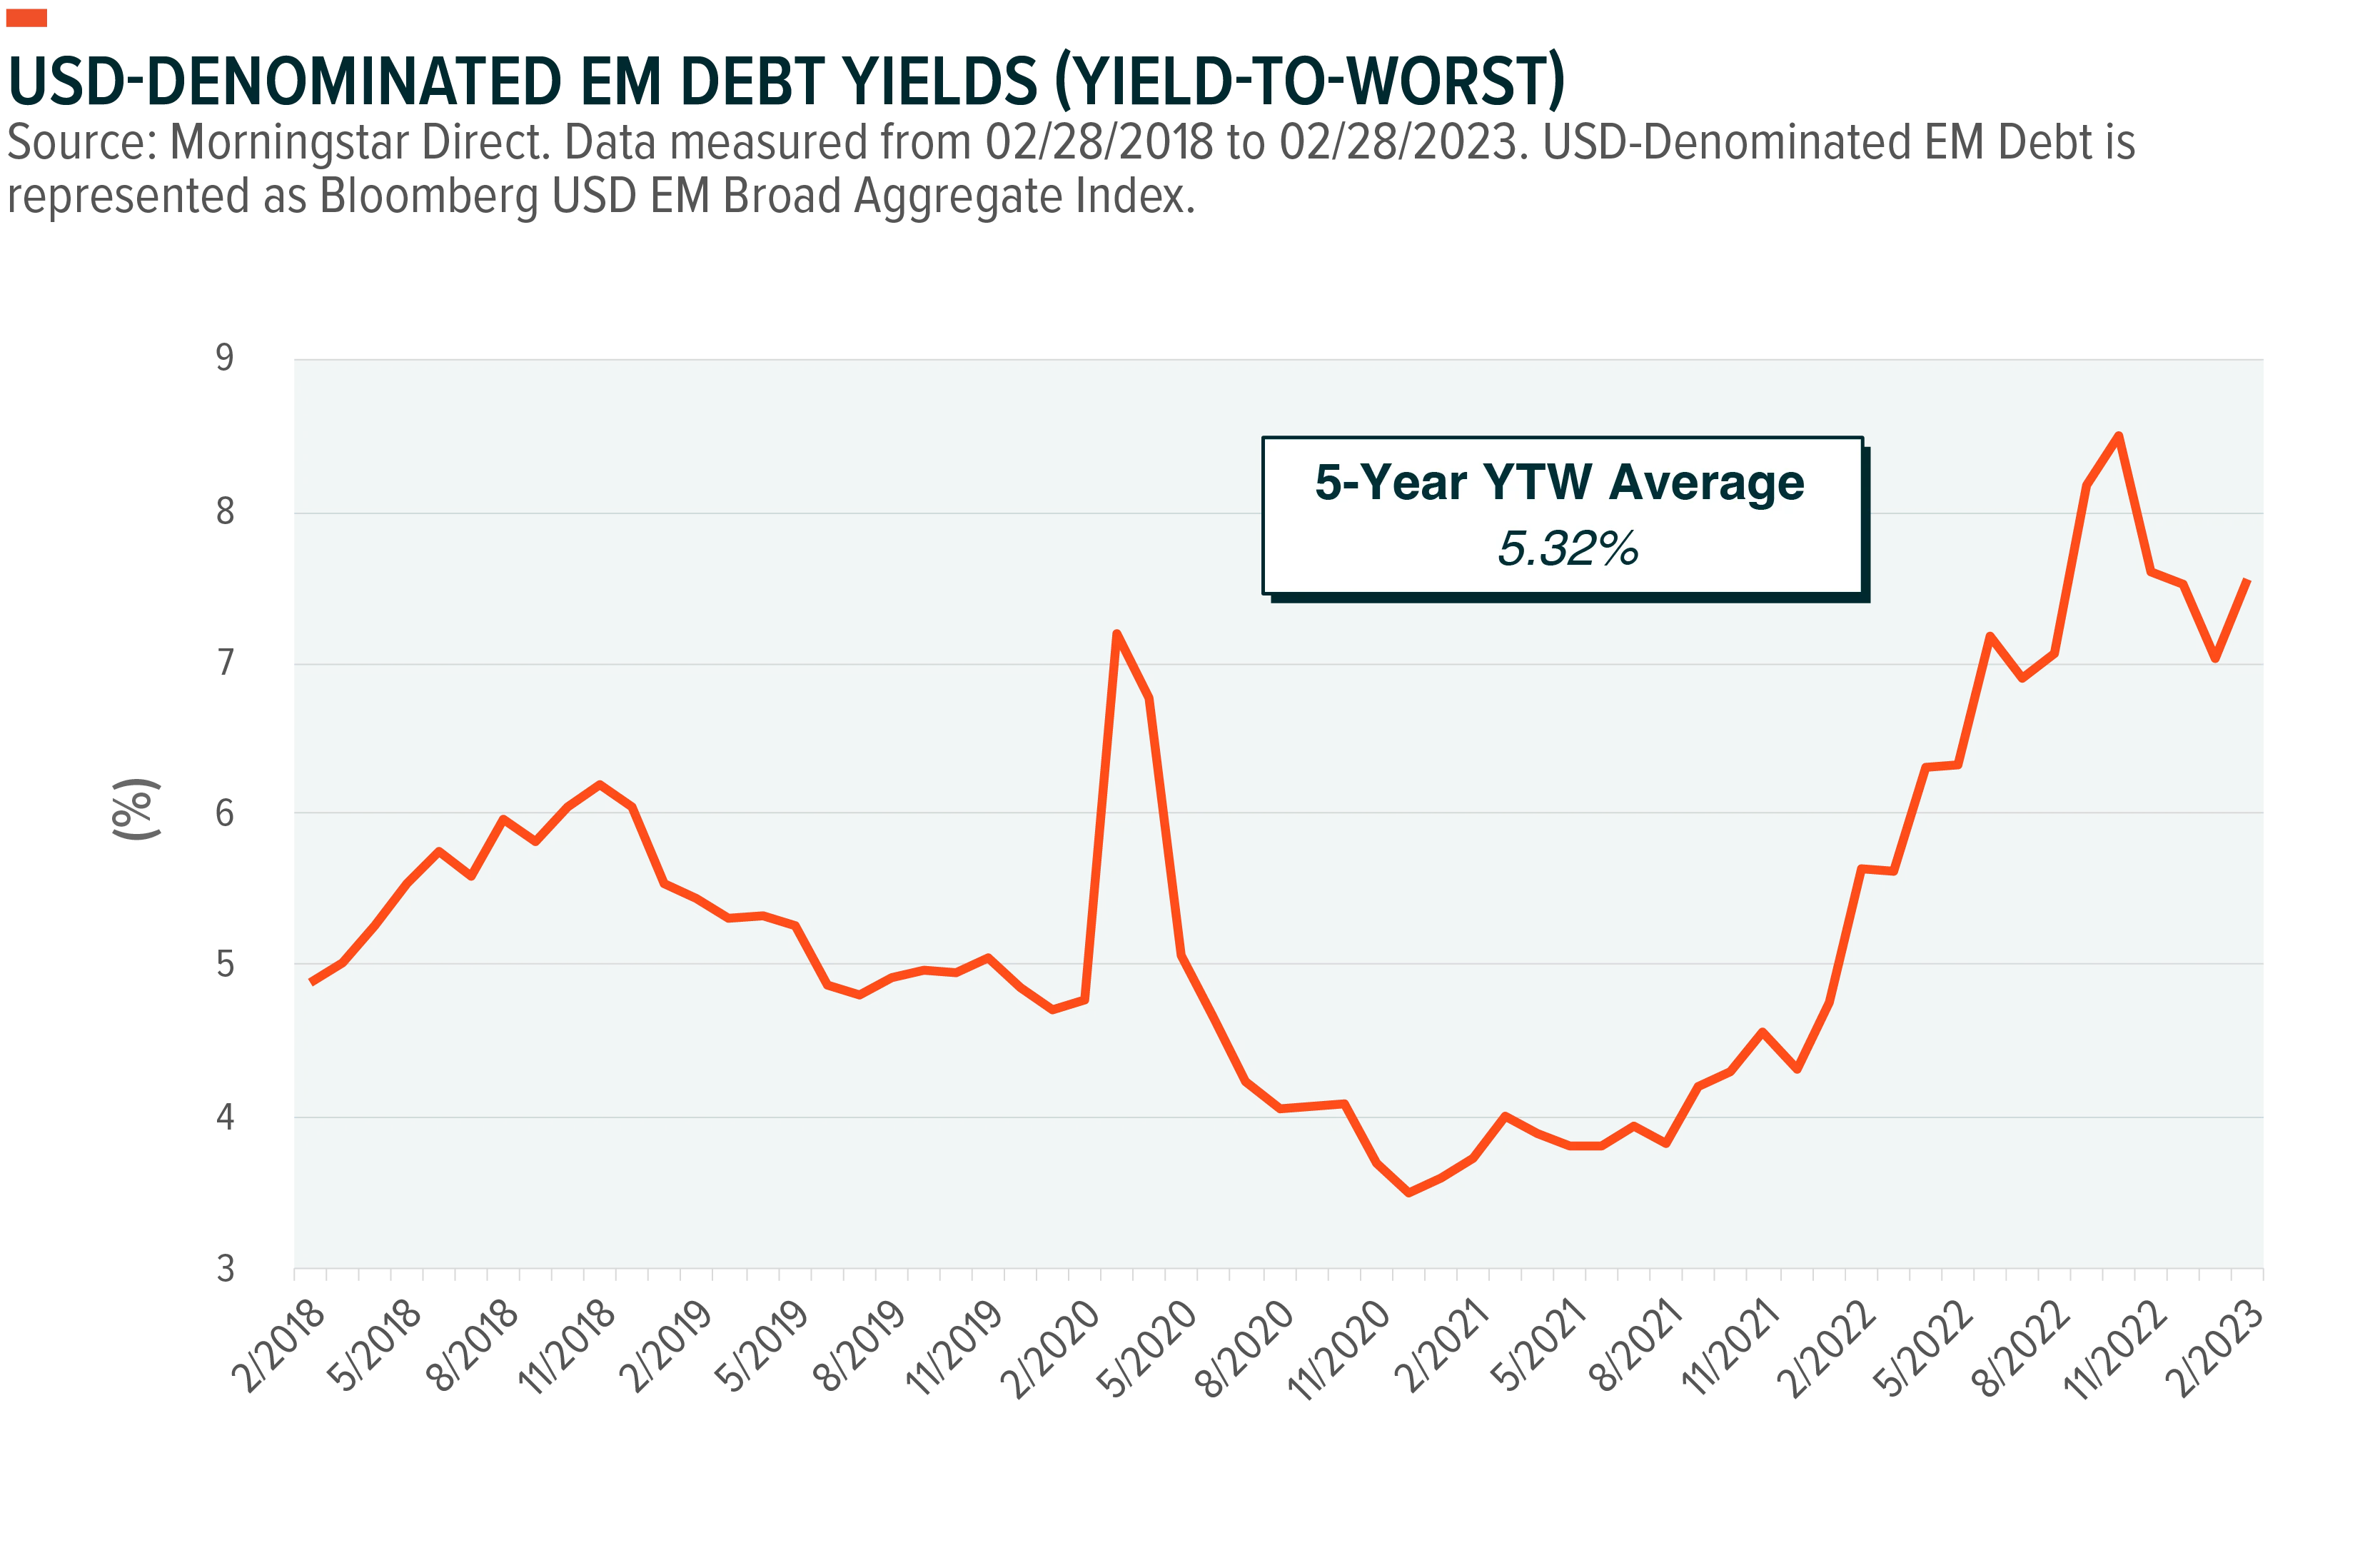
Considering the fluid nature of these factors, an actively managed strategy may be prudent for exposure to EM debt. One strategy that takes such an approach is the Global X Emerging Markets Bond ETF (EMBD). Since EMBD’s inception on 06/01/2020 to 02/28/2023, EMBD has outperformed its benchmark, the J.P Morgan EMBI Global Core Bond Index, by 2.89%, on an annualized, total return basis, utilizing net asset value returns.9 Income potential within this bond market segment appear to be attractive too, in which U.S.-dollar denominated emerging market debt exhibited yield-to-worst numbers above historical averages.10
Preferreds Are Off to a Strong Start in 2023
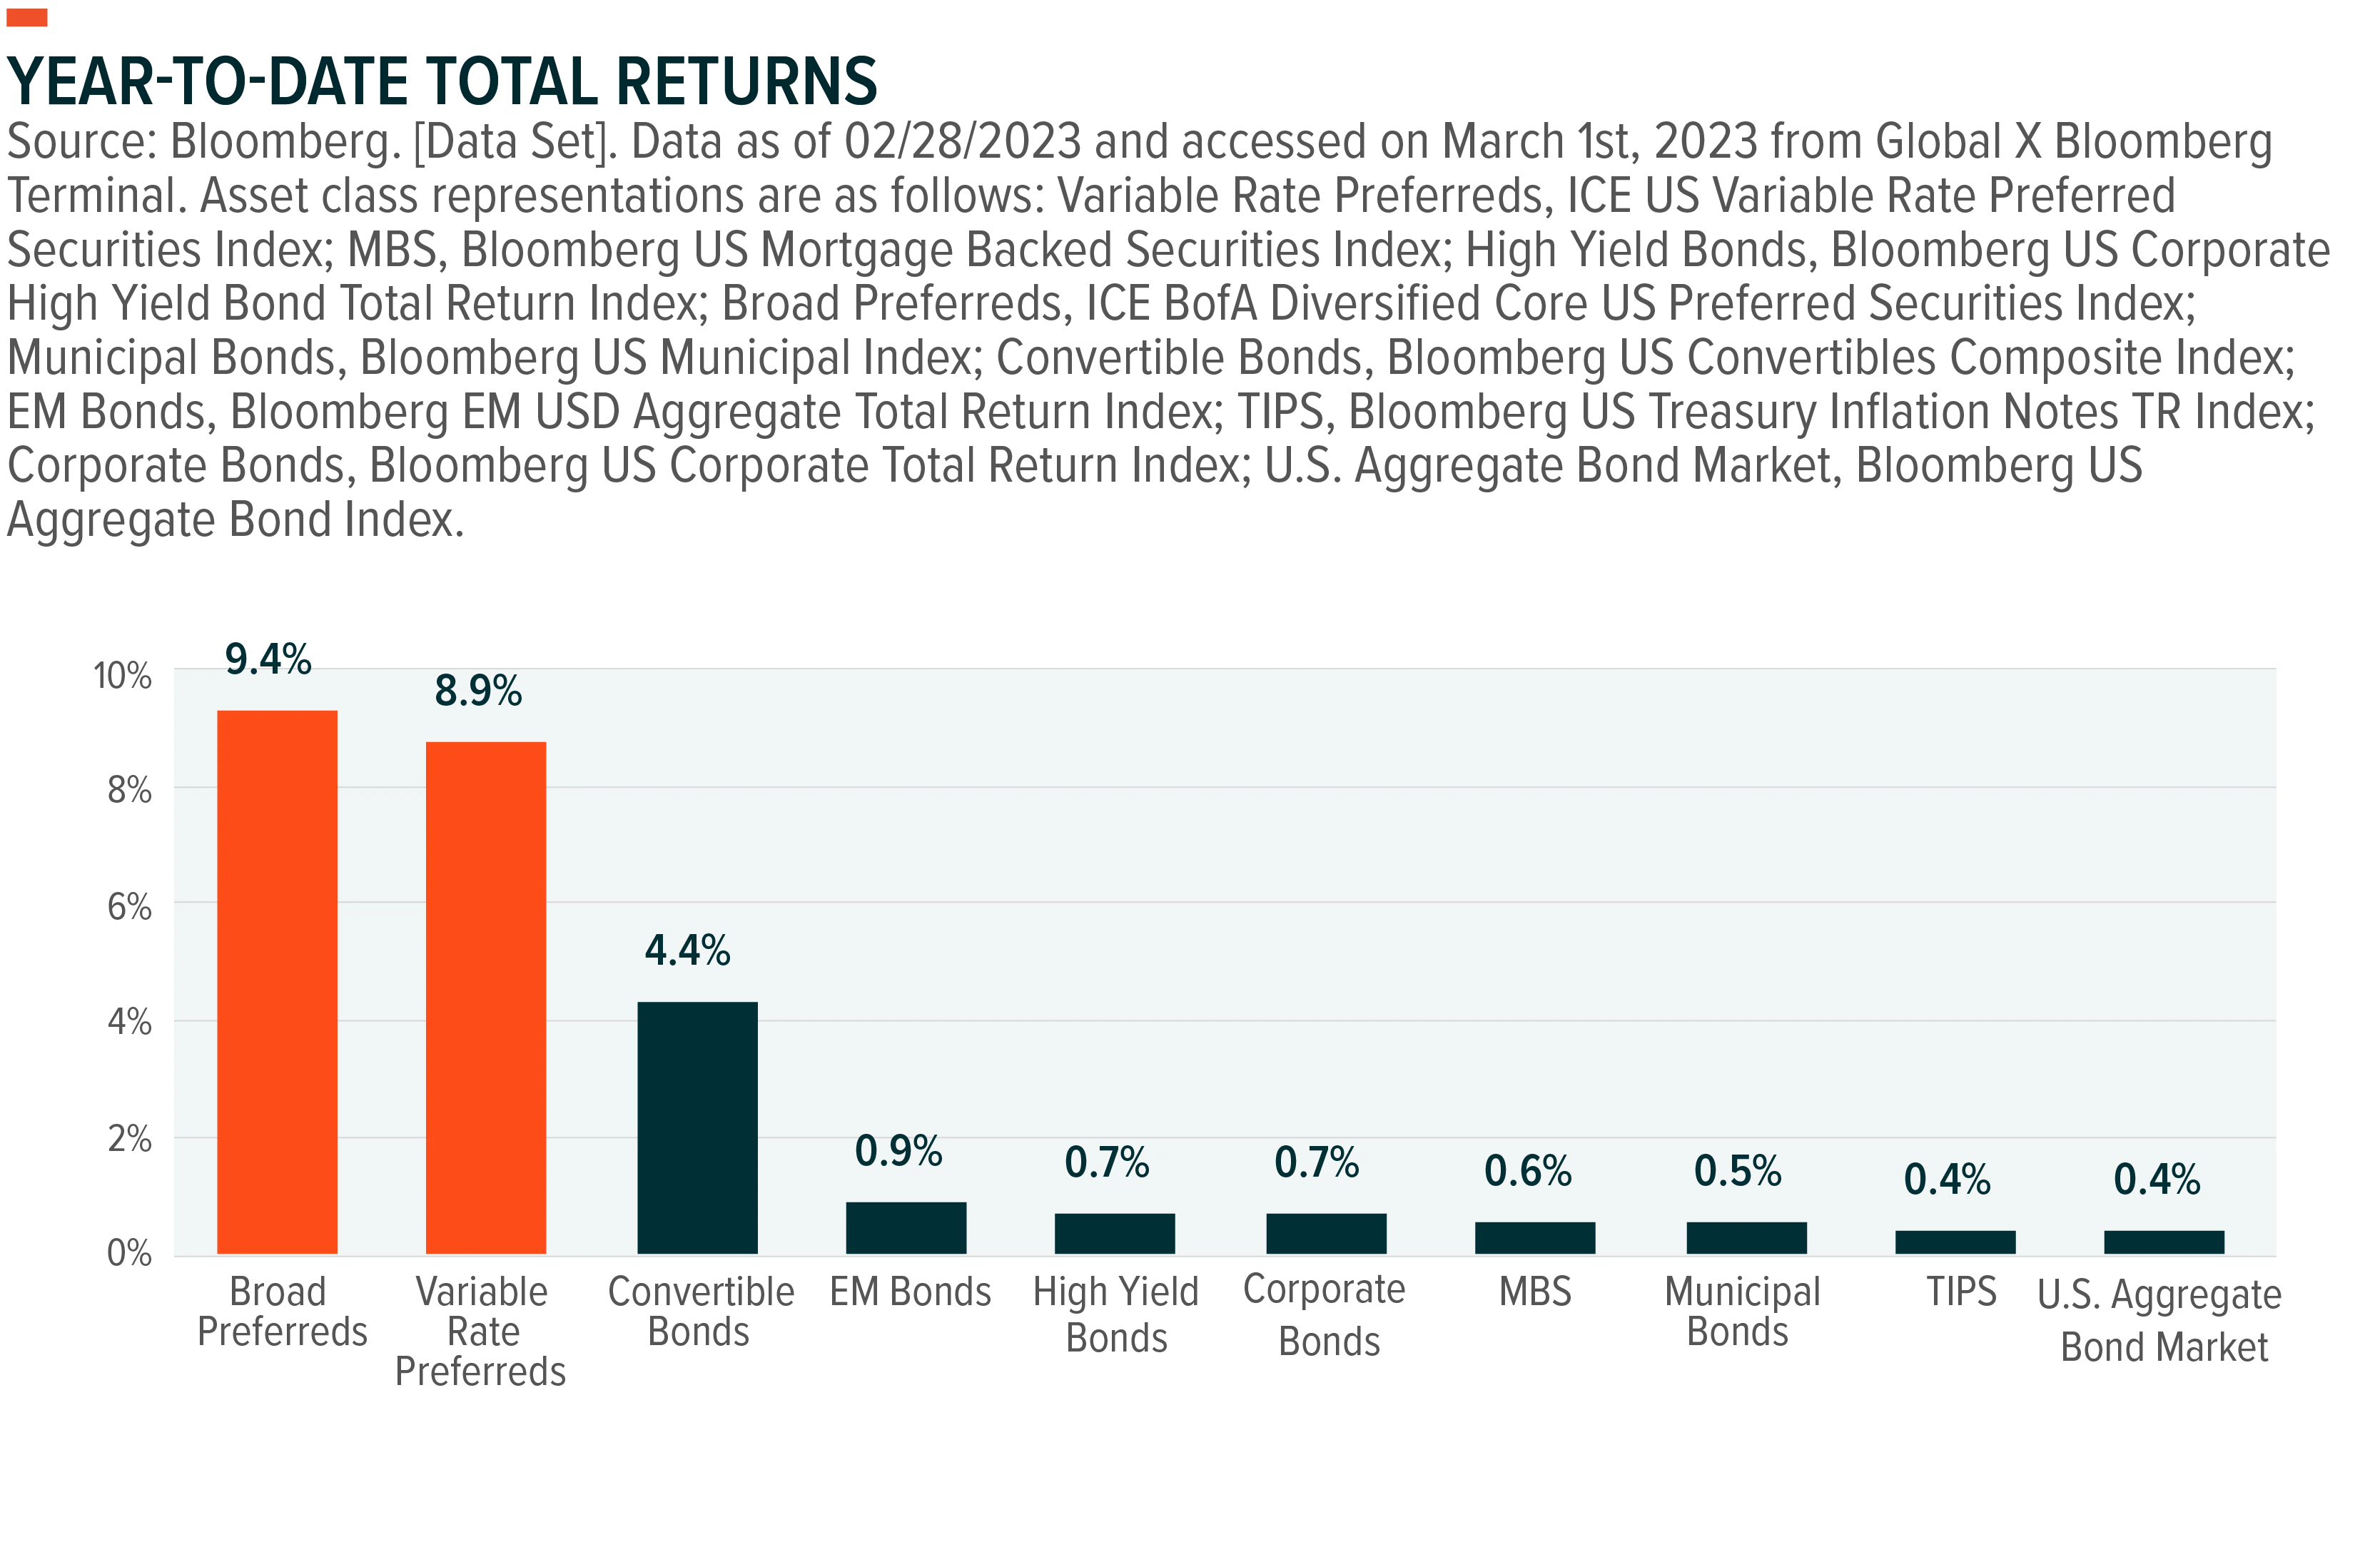
Similar to the impacts observed on Emerging Market Debt, the Preferred securities market has experienced a level of positive sentiment from the recent deceleration of rate hikes. While variable rate preferreds provided a better backdrop against interest rate risk in 2022, the broader preferred stock market, which primarily consists of longer duration, fixed rate preferreds, has outperformed a handful of fixed income counterparts, year-to-date.11 While slower rate hikes has been one part of this equation, preferreds are typically issued by large financial institutions with strict capital requirements. Because of this, financial sector performance can play a significant role in preferred stock market performance too.
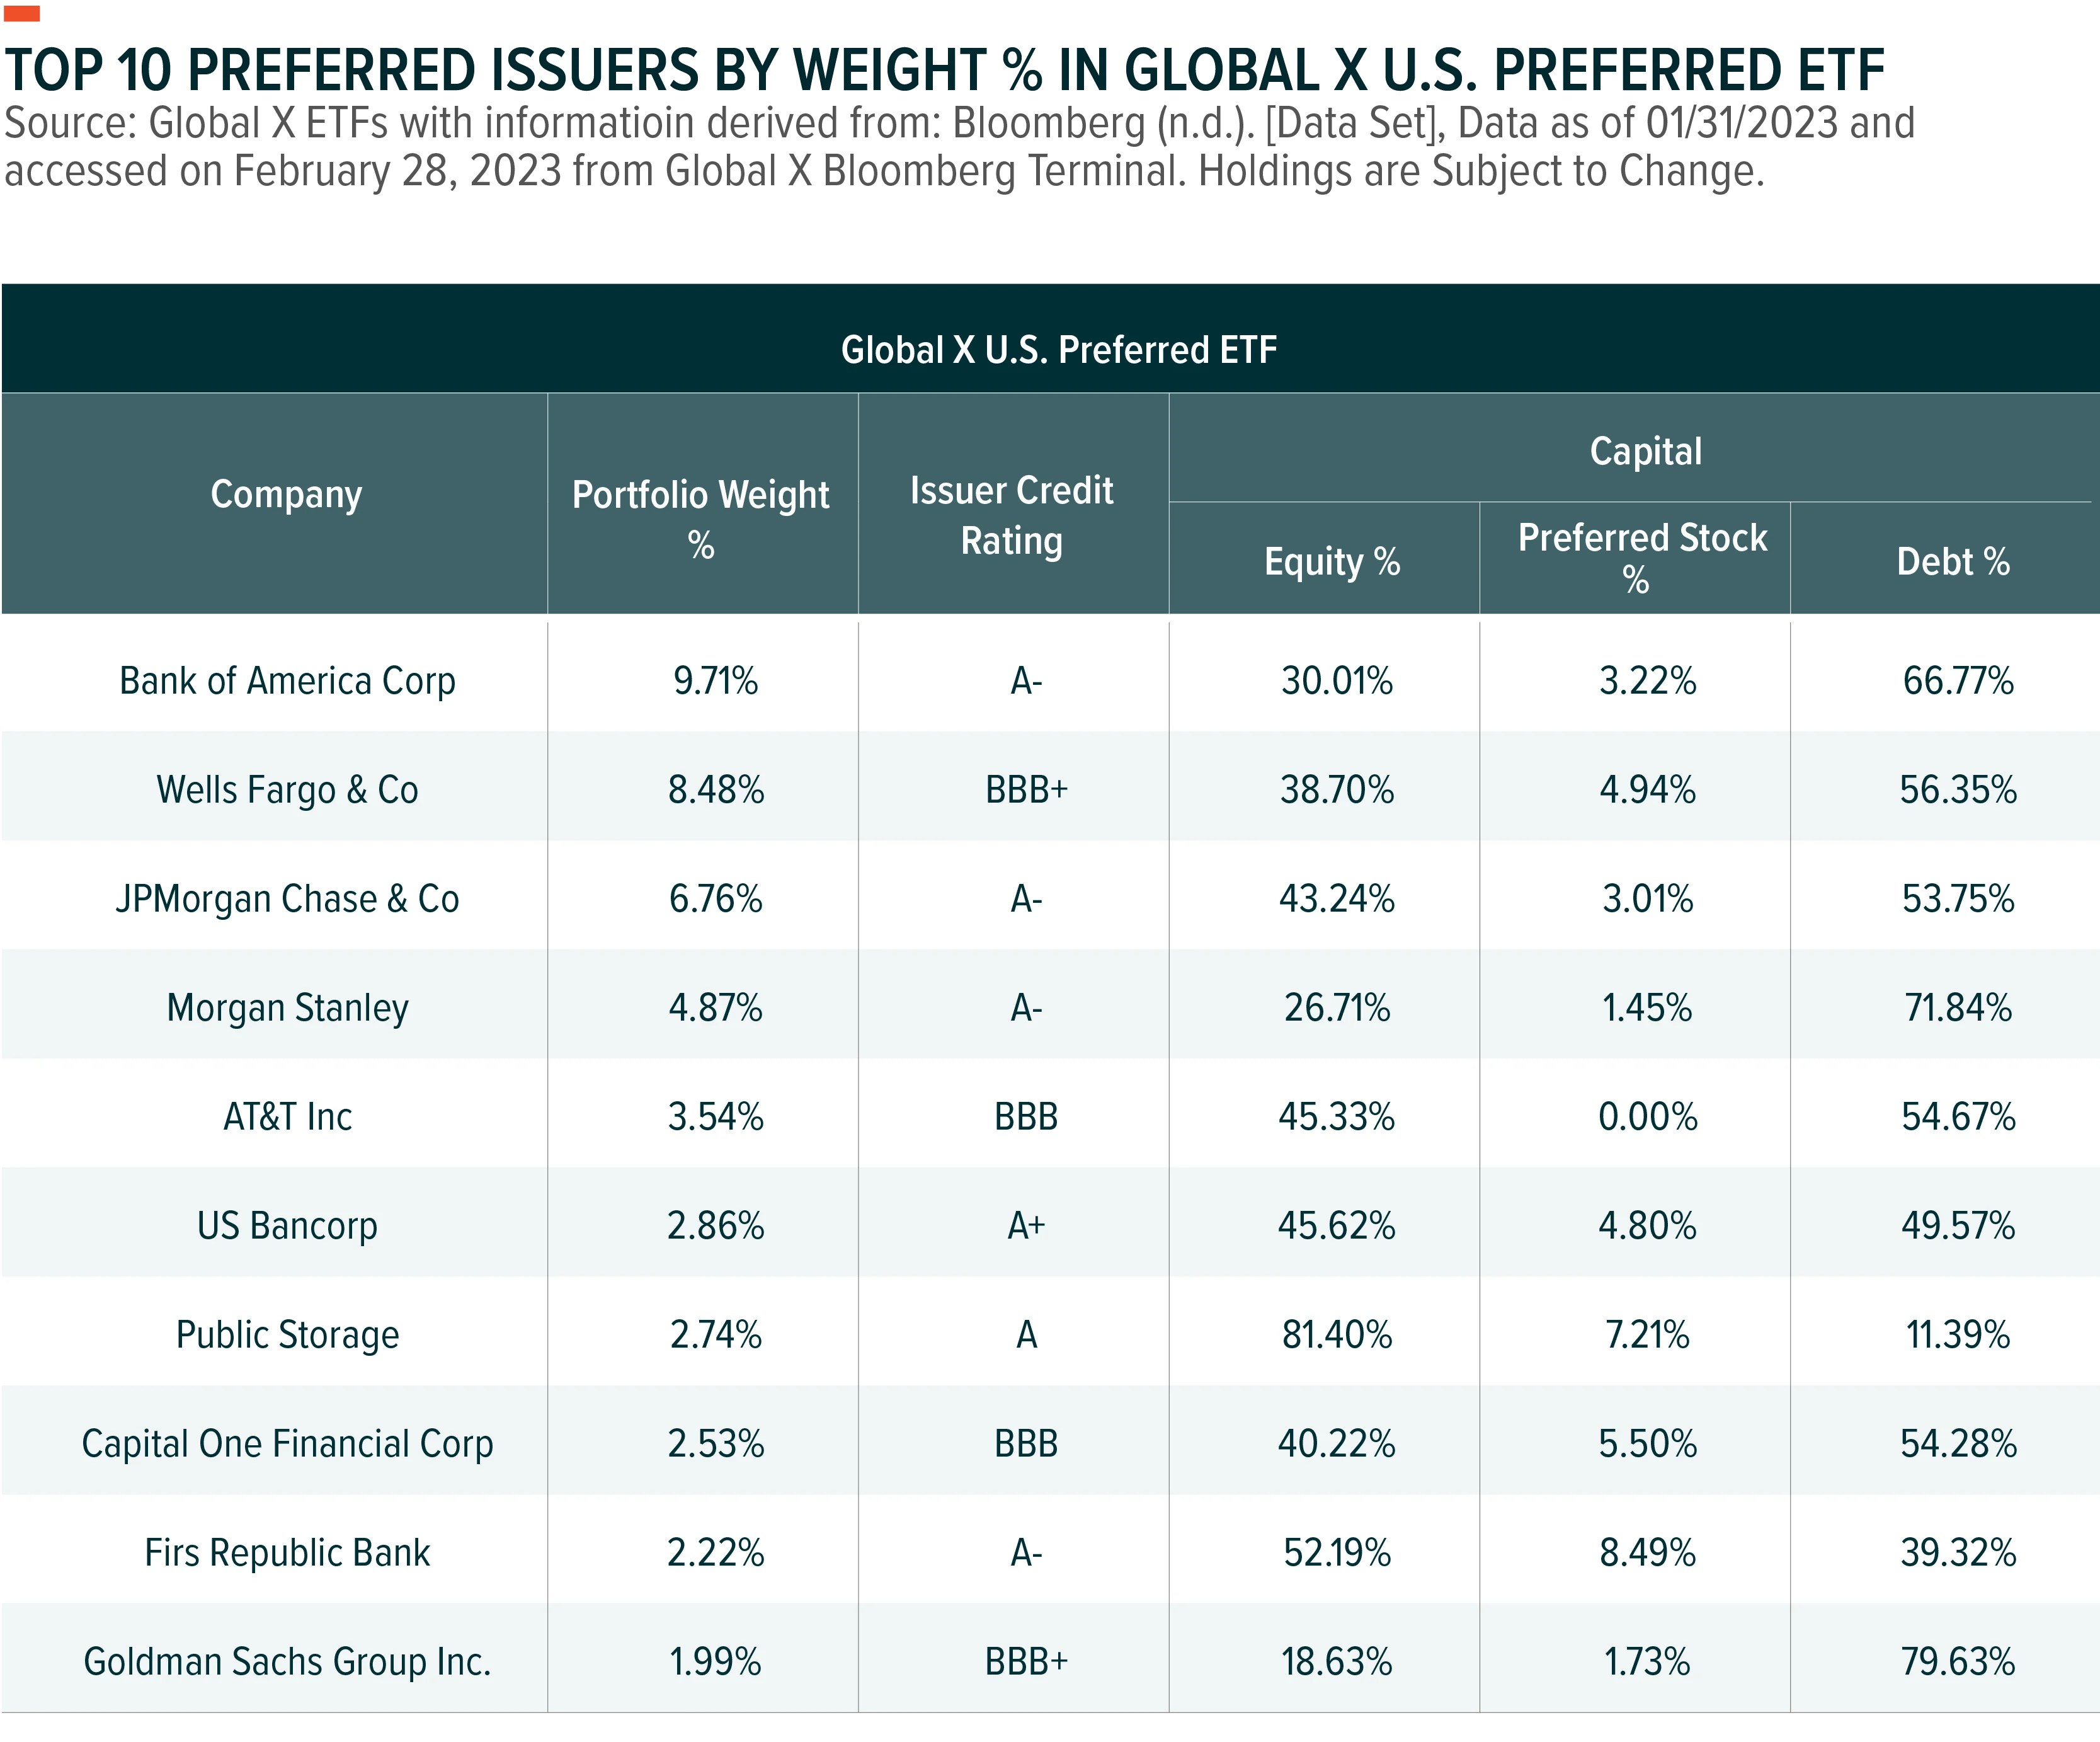
Within the Global X U.S. Preferred ETF (PFFD), the majority of holdings are comprised of large-cap U.S. banks, in which the aggregation of preferred stocks issued by the Top 10 banks held within the fund have credit qualities on long-term obligations of BBB or better, based on ratings assigned by Standard & Poor’s.12 Additionally, the ratio of preferreds to total capital is relatively low, indicating that preferred share dividend payments have a minor impact on the companies' balance sheets.13 These factors assume heightened significance as defaults continue to increase, with the total percentage of North American defaults, including defaults and selective defaults, soaring to 1.1% of total bonds from 0.5% at the beginning of 2022.14 If this trend of rising defaults persists, it may prompt the Fed to retract the contractionary monetary policies currently in place, resulting in a decline in risk-free rates and the widening of option-adjusted spreads for non-investment grade bonds as creditors flee towards less risky investments, thus making preferreds a compelling option for investors seeking yield and total return from high-quality constituents.
MLPs Expected to Perform Amid Tight Energy Markets
Despite the impressive rally in 2021 and 2022, we believe that midstream equities still have upside potential, driven by a combination of attractive valuations, strong balance sheets, elevated commodity prices, and favorable asset class tailwinds during inflationary periods. This view is potentially supported by a few indicators.
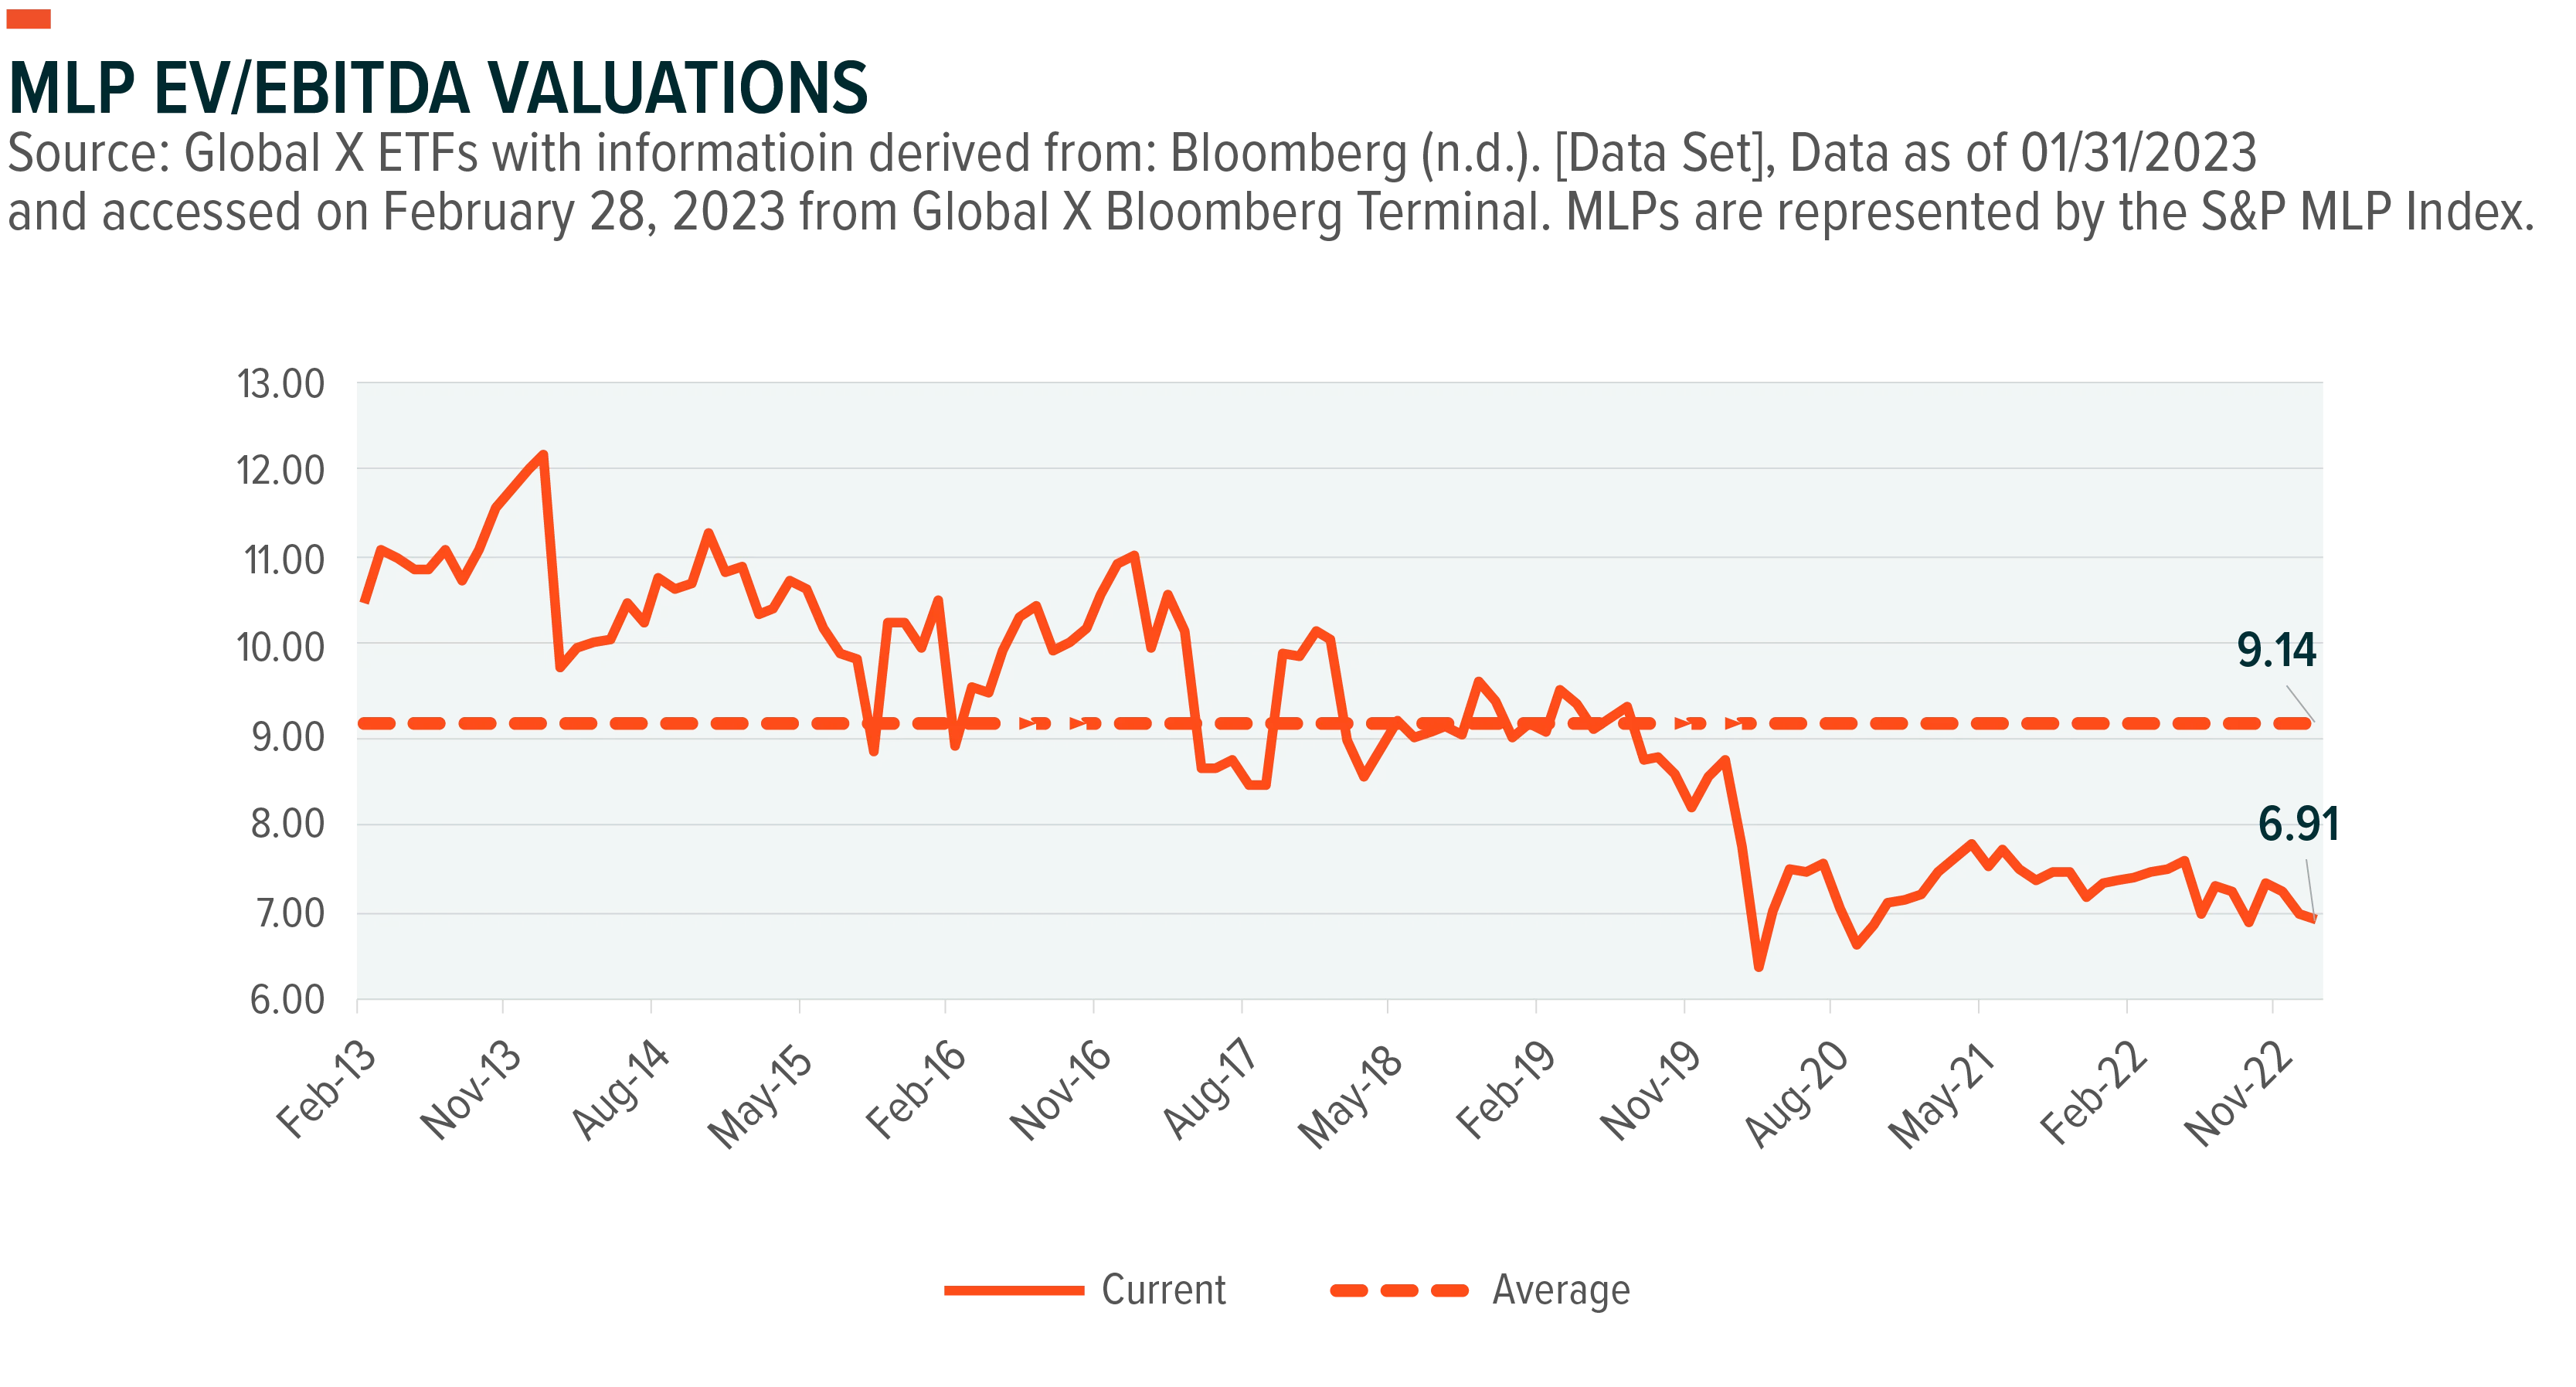
One indicator is that MLP EV/EBITDA ratios remain low relative to historical averages, while cash flow has consistently increased since 2013.15 This positive trend may represent an attractive opportunity to invest in midstream equities. The continued execution of elevated cash flows, returning excess cash to investors through dividend increases and buybacks, can also provide additional support for the sector. Furthermore, the trend of generous shareholder returns is expected to garner attention and potentially drive demand for midstream MLPs within portfolios.
The potential for companies to increase or maintain dividends consistently has been in the spotlight too since sectors less equipped to mitigate inflationary pressures were negatively impacted throughout 2022, relative to those who were able to pass rising input costs to their customers. It was reported by S&P Dow Jones Indices that net dividend changes were lower for 2022 vs. 2021, indicating negative headwinds facing certain dividend payers.16 Furthermore, common equity dividend decreases were up 63% to $14.3B in 2022, compared to $8.8B in 2021.17 Naturally, this has made income investors more selective in choosing companies and strategies that maintain steady, dividend payout ratios.
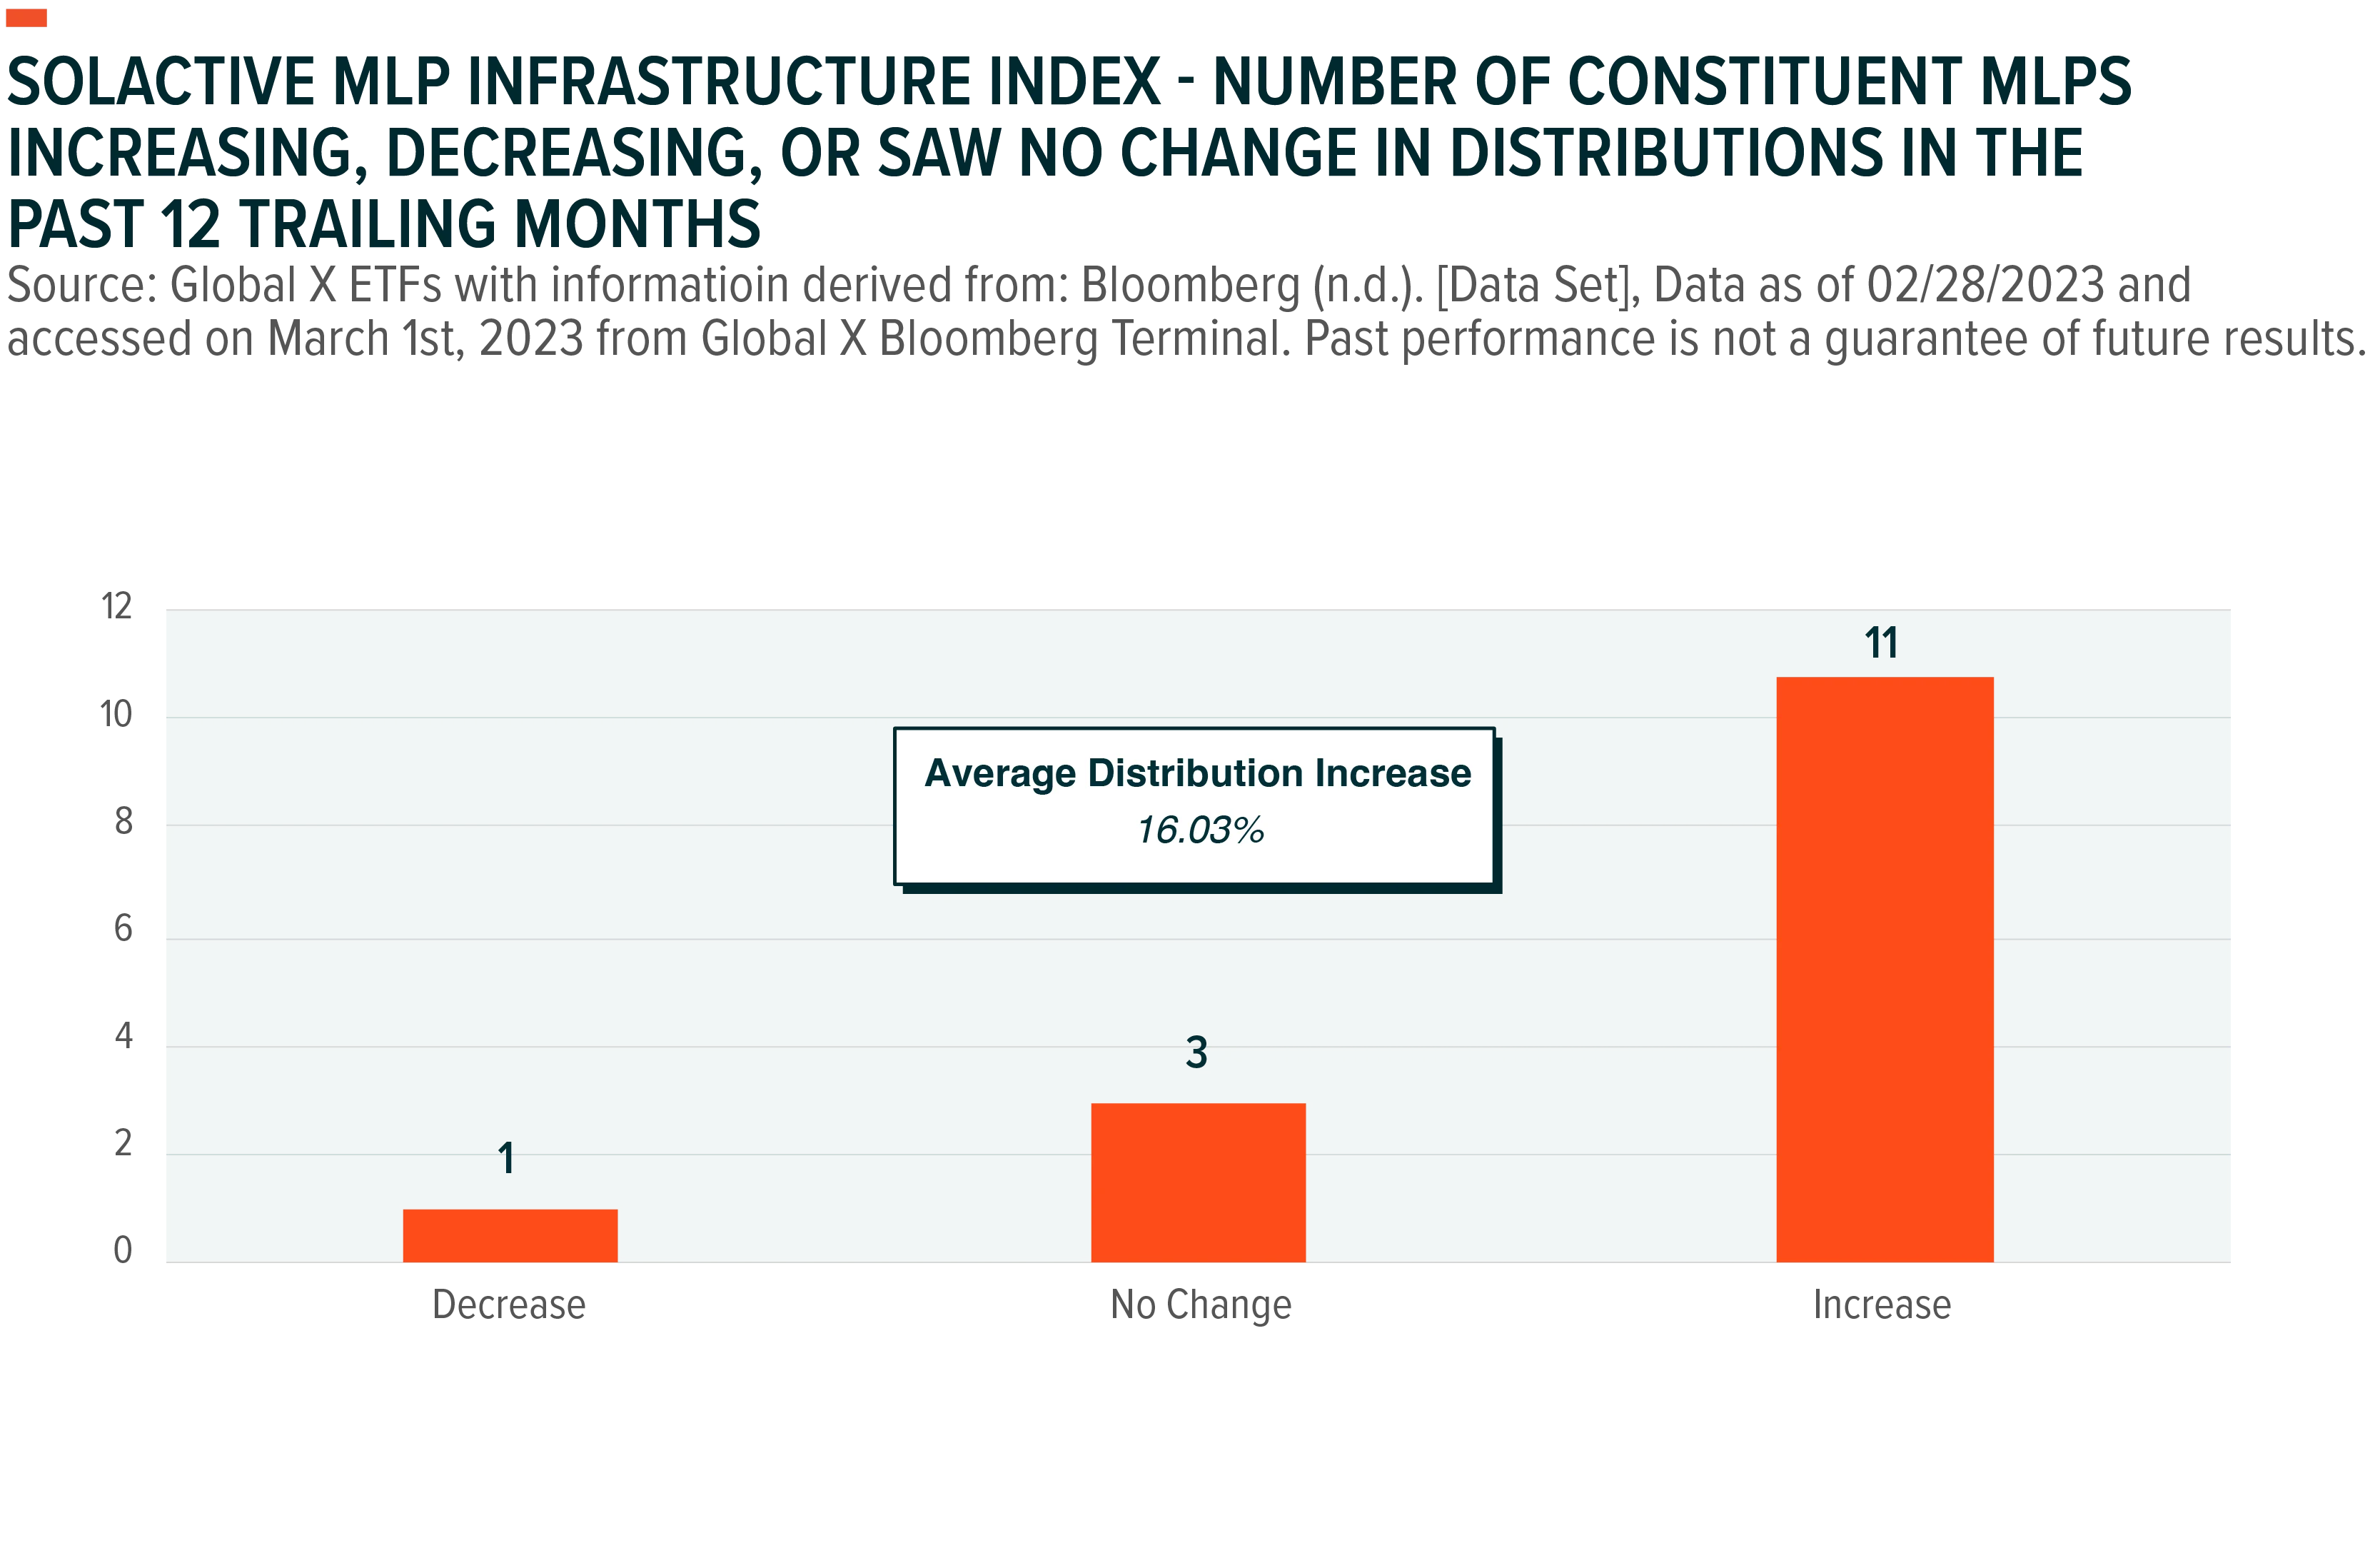
Given the significant increase in energy prices in 2022, midstream companies who operate pipelines and other energy infrastructure assets, offering real asset exposure and inflation adjustments built into contracts, generated higher levels of free cash flow throughout 2022. This translated into distribution increases throughout the MLP landscape in which 73% of the constituents within the Solactive MLP Infrastructure Index saw an increase in distributions over the past 12 trailing months for an average distribution increase of 16% over the same timeframe.18 This is much higher than the dividend growth rate of 7.6% for the 1,200 largest U.S.-listed firms by market cap, for 2022.19 This demonstrates a significant level of confidence within the midstream sector.
Outside of these positive midstream fundamentals, supply and demand have recovered to pre-COVID levels while oil inventories remain significantly below historical averages.20 Goldman Sachs estimates that an additional 1.0 million barrels per day of demand could come online in 2023 as Chinese demand continues to recover from the economy reopening, while Russian supply is expected to decline by more than 0.5 million barrels per day.21 This combination suggests further oil market tightness and provides upside support for crude oil production.
Although many market participants remain uncertain about the future demand for energy, data indicates that tight energy markets are expected to remain constructive, providing pockets of growth opportunities for master limited partnerships. The Energy Information Administration (EIA) forecasts U.S. oil production will increase by 0.5 million barrels per day to an average of 12.4 million barrels per day in 2023, allowing these companies to capitalize on higher oil prices.22 Similarly, solid demand and steady production growth are expected to benefit the midstream sector.
Conclusion: Potential Opportunities for Alternative Income
The investing landscape may offer more questions than answers in 2023, but we believe investors have opportunities to help their portfolios find footing. Among them, is the potential to turn volatility into both income and capital appreciation through a covered call and growth strategy. Looking beyond the U.S. bond market as a matter of course can be prudent and improving emerging market forecasts may present opportunities in the emerging market debt market. Preferred securities can offer a way to capture favorable profitability conditions in the banking sector. And while the world grapples with tight energy markets, MLPs may continue to reap benefits. When it seems like there are too many questions, focusing on investment vehicles that can provide access to different markets and methods of income generation can potentially improve a broader income portfolio.
Performance data quoted represents past performance. Past performance does not guarantee future results. The investment return and principal value of an investment will fluctuate so that an investor's shares, when sold or redeemed, may be worth more or less than their original cost and current performance may be lower or higher than the performance quoted. For performance current to the most recent quarter- or month-end, please click the fund name in the Related ETF section.
Related ETFs
QYLG – Global X NASDAQ 100 Covered Call & Growth ETF
XYLG – Global X S&P 500 Covered Call & Growth ETF
QYLD - Global X NASDAQ 100 Covered Call ETF
XYLD - Global X S&P 500 Covered Call ETF
RYLD - Global X Russell 2000 Covered Call ETF
DJIA – Global X Dow 30 Covered Call ETF
EMBD - Global X Emerging Markets Bond ETF
PFFD – Global X U.S. Preferred ETF