

Get the latest news and updates from our team.
SEI Investments Distribution Co. (1 Freedom Valley Drive, Oaks, PA, 19456) is the distributor for the Global X Funds.
Check the background of SIDCO and Global X's Registered Representatives on FINRA's BrokerCheck.
1. ETF.com. Data from 1/1/10 to 8/31/16. ETFs sourced from Preferred stock classification of ETF.com.
2. Fidelity. Max Rate includes potential Medicare Surcharge tax of 3.8% on Net Investment Income.
3. Morgan Stanley. Max Rate includes potential Medicare Surcharge tax of 3.8% on Net Investment Income.
4. iShares. As of 9/20/16.
5. Morgan Stanley.
6. Bloomberg, iShares. As of 9/25/16.
7. S&P US Preferred Stock Index. As of 8/31/16.
8. Sidley Austin LLP. “Hybrid Capital Product Development—Focusing on Tier 1 and Other Hybrid Capital Products.” March 2010.
Definitions:
BofA Merrill Lynch Fixed Rate Preferred Securities Index tracks the performance of fixed-rate U.S. dollar-denominated preferred securities issued in the U.S. domestic market.
BofA Merrill Lynch US Corporate Index tracks the performance of US dollar denominated investment grade corporate debt publicly issued in the US domestic market.
S&P 500 Index tracks the performance of 500 leading U.S. stocks and is widely considered representative of the U.S. equity market
Yield to Worst is the lowest potential yield an investor can receive on a callable security in the event of the security is either called or if the security is held to maturity.
LIBOR is the London Interbank Offered Rate, which is a short-term benchmark interest rate that a group of banks charge to borrow funds.
The Basel Accords are a set of banking regulations designed to bolster risk management practices in the banking industry and set adequate bank capital levels and classify capital quality.
Tier 1 capital is a firm’s core equity capital that consists of common equity, reserves, and certain non-callable, non-cumulative preferred stock.
Asset Class | Index Name | Definition |
Japanese Equities | MSCI Japan Index | The MSCI Japan Index is designed to measure the performance of the large and mid cap segments of the Japanese market. |
US Large Cap Equities | S&P 500 | The S&P 500 is an index of 500 stocks chosen by factors such as market size, liquidity and industry grouping. The Index is designed to be a leading indicator of U.S. equities and is meant to reflect the risk/return characteristics of the large-cap universe. |
European Equities | STOXX Europe 600 Price USD | The STOXX Europe 600 Index is derived from the STOXX Europe Total Market Index (TMI) and is a subset of the STOXX Global 1800 Index. With a fixed number of 600 components, the STOXX Europe 600 Index represents large, mid and small capitalization companies across 18 countries of the European region: Austria, Belgium, Czech Republic, Denmark, Finland, France, Germany, Greece, Ireland, Italy, Luxembourg, the Netherlands, Norway, Portugal, Spain, Sweden, Switzerland and the United Kingdom. |
US Small Cap Equities | S&P 600 Small Cap | The S&P SmallCap 600® measures the small-cap segment of the U.S. equity market. The index is designed to track companies that meet specific inclusion criteria to ensure that they are liquid and financially viable. |
Emerging Market Equities | MSCI Emerging Markets Index | The MSCI Emerging Markets Index captures large and mid cap representation across 23 Emerging Markets (EM) countries. |
Asia ex Japan Equities | MSCI Pacific Excluding Japan Index | The MSCI Pacific ex Japan Index captures large and mid cap representation across 4 of 5 Developed Markets (DM) countries in the Pacific region (excluding Japan). |
Emerging Market Bonds | Bloomberg USD Emerging Market Sovereign Bond Index | The Bloomberg USD Emerging Market Sovereign Bond Index is a rules-based, market-value-weighted index engineered to |
Short Term US Treasuries | Bloomberg US Treasury 1-3 Index | The Bloomberg US Treasury 1-3 Bond Index is a rules-based, market-value weighted index engineered to measure the performance and characteristics of fixed rate coupon U.S. Treasuries which have a maturity greater than 12 months and less than 36 months. |
Investment Grade Corproate Bonds | iBoxx USD Liquid Investment Grade index | The Markit iBoxx USD Liquid Investment Grade Index is designed to provide a balanced representation of the USD investment grade |
Long Term US Treasury Bonds | Bloomberg US Treasury 10+ Index | The Bloomberg US Treasury 10+ Bond Index is a rules-based, market-value weighted index engineered to measure the performance and characteristics of fixed rate coupon U.S. Treasuries which have a maturity greater 10 years. |
In this stubbornly low interest rate environment, traditional fixed income instruments have largely failed to provide investors with the income they desire from their portfolios. Previously, we have focused on high dividend stocks and REITs as asset classes to consider when looking for opportunities to potentially increase a portfolio’s yield. In this piece, we turn our attention to preferred stocks as another potential solution to investors’ search for yield.
With over $20 billion in net inflows into preferred ETFs since 2010, preferreds have become a popular alternative for investors trying to boost the yield of their portfolios.1 In this piece, we shed light on the preferred stock space by discussing the unique attributes of preferreds, including:
What are preferreds?
What are the yield expectations for preferreds?
How can preferreds diversify a portfolio?
What are some unique features of preferreds?
How do preferreds fit into a portfolio?
Investment Characteristics
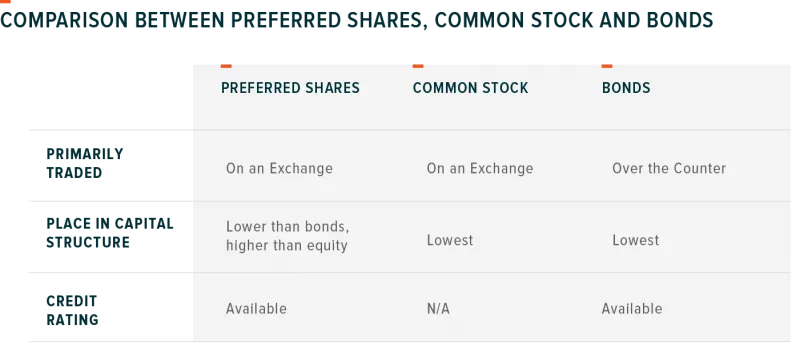
Preferreds are considered hybrid securities because they possess characteristics of both fixed income and equity securities. Like bonds, they are yield-bearing instruments that typically pay a fixed distribution to investors. They are often issued at a par value, assigned credit ratings, and do not have voting rights. Like equities, however, preferreds trade daily on a stock exchange, have the opportunity for price appreciation or depreciation, can have their dividends suspended, and fall in the lower portion of a firm’s capital structure.
Yield Expectations
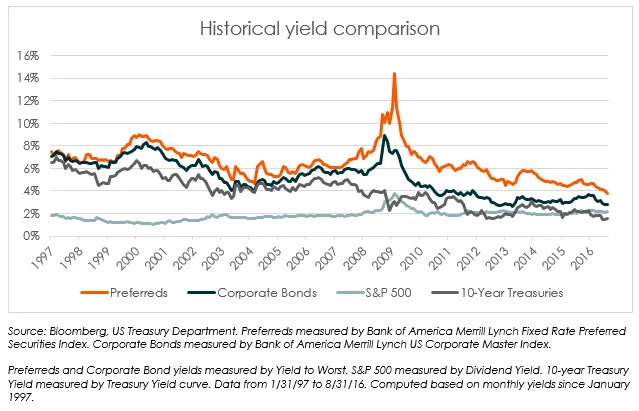
Investors are often drawn to preferreds given their primary focus on distributing regular dividend payments. Given that preferreds are junior on the capital structure to bonds and their dividends are less safe than a bond’s coupon payments, investors demand that preferreds pay a yield premium. As illustrated in the chart below, since 1997, the yield on preferreds has averaged nearly 240 basis points higher than the yield of corporate bonds. Compared to common stocks, their yield advantage has been nearly 570 basis points higher.
A sometimes overlooked advantage of preferreds is that their dividends are often taxed more favorably than bond coupons. Bond coupons are taxed as regular interest income, which can be as high as 43.4% for investors in the highest tax bracket.2 Dividends paid by preferred stocks are often eligible to be classified as qualified dividends (QDI), which are taxed at long term capital gains rates, which top out at 23.8%.3 Therefore, when comparing the yields of bonds and preferreds, we believe they should be analyzed on a post-tax basis for investors holding these instruments in taxable accounts. All else being equal, the after tax-income of a bond paying a 5% coupon is approximately 2.8%, while a preferred paying a 5% dividend yield treated as QDI is approximately 3.8%.
Diversification Qualities
With their unique structure, preferreds can potentially act as an important diversifier for income-oriented portfolios. In the table below, we compare the long-term correlations of preferreds with other major asset classes. Their correlations with all other asset classes included in the chart was less than 0.70 and they demonstrated particularly low correlations with traditional fixed income investments like long-term US treasuries (-0.24) and investment grade corporate bonds (0.17).
Unique Features
Preferred securities can contain a number of unique features, such as being fixed to floating, callable, or convertible. They also are predominately issued by financial institutions, resulting in sector-specific risks.
Fixed-to-Floating:
83% of preferreds are issued at a fixed rate, meaning that dividend payments will not be influenced by rising or falling interest rates.4 Fixed to floating issuances, however, have a specified period during which they pay a pre-determined fixed dividend amount, but after that period expires, the dividend payment can fluctuate based on an interest rate measure such as LIBOR.5 While investors can potentially benefit from this feature if rates rise, the fixed-to-float feature presents a potential risk should rates fall.
Callable:
Preferred securities can also be issued with call features, similar to bonds. The issuing institution sets a predetermined call value and a date at which they can call and redeem the preferred stock. When interest rates fall, investors are more likely to face call risk, as issuers potentially look to lower their cost of capital by calling the shares and issuing new ones at a lower rate. Some preferreds may have multiple call values and dates.
Convertible:
Preferred stock can be issued with a conversion feature, allowing investors to exchange the preferred for common stock. Currently, approximately 5% of the preferred market is convertible.6 The option to convert to common stock gives investors the opportunity to participate with greater potential upside in bull markets, an environment in which preferred shares may lag common shares. In exchange for the conversion feature, these preferreds tend to pay lower yields than non-convertible preferreds.
Overweight Financials:
Preferreds are overwhelmingly issued by financial institutions, with the sector making up 84% of the US preferred market.7 This is due to the fact that certain preferred issuances could fall under a bank’s Tier 1 capital, which is considered the highest quality of capital under the Basel accords.8 Therefore, banks had strong incentives to issue preferreds. Changes in regulatory classifications of certain preferred securities however, could force banks to reconsider the issuing new preferred securities in the future.
Fit in a Portfolio
Given their historically high yields on both a pre-tax and post-tax basis, preferreds offer the potential to increase a portfolio’s income. In addition, their low correlations with equities and traditional fixed income instruments can make them a useful diversifier in portfolio. Their hybrid equity and bond-like characteristics has led portfolio managers to classify preferreds as fixed income, equities, and alternatives, depending on their preferences. One way to implement a preferred allocation in a portfolio is to replace a portion of one’s less tax efficient high yield debt or one’s lower yielding and tax inefficient investment grade debt.
Investors looking to increase their yield potential from preferred securities should consider the Global X SuperIncome® Preferred ETF (SPFF), which invests in 50 of the highest yielding Preferreds in the US and Canada.
View the Standardized Performance of SPFF here.
Rohan Reddy
High Yield Corporate Bonds
Barclays VLI: High Yield Total Return Index Value Unhedged USD
The Barclays Capital High Yield Very Liquid Index includes publicly issued U.S. dollar denominated, non-investment grade, fixed-rate, taxable corporate bonds that have a remaining maturity of at least one year, regardless of optionality, are rated high-yield (Ba1/BB+/BB+ or below) using the middle rating of Moody’s, S&P, and Fitch, respectively.
REITs
FTSE NAREIT Equity REITs Total Return Index USD
The FTSE NAREIT All Equity REITs Index is a free-float adjusted, market capitalization-weighted index of U.S. Equity REITs. Constituents of the Index include all tax-qualified REITs with more than 50 percent of total assets in qualifying real estate assets other than mortgages secured by real property.
Preferreds
S&P Preferred Stock Index
The S&P U.S. Preferred Stock Index is designed to serve the investment community’s need for an investable benchmark representing the U.S. preferred stock market.
Inflation Protected Bonds
Markit iBoxx TIPS Inflation-Linked Nominal Price Return Index
The Markit iBoxx TIPS Inflation-Linked Index measures the performance of Treasury Inflation Protected Securities (TIPS) as determined by Markit iBoxx.
Gold
LBMA Gold Price PM USD
The LBMA Gold Price is set twice daily in USD. ICE Benchmark Administration provides the price platform, methodology as well as the overall administration and governance for the LBMA Gold Price.
Commodities
Credit Suisse Commodities Benchmark S&P GSCI Price Return Index
The Index is designed to provide monthly rebalanced, long-only diversified exposure to commodities through notional investments in rolling futures contracts on physical commodities.
MLPs
Solactive MLP Composite Index Price
The Solactive MLP Composite Index tracks the price movements in shares of the largest entities that are structured as Master Limited Partnerships (MLP) and that are engaged in the transportation, storage, processing, refining, marketing, exploration, production, or mining of natural resources.