


Product ResearchCoreEquity Income Strategies
Introducing EGLE and FLAG: An Innovative Approach to U.S. Equity Investing
J
Jason Anderlik
Apr 16, 20257 min read
Copyright © 2026 Global X. All rights reserved.
SEI Investments Distribution Co. (1 Freedom Valley Drive, Oaks, PA, 19456) is the distributor for the Global X Funds.
Check the background of SIDCO and Global X's Registered Representatives on FINRA's BrokerCheck.
Get the latest news and updates from our team.
Jason Anderlik
Low interest rates and increasing longevity have created a growing need for investments that can potentially deliver both income and growth
According to Fama and French’s research, the highest decile of dividend paying stocks have historically delivered yields averaging 6.4%, while exceeding the total returns of the S&P 500 by nearly 3.2% on an annual basis
The Global X SuperDividend family of ETFs seek to provide an efficient means of gaining exposure to among the highest dividend payers across various geographies and asset classes
Retirement Now Requires Income & Growth
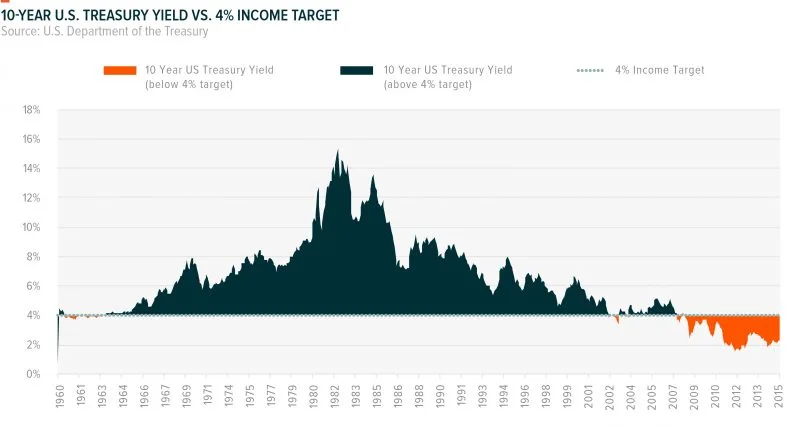
Traditional fixed income instruments have historically played an important role in achieving investors’ income needs. From 1960 to 2015, 10-year US treasuries delivered an average yield of 6.3%, which often provided a high level of income to investors with a relatively minimal level of risk. The current economic climate of dovish central bank policies, however, has resulted in low, and even negative interest rates, which has caused a deep gap between many investors’ income needs and the income often provided by traditional fixed income investments.
The chart below shows the nominal yield of 10-year US treasuries versus the 4% yield figure many investors target to draw regular income from their retirement portfolios. For the last 8 years, 10-year US treasuries have failed to deliver 4% yields and on numerous occasions have fallen below 2%. Given that bond yields are so low, many retirees could be forced to sell their principal to make up for inadequate income from bonds.
Past performance is no guarantee of future results.
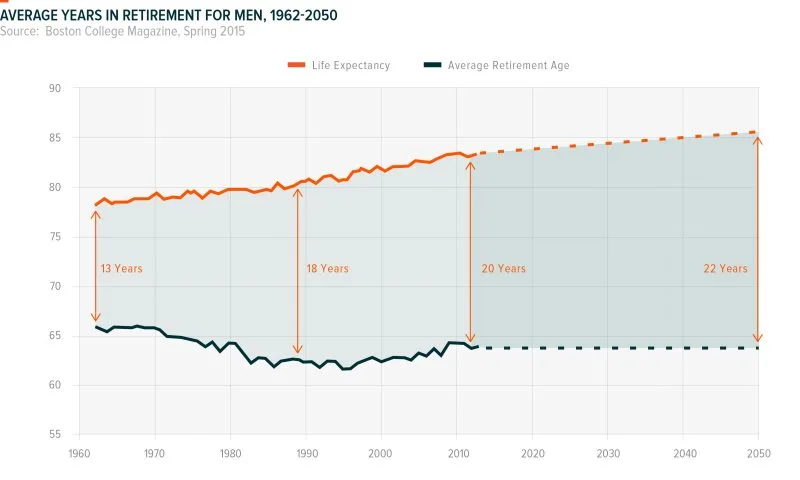
The issue of this pronounced yield gap is exacerbated by the fact that the time spent in retirement is longer than ever. According to researchers, the number of years in retirement has risen from 13 in 1962 to 20 in 2013, and is expected to continue rising as people enjoy longer lifespans1. While investors are receiving sparse yield from bonds, they also need their retirement savings to last over two decades. Therefore, selling one’s principal to make up for the yield gap introduces an acute danger to retirees: longevity risk, or the risk of outliving their retirement savings.
In order to combat the low yield environment and prepare for extended retirements, investors need strategies that can deliver both high enough yields to meet their current income needs and opportunities to grow their principal, which can potentially mitigate longevity risk.
A Look into High Dividend Stocks2
High dividend paying stocks have historically demonstrated the potential to deliver both high income as well as the opportunity to grow one’s principal. To analyze high dividend stocks, we utilized Nobel laureates Eugene Fama and Kenneth French’s research portfolios which ranked all dividend paying stocks in the US and placed them into one of 10 buckets, or deciles, based on their yield3. We specifically looked at the performance and characteristics of just the highest decile of dividend yielders, the top bucket, based on these Fama & French portfolios from 1960 to 2015.
We found that the highest decile of dividend stocks (“the high dividend portfolio”) delivered an average yield of 6.4% with total annualized returns of approximately 13.0%. These total returns exceeded the S&P 500’s annualized returns of approximately 9.8% by nearly 3.2%. Some of this outperformance can be attributed to the deep value-like characteristics of high dividend stocks, as value stocks have historically outperformed the S&P 500. Historically, the high dividend portfolio has demonstrated a correlation of just 0.58 to the S&P 500, but this figure rises to 0.75 when compared to the S&P 500 Value Index4. In addition, this high dividend portfolio delivered superior risk-adjusted returns when compared to the S&P 500 of 0.84 versus 0.78, demonstrating a better risk-return tradeoff.
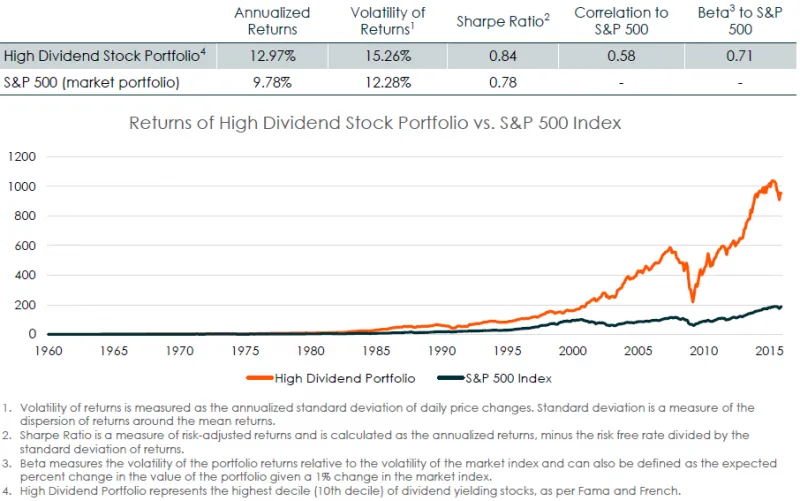
An important characteristic of the high dividend portfolio is that approximately 50% of its total returns have come from dividends paid by the stocks in the portfolio, a figure higher than any other decile of dividend paying stocks.

This means that the price appreciation for high dividend portfolio was annualized at approximately 6.4%, while the income generated by the portfolio represented approximately another 6.4%. If dividends were not reinvested (for example, the dividends were treated as income and spent), the price returns or growth of principal of this strategy would have lagged the S&P 500. However, the historically high yield combined with the price appreciation of the underlying stocks demonstrates that this strategy focused on the highest tier of dividend payers has resulted in both high income and portfolio growth.
(Read our full report on High Dividend Stocks, including how they perform in rising rate environments here.)
An ETF Suite for High Dividend Payers
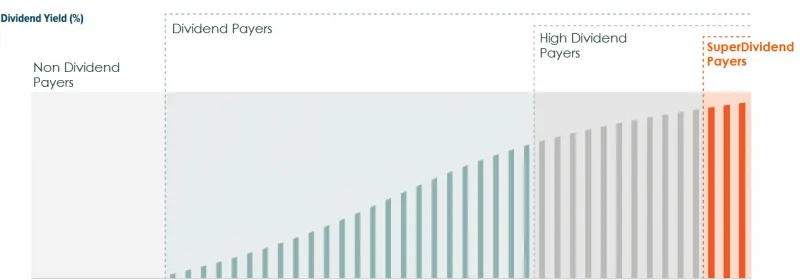
Many dividend-focused ETFs seek broad exposure to dividend stocks, often accessing equities that rank among the top 25% or 50% of dividend payers in the market. The Global X family of SuperDividend ETFs takes a different approach, seeking to provide exposure to only the highest dividend payers in a given geography or asset class, in an effort to maximize the potential income from its holdings. This strategy was heavily influenced by Fama and French’s research portfolios on high dividend paying stocks discussed above, which demonstrated that the highest decile of dividend paying stocks not only has historically generated high income, but has also outperformed the S&P 500 on a total return basis.
The SuperDividend family of ETFs consists of three geography-based and three asset class-focused funds:
Geography
Global: SuperDividend ETF (SDIV)
Emerging Markets: SuperDividend Emerging Markets ETF (SDEM)
Asset Class
Preferreds: SuperIncome Preferred ETF (SPFF)
Alternatives: SuperDividend Alternatives ETF (ALTY)
Below is a comparison of the yields of each SuperDividend ETF compared to recognizable benchmarks for its segment.
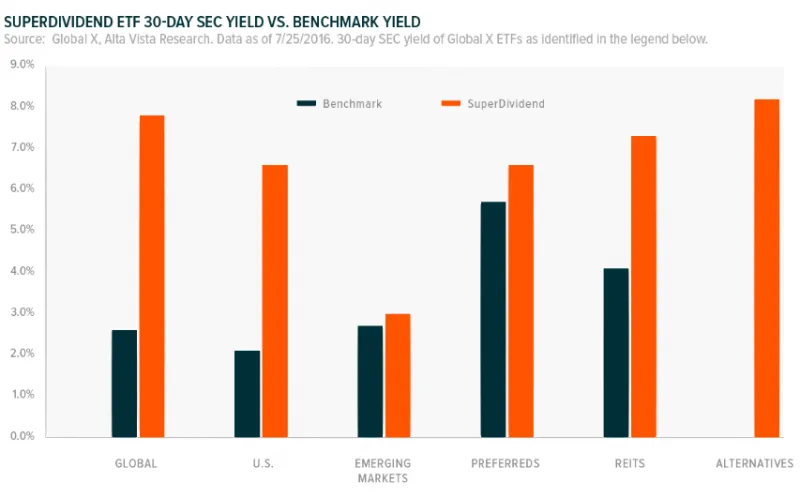
Click on the fund tickers linked above for standardized performance of each ETF individually.
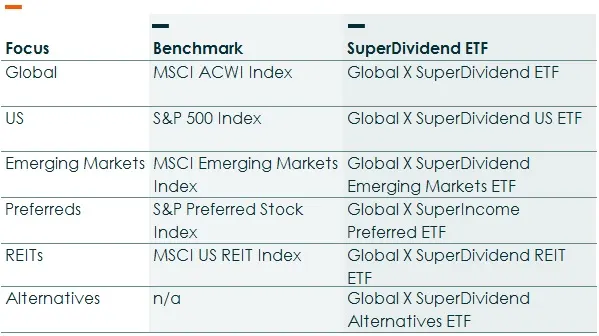
We believe the SuperDividend suite of ETFs can be useful additions to a portfolio to potentially enhance its yield, while maintaining the potential for growth of principal. This yield can potentially be used to meet current income needs that are not being met by traditional income-generating asset classes, like government and investment grade corporate bonds. In addition, the yield can be reinvested and potentially generate returns even in sideways markets or low growth environments.
1. Source: Boston College Magazine, Spring 2015.
2. High dividend stocks are defined as the top decile of dividend paying stocks. Deciles are ten tiers of stocks based the ranking of a common characteristic. For this analysis, all stocks are ranked by dividend yield and those in the 90th percentile or higher are included in the highest, or 10th decile. Stocks in the 80th to 90th percentile range are included the 9th decile, and so on. Stocks with the lowest dividend yields are in the 0th to 10th percentile range and are included in the lowest, or 1st decile.
3. Portfolio returns sourced Fama and French Portfolios Formed on Dividend Yield (http://mba.tuck.dartmouth.edu/pages/faculty/ken.french/data_library.html) where all stocks listed on NYSE, AMEX, and NASDAQ have been considered. Stocks have been segregated into 10 portfolios (deciles) based on dividend yield (D/P).
4. Data from 1985 to 2015,constrained by the S&P 500 Value Index. Correlation is a statistical measure that represents how the price movements of two securities move in relation to each other. A correlation of 1 indicates that the historical price movements of two securities have been in perfect lockstep. A correlation 0 indicates that the historical price movements of two securities are entirely unrelated.
Definitions:
S&P 500 Index: The S&P 500 is an index of 500 stocks chosen by factors such as market size, liquidity and industry grouping. The Index is designed to be a leading indicator of U.S. equities and is meant to reflect the risk/return characteristics of the large-cap universe.
S&P 500 Value Index: The S&P 500 Value Index consists of value stocks in the S&P 500 using three factors: the ratios of book value, earnings, and sales to price.
MSCI ACWI Index: MSCI ACWI captures large and mid cap representation across 23 Developed Markets (DM) and 23 Emerging Markets (EM) countries. With 2,481 constituents, the index covers approximately 85% of the global investable equity opportunity set.
MSCI Emerging Markets Index: The MSCI Emerging Markets Index captures large and mid cap representation across 23 Emerging Markets (EM) countries.
S&P U.S. Preferred Stock Index: The S&P U.S. Preferred Stock Index is designed to serve the investment community’s need for an investable benchmark representing the U.S. preferred stock market.
MSCI US REIT Index: The MSCI US REIT Index is a free float-adjusted market capitalization index that is comprised of equity REITs. The index is based on MSCI USA Investable Market Index (IMI) its parent index which captures large, mid and small caps securities. With 150 constituents, it represents about 99% of the US REIT universe and securities are classified in the REIT sector according to the Global Industry Classification Standard (GICS®). It however excludes Mortgage REIT and selected Specialized REITs.
On April 16th, Global X listed two ETFs that may offer innovative ways to evolve core allocations and reflect a rapidly changing world.
On April 16th, Global X listed two ETFs that may offer innovative ways to evolve core allocations and reflect a rapidly changing world.