 Global X Research Team
The latest Global X Scientific Beta Japan ETF (SCIJ) performance can be viewed here.
From 2014 to 2015, over $5 billion flowed into ETFs that provide exposure to Japanese equities while seeking to hedge the currency risk of fluctuating exchange rates between the Japanese yen (JPY) and US dollar (USD)1. Many investors were drawn to these strategies because of the possibility of significantly outperforming unhedged benchmarks, which would suffer from a depreciation of the yen versus the dollar. Currency hedged strategies have also been utilized as a method of reducing portfolio risk because removing exposure to currency movements can decrease the volatility of a portfolio.
Meanwhile, just before the start of 2014, the EDHEC-Risk Institute’s indexing arm, Scientific Beta, launched a suite of multi-factor indexes, including the SciBeta Japan Multi-Beta Multi-Strategy ERC Index (SciBeta Japan Index). The strategy seeks to generate excess returns versus cap-weighted benchmarks by providing exposure to stocks that exhibit historically well-rewarded factors: Value, Momentum, Size, and Low Volatility. The strategy also seeks to reduce unrewarded risks through a weighting scheme focused on improving upon the diversification of cap-weighted indexes and alternative weighting strategies.
We believe that decisions between hedging or not hedging currency exposure can be a source of alpha for more tactical investors. For long term strategic investors, however, currency movements are cyclical and not expected to generate returns. Therefore, long term outperformance should be sought from systematic sources of return premiums, such as persistent factors with strong academic consensus.
- Since 2014, Scientific Beta’s multi-factor approach to Japan has resulted in better performance, lower volatility, and lower drawdowns than both the hedged and unhedged versions of the MSCI Japan Index2.
- While hedging yen exposure worked spectacularly from 2014 to mid-2015, the currency ultimately reversed course and eliminated much of the strategy’s gains versus the unhedged benchmark.
- Seeking outperformance from well-rewarded factors has generated more consistent outperformance versus both hedged and unhedged benchmarks.
- Hedging the yen has resulted in higher volatility and greater drawdowns due to the negative correlation between the yen and Japanese large cap stocks.
- Scientific Beta’s focus on mitigating the concentration risks of cap-weighted benchmarks and diversifying factor exposures has resulted in lower volatility than both hedged and unhedged benchmarks.
Performance
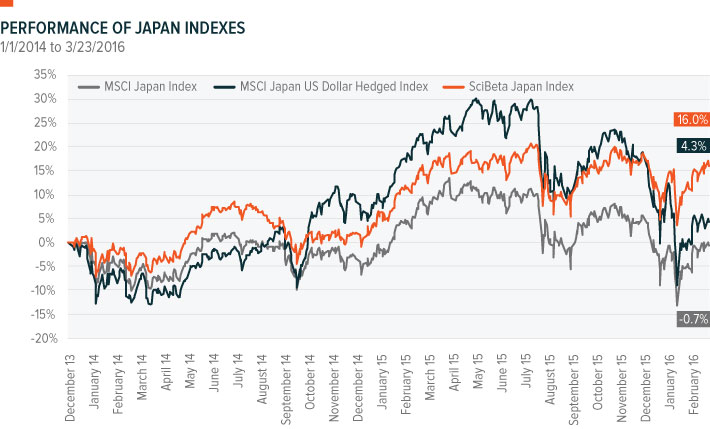
Source: Bloomberg, 12/31/2013 to 3/23/2016
MSCI Japan US Dollar Hedged Index (“hedged benchmark”): a close estimation of the performance that can be achieved by hedging the currency exposures of the MSCI Japan Index (“unhedged benchmark”).
From 2014 to June 2015, the currency hedged MSCI Japan US Dollar Hedged Index outperformed the MSCI Japan Index by nearly 20%, due to strong depreciation of the yen. Over this time, the hedged benchmark index experienced returns of 30.1%, while the unhedged benchmark was up only 11.1%.
Since June 2015, however, the yen has reversed course and appreciated versus the dollar, which has narrowed the gap between the hedged and unhedged benchmarks amid a broader selloff of Japanese equities. From June 2015 to present, the MSCI Japan US Dollar Hedged Index is down -19.8%, while the MSCI Japan Index is down -11.6%, an 8% difference.
Overall, the hedged approach has outperformed the unhedged benchmark (4.3% vs. -0.7%) as the yen has ultimately depreciated since the beginning of 2014. However, the two distinct periods of strong outperformance and underperformance versus the MSCI Japan Index demonstrate the high potential for differences in returns between hedged and unhedged indexes.
Source: Bloomberg, 12/31/2013 to 3/23/2016
Scientific Beta Japan Multi-Beta Multi-Strategy ERC Index (“SciBeta Japan”): a multi-factor index that seeks to outperform a cap weighted benchmark such as the MSCI Japan Index, with similar or lower risk. The index does not hedge currency exposures.
Scientific Beta’s multi-factor approach outperformed the MSCI Japan Index in 2014, 2015 and Year to Date.
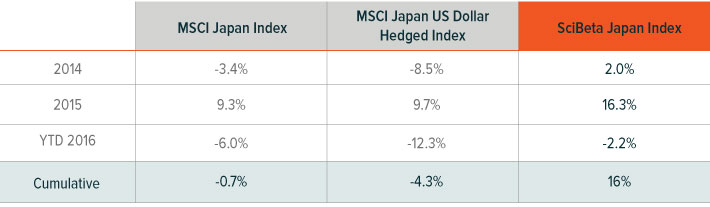
Source: Bloomberg, 12/31/2013 to 3/23/2016
Much of this performance is attributable to the strategy’s exposure to historically well rewarded factors such as Size (mid cap stocks), Momentum, Value and Low Volatility. In particular, since 2014, mid cap stocks and low volatility stocks have performed very well in Japan, boosting returns for strategies with exposures to these stocks. Traditional market cap weighted benchmarks such as the MSCI Japan Index tilt much of their exposure towards large caps and growth stocks. While growth stocks have recently outperformed their value counterparts, large caps have significantly underperformed mid caps, which has hindered the performance of the MSCI Japan Index3.
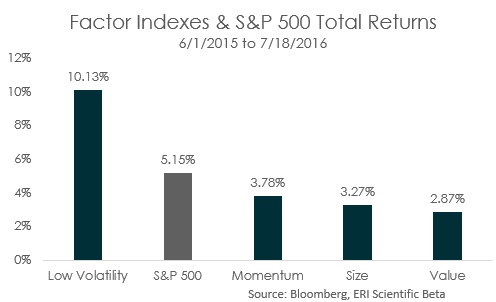 Source: ERI Scientific Beta, 12/31/2013 to 3/23/2016. Orange columns are historically well rewarded factors that are targeted by the Scientific Beta multi-factor strategy. Gray bars are the opposite sides of those well rewarded factors.
Scientific Beta’s multi-factor approach does not hedge the yen’s currency risk, and therefore in periods of strong yen depreciation, such as 2014, the SciBeta Japan Index lagged the hedged benchmark. However as the yen bottomed out in 2015 and appreciated in 2016, the SciBeta Japan Index’s outperformance versus the hedged benchmark became even more pronounced than the unhedged MSCI Japan Index.
Risk
MSCI Japan US Dollar Hedged Index
Currency hedging is often framed within the context of portfolio risk. Currency risk can increase the volatility of an investment and is ultimately not rewarded over the long run. Therefore, investors who want to remove this risk will seek to mitigate it.
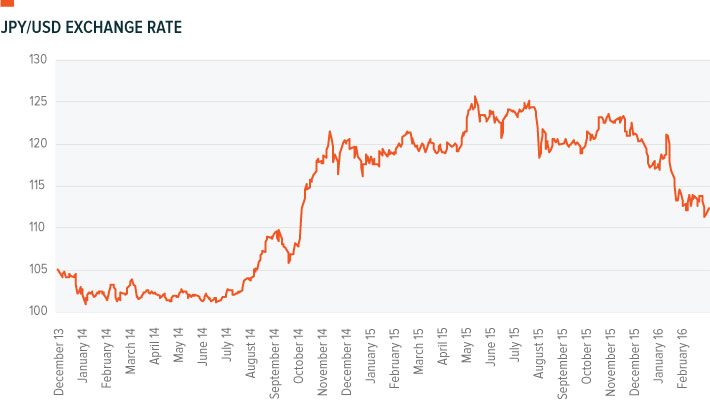
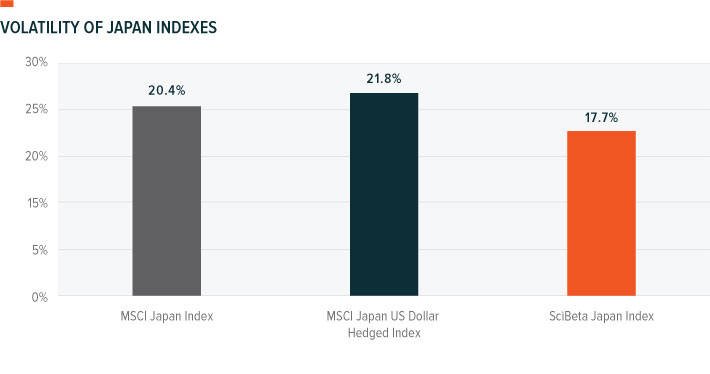
Buying Japanese stocks and hedging the currency exposure, however, has not reduced volatility, as the hedged MSCI Japan Index ultimately demonstrated higher realized volatility than the unhedged version since 2014. How did this happen? The JPY to USD exchange rate has exhibited a -0.38 correlation with the performance of the MSCI Japan Index in local JPY terms. Because of this negative correlation between Japanese stocks and the currency movements, maintaining exposure to the yen has had a positive diversification effect on the overall investment. A hedged approach removes this element of diversification, which results in higher volatility.
Source: Bloomberg, 12/31/2013 to 3/23/2016
The theory as to why the Japanese market has had a negative correlation with the currency is that much of the exposure in a market cap weighted index, like the MSCI Japan Index, is concentrated in large export-focused companies like Toyota and Mitsubishi. These companies become more competitive as the yen gets cheaper, so as the yen depreciates, their earnings rise. This relationship also explains some of the recent outperformance of mid caps over large caps, which has enhanced the performance of the SciBeta Japan Index. Mid cap companies tend to be more domestically focused than the export-oriented large cap stocks and therefore they have been hurt less by the recent appreciation of the yen.
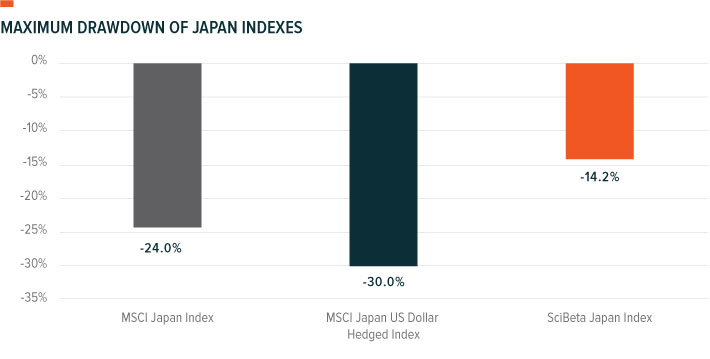
Last, the correlation between the appreciating yen and the falling stock market has exacerbated the drawdowns for hedged indexes. Unhedged indexes have benefited from the recent currency appreciation, while suffering from the stock sell off, resulting a partial canceling out effect. Hedged indexes, however have not benefited from this currency appreciation and felt the full impact of the stock selloff.
Scientific Beta Japan Multi-Beta Multi-Strategy ERC Index
Scientific Beta’s approach to risk is to mitigate the concentration risks that plague market cap weighted indexes, the factor risk of investing in a single-factor strategy, and model-specific risks of alternative weighting schemes4. This multi-layered approach to diversification has produced lower volatility than both hedged and unhedged versions of MSCI’s Japan Index, as well as lower drawdowns. Further, the strategy has benefitted from an average allocation of 19% towards low volatility stocks, which by nature, tend to have less volatility and lower drawdowns than the broad market.
Source: Bloomberg, 12/31/2013 to 3/23/2016
Conclusion
Since 2014, Scientific Beta’s multi-factor approach to Japan has resulted in better performance, lower volatility, and lower drawdowns than both the hedged and unhedged versions of the MSCI Japan Index. While hedging yen exposure worked spectacularly through mid-2015, the currency has ultimately reversed course and eliminated much of the strategy’s outperformance versus the unhedged benchmark. Further, hedging the yen resulted in higher volatility and greater drawdowns due to the negative correlation between the yen and the Japanese large cap stocks.
We believe that decisions between hedging or not hedging currency exposure can be a source of alpha5 for more tactical investors. For long term strategic investors, however, currency movements are cyclical and not expected to generate returns. Therefore, long term outperformance should be sought from systematic sources of return premiums, such as persistent factors with strong academic consensus.