 Global X Research Team
Two years have already passed since oil fell below $100/barrel and one year since the commodity first crossed below $50. While Q1 saw oil touch the mid $20’s, oil’s recent stabilization around the mid-$40s has resulted in a period of relative calmness, giving us an opportunity to pause and take stock of what we’ve learned about MLPs in this new era of low oil prices.
In the analysis below, we explore what we believe are three important takeaways for investors about the current state of the MLP space and how it performed in a volatile and trying environment:
- Active vs. Passive: Actively managed MLP mutual funds largely failed to deliver alpha or to limit downside risk versus a low cost passive ETF, like MLPA.
- MLP correlations with oil are generally low, but rise sharply when oil prices fall below approximately $40/barrel.
- MLP distributions: Midstream MLP distributions have proven to be robust in the low oil price environment, but one major firm has cut their distribution and others have made deals with their general partners to strengthen their balance sheets.
Active vs. Passive
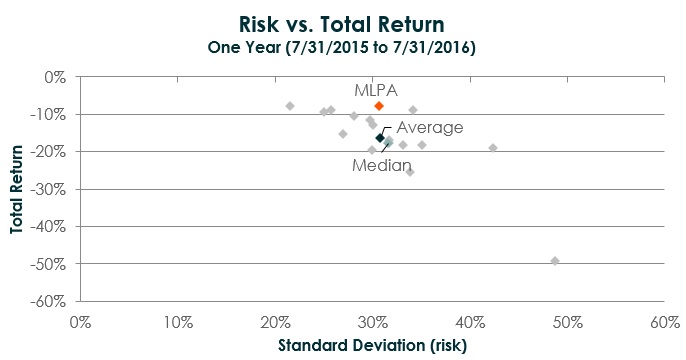
In Q1 2016, MLP volatility spiked as oil prices fell to multi-year lows in the mid-$20s. During this time, we often heard active MLP mutual fund managers claiming that “there has never been a more important time for active management,” as their experience and ability to adjust portfolio exposures would help navigate the difficult period. If this claim were indeed true, we believe that the average or median actively managed MLP C-Corp1 mutual fund should have either outperformed or limited downside risk better than a passive benchmark-tracking MLP ETF, like Global X’s MLP ETF (MLPA).
Looking back over the last year, however, we see that only one of the 16 mutual funds outperformed MLPA. On average, this group of funds returned -16.88% over the last year, with 31.71% volatility. By comparison, MLPA returned -8.02%, over 850 basis points better, with slightly lower than average volatility of 30.72%.2
Sources: Bloomberg, Morningstar. Average and median figures refer to the average and median risk/returns of all mutual funds considered in the analysis.
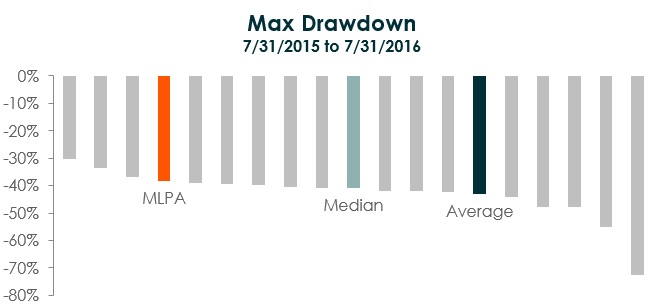
Similar results emerge, if we look at the maximum drawdowns over the last year. Many investors look at maximum drawdowns to judge how a manager is doing at limiting an investor’s losses in the bear market. MLPA’s maximum drawdown of -38.21% ranked it fourth best out of the group, with average mutual fund drawdowns amounting to -43.04%, and median drawdowns coming to 40.74%.2
Source: Morningstar, 2016.
Over a short time frame, we would expect a passively managed index fund like MLPA to deliver somewhere around average results versus actively managed peers – a few would outperform and a few would fall behind. The value of a passive fund is expected to be realized over the long term as active manager returns regress to the mean and the benefits of lower management fees associated with passive funds compound over time (0.45% for MLPA vs. an average of 1.04% for active MLP mutual funds).3
The significant underperformance of actively managed MLP mutual funds and deep drawdowns over the last year, when compared to MLPA, demonstrates that MLP fund managers largely failed to navigate the markets during this difficult period. With the lack of transparency into mutual funds, it’s difficult to pinpoint the reasons for this underperformance, but it is likely due to managers either reaching for yield by overexposing their portfolios to weaker upstream MLPs, or simply mis-timing trades amid the heightened volatility. Whatever the drivers are for the broad underperformance, we believe that this active management risk materialized at one of the worst possible times. As actively managed mutual funds continue to lose assets in favor of cheaper passive funds, we believe the MLP asset class should be no exception.4
MLP Correlations with Oil
In last quarter’s MLP insights, we discussed how correlations between price changes in oil and MLPs tend to rise as oil prices fall. In Q2, oil prices rebounded, demonstrating the reverse of this effect: As oil prices recovered, correlations began to fall towards more normal levels. This was the case until July when oil began to sell off again and flirt again with $40/barrel.5
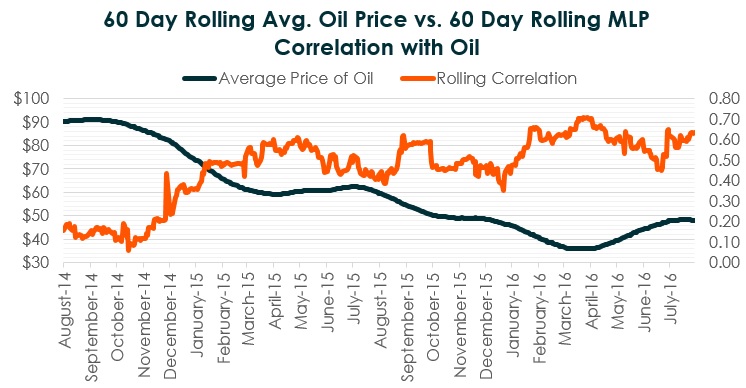
Source: Bloomberg. Data from 7/31/2014 to 7/31/2016.
We found that $40/barrel is an important level to watch with respect to MLP correlations with oil. For reference, over the last 15 years, midstream MLPs have demonstrated a 0.38 correlation to oil.6 Over the last two year period, the correlations when oil was in the $45-$65/barrel range were around 0.45-0.52- higher than the long term average, but not yet very significant. When oil fell to the $35-45 range, correlations increased to a more substantial 0.60, and then to almost 0.70 when oil fell below $35/barrel.
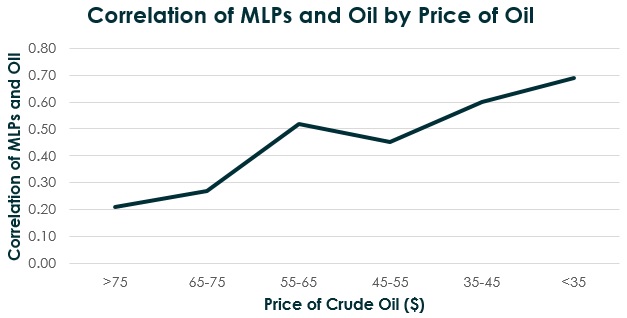
Source: Bloomberg. Data from 8/1/2014 to 7/31/2016.
MLP Distributions
In Q2 2016, 10 of the 21 midstream MLPs in MLPA increased their distributions, while 11 kept them flat. This resulted in a quarterly average distribution increase of 1.12%, while the average coverage ratio was a comfortable 1.18x. In each quarter since the beginning of the low oil environment in Q3 2014, we have seen positive average distribution growth. However, we did see the first announcement from a major midstream MLP cutting their distributions. Plains All American Pipeline LP announced an upcoming Q3 distribution cut. In addition Williams Partners and Energy Transfer Partners announced changes with their general partners (GPs) that could shore up the strength of their balance sheets and distributions. These entities had three of the four lowest Q2 coverage ratios of MLPA’s holdings.7 Below is a summary of these announcements:
- Plains All American Pipeline LP (PAA) announced a simplification process of their corporate structure and a distribution cut of -21% for Q3. PAA announced it will buy out its general partners’ economic interests through an equity issuance and remove the IDR (Incentive Distribution Rights) payments, thereby reducing their cost of equity and improving their coverage ratio.
- Energy Transfer Partners (ETP) was given a form of distribution relief by its GP parent, Energy Transfer Equity (ETE). ETE waived $720 million in contractual IDR payments over the next 6 quarters, in exchange for $1.8 billion in depreciation, depletion and amortization.
- Williams Cos (WMB), the general partner to Williams Partners LP (WPZ), elected to make a 69% cut to their Q3 distribution, which will remain effective through 2017. Williams Cos said they will use these savings to pruchase $1.7 bn of new LP units of WPZ. Rather than paying cash distributions to WMB, these units will essentially pay out new units as distributions, which will free up money for WPZ to invest in future capex growth or to reduce its debt.
Global X’s overview on the General Partners of MLPs can be read here.
Each of these three moves help to improve the balance sheet and distribution strength for these MLPs. While the market has been fearful of distribution cuts in the MLP space, PAA, ETP, and WPZ all traded higher the day after making their announcements, demonstrating that the market had largely already priced in these moves (particularly after the failed ETE- WMB merger) and is now rewarding balance sheet strength. It is possible that additional MLPs will implement creative arrangements with their general partners in order to free up cash for future growth projects or debt reduction.
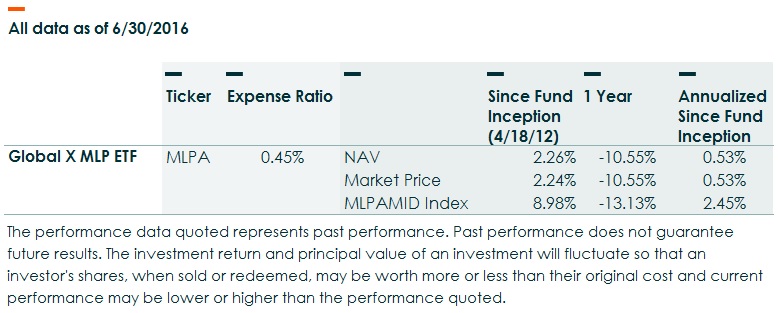
MLPA Standard Performance:
For Fund performance, please click on the fund ticker: MLPA, MLPX