The last month felt like a year. Halfway through the first earnings season of 2026, and markets have already experienced two volatility spikes.1 The first followed the nomination of Kevin Warsh as Federal Reserve chair and hotter-than-expected producer inflation. The second emerged as mega-cap doubled down on AI investment, stoking fears that firms may struggle to deliver the expected growth and profitability. That concern is likely overdone, as AI integration at the enterprise and consumer agentic levels remains in the early innings.2
Good news is that the breadth of companies participating in the productivity boom is improving and delivering results. Large cap companies have consistently beaten expectations this earnings season and generally revised guidance higher, breaking from historical norms.3 Parsing the data to contextualize recent events helps explain the market rotation and hints at themes to consider. It also provides reassurance that the backdrop remains favorable for risk assets, including popular themes like AI and emerging areas such as materials tied to energy and infrastructure.
Key Takeaways
- Equity markets have been, and are likely to remain, driven by fundamentals rather than rates.
- Earnings performance and forward guidance provide strong support at the start of 2026.
- Profit growth and capex trends suggest that a meaningful economic broadening is underway, and while parts of the AI-linked technology sector likely remain attractive, the recent equity rotation may also signal emerging opportunities based on shifting fundamentals.
A Fundamentals-Driven Market
At the start of 2026, rate markets were pricing in two cuts for the year, but expectations for a second cut have declined.4 The Warsh nomination coinciding with a bout of equity volatility reopened the question whether this market is fundamentals- or rates-driven. The market’s initial read labeled Warsh as a hawk less likely to lower rates in the near term, but we believe that might be too simplistic of a view.5
The hawk–dove narrative misses the broader point: Warsh is likely to take a holistic view on economic growth. For years, the former Fed governor has advocated for policies that would promote economic growth through investment and productivity.6 Lower rates could help accelerate investment, suggesting the probability of two or three cuts remains reasonably high. That said, Warsh would likely look to offset the inflationary pressure from rate cuts through balance sheet reduction, effectively unraveling quantitative easing (QE) policies. He has been critical of QE in the past, noting that the Fed’s intervention impedes market-determined asset prices and investment.7
In theory, lower rates combined with a reduced Fed presence in markets would be a pro-growth mix. Of course, reducing the $6.6 trillion balance sheet is easier said than done and could drive rates higher as the supply of securities increases.8 Deregulation of the financial system, and specifically lower capital requirements for banks, could free up capacity to absorb the supply and minimize the impact on rates.
Despite the volatility around Warsh’s nomination and the perceived rate impact, we view this market as fundamentals-driven. With the large-cap cost of capital still relatively high, lower rates can lift valuations, but that may just be the icing on the cake.9 Equity markets advanced on strong fundamentals in 2025, and we believe that trend is likely to persist.
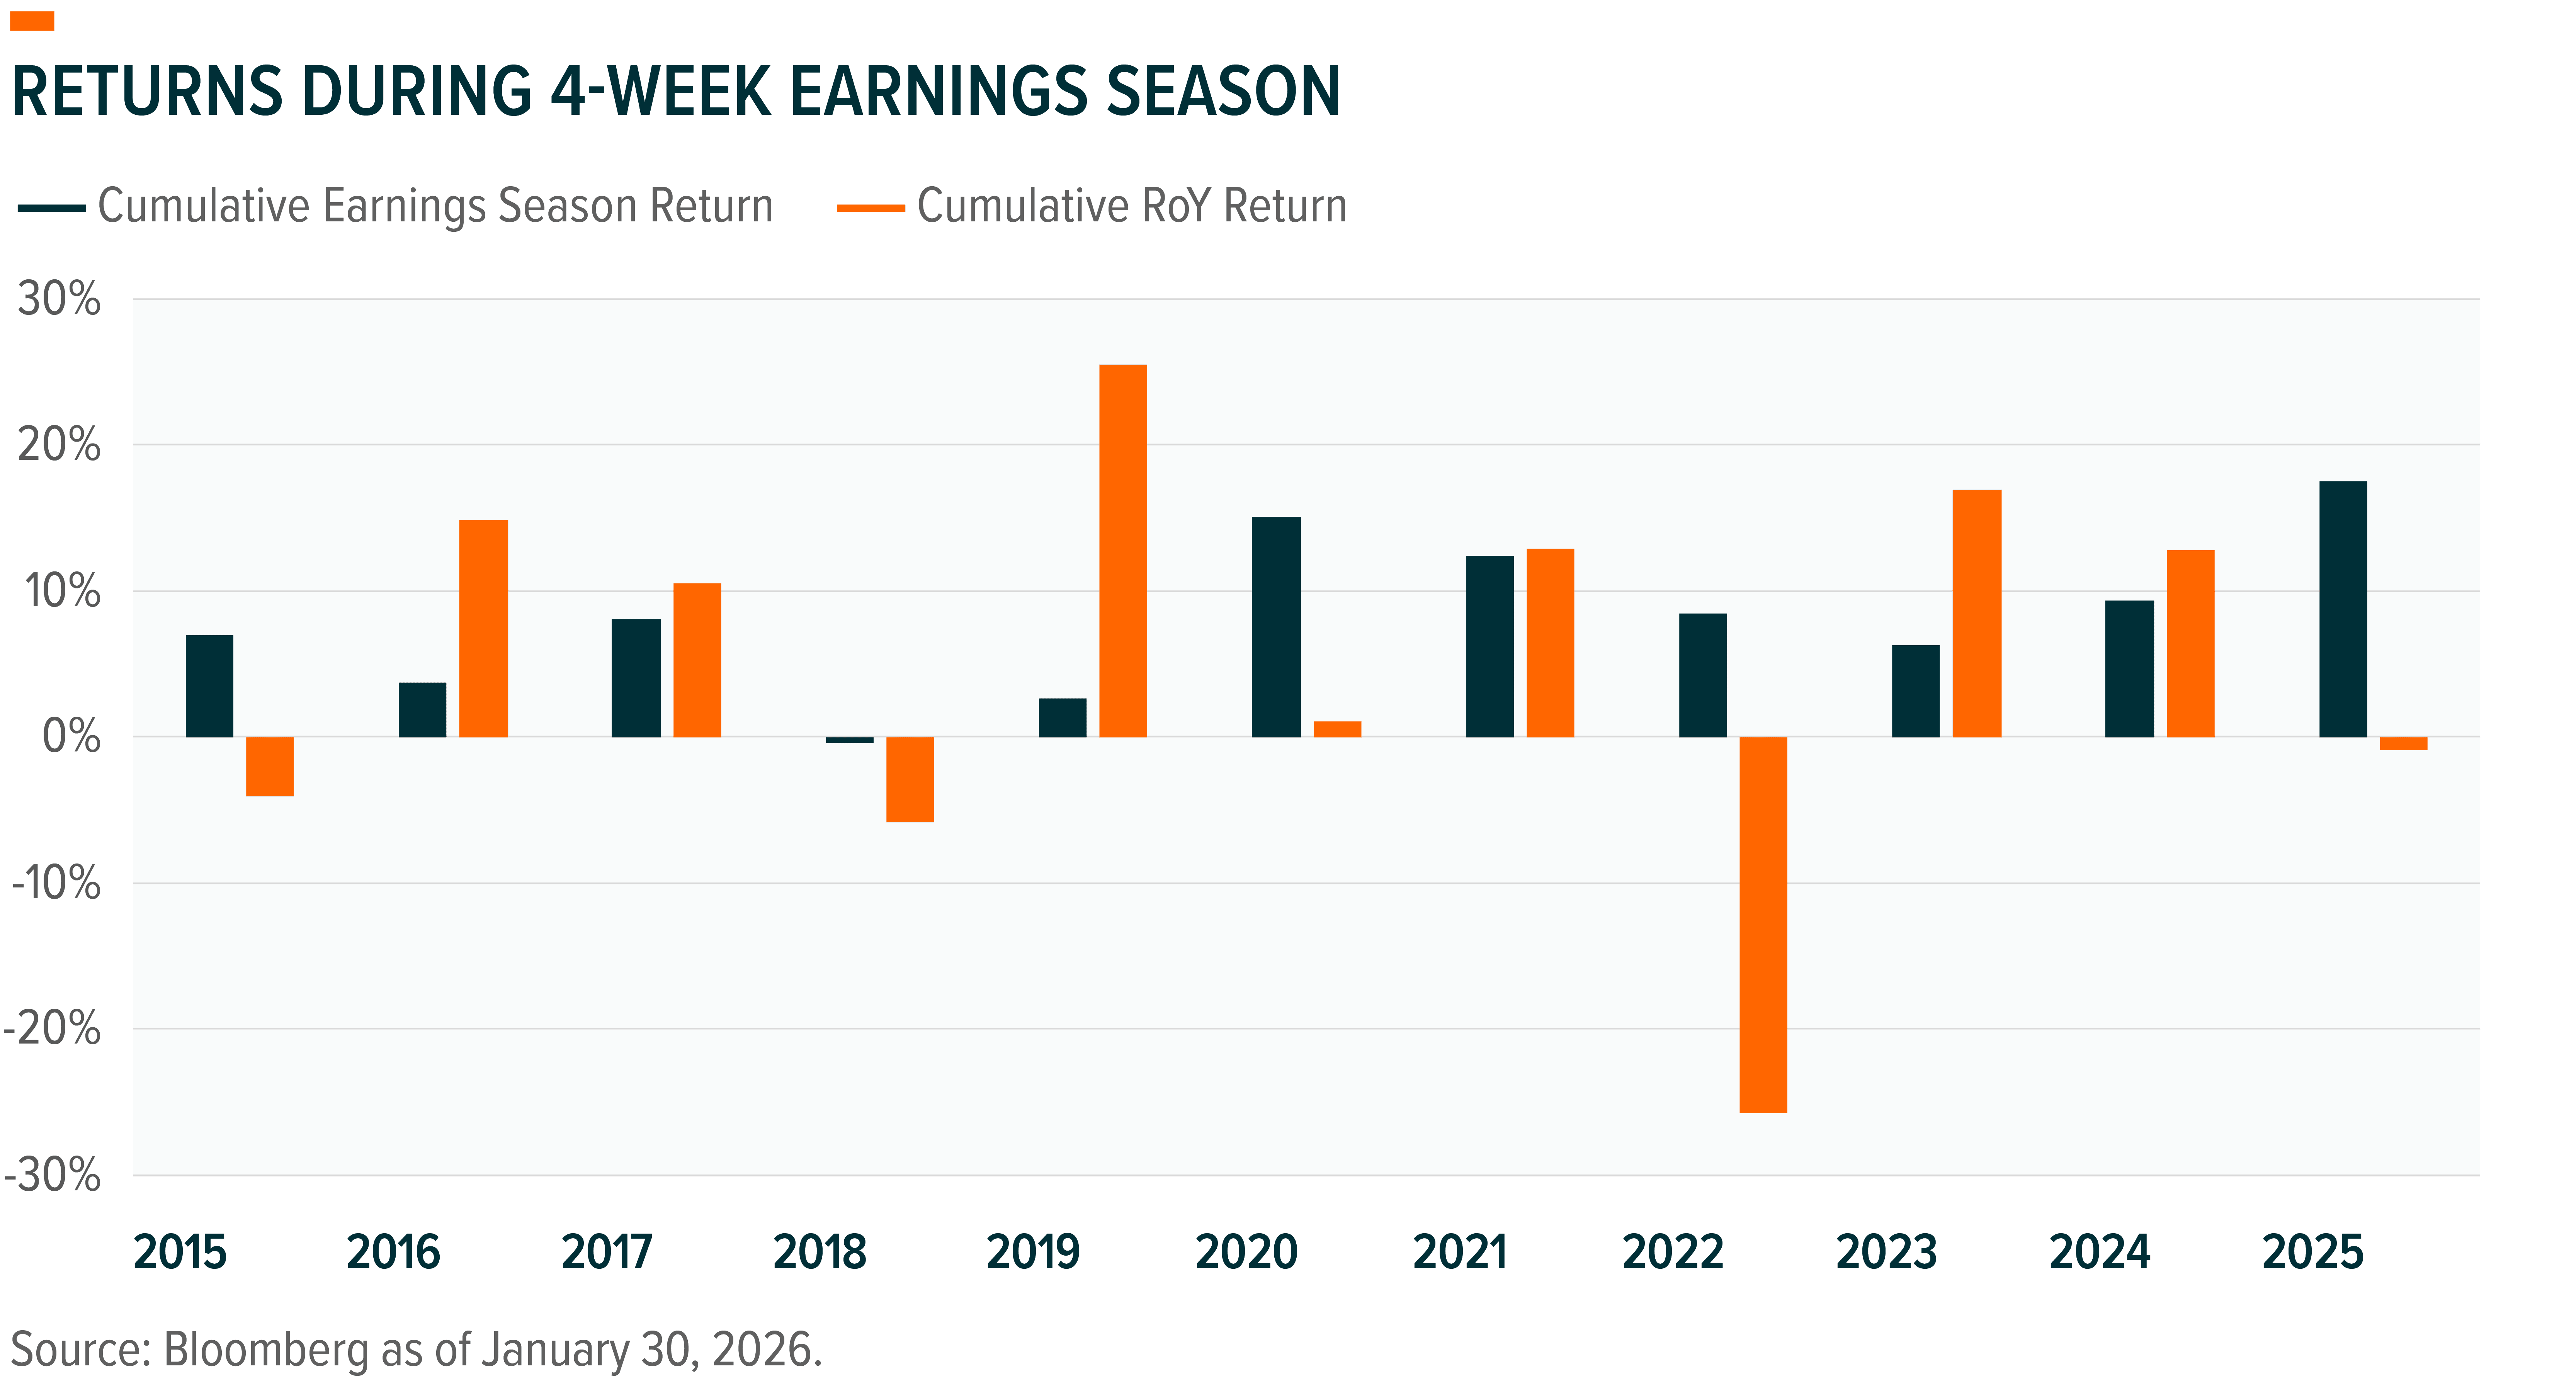
In 2025, all S&P 500 price gains were realized during the 16 weeks of earnings season, while returns for the remaining 36 weeks were negative.10 Investors responded to positive earnings news, and in between proved patient during a year of elevated monetary, fiscal, and geopolitical policy uncertainty.
The S&P 500 advanced approximately 16% in 2025, driven by 14% earnings growth.11 At year-end 2024, the index traded at 21.5 times 2025 estimated earnings. By year-end 2025, the multiple had expanded by just a half point to 22 times 2026E earnings.12 The gains were driven not by exuberance or valuation expansion, but by strong corporate performance.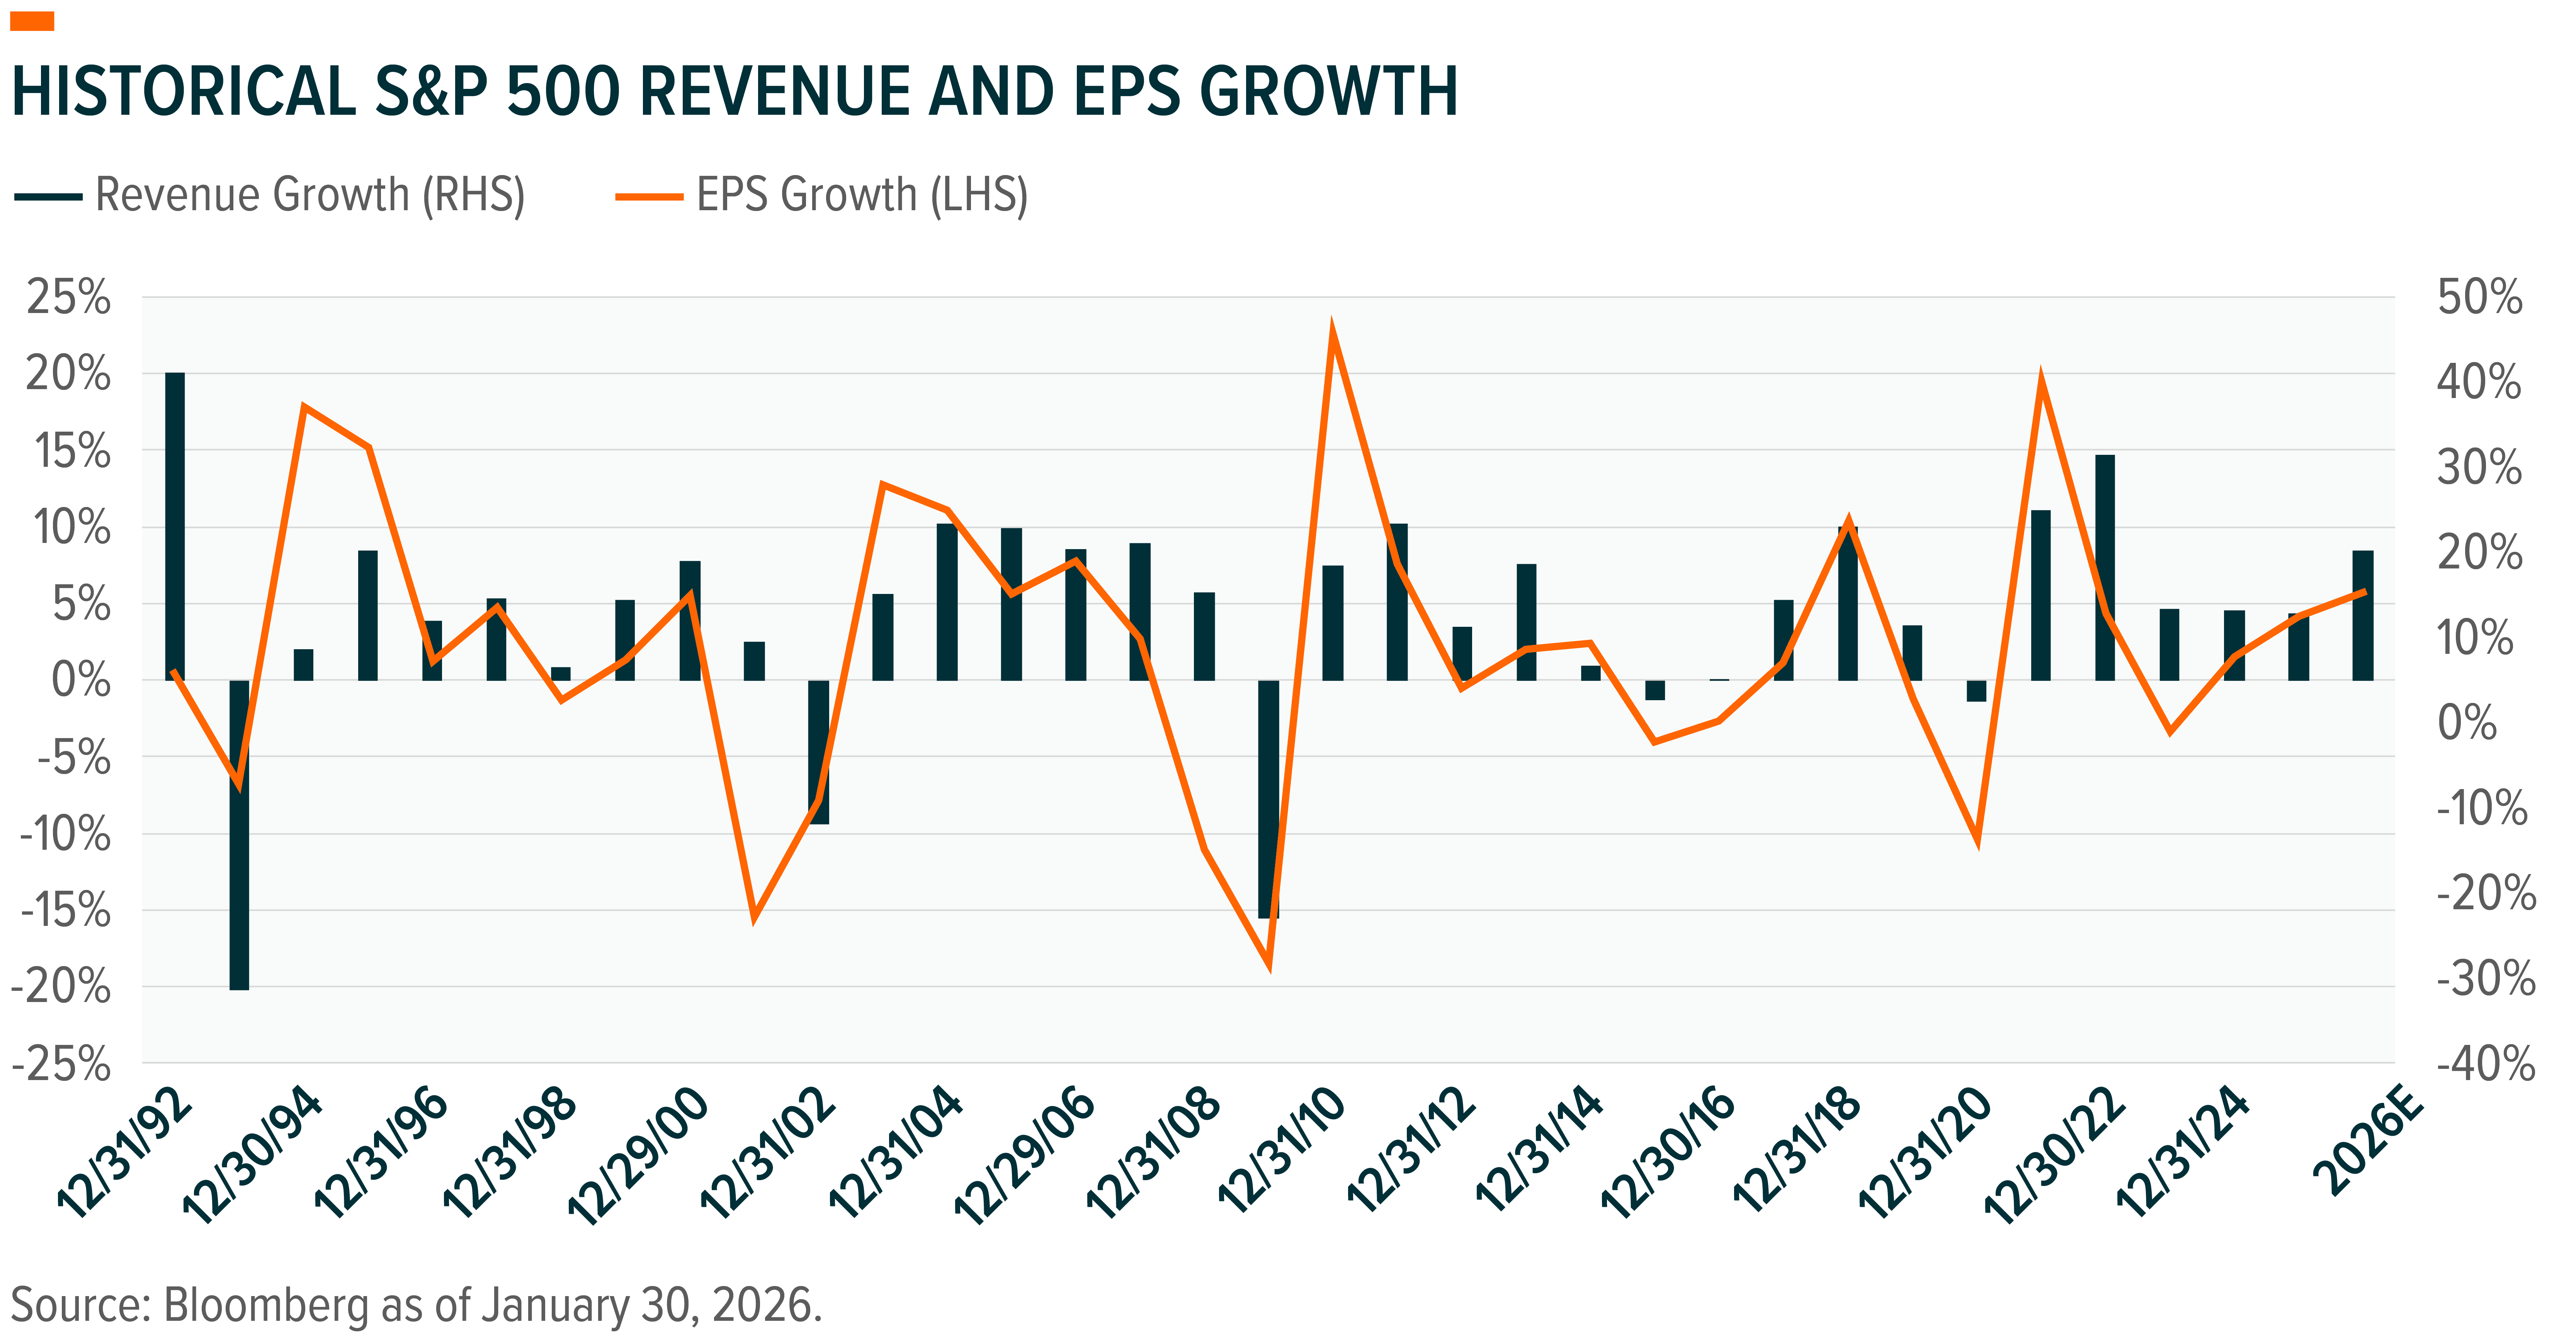
While the Fed lowered rates three times, the cuts did not translate to a lower cost of capital.13 Almost immediately after the Fed started cutting rates 18 months ago, long rates started moving higher, and valuation is sensitive to long rather short rates. During that span, 10-year yields were up 25 basis points, while the 30-year gained 75 basis points.14 The weighted average cost of capital for S&P 500 constituents actually rose from 10.3% to 10.7% in 2025. Equities may have benefited from the expectation of lower rates, but it is hard to argue that equities rose because the cost of capital declined.
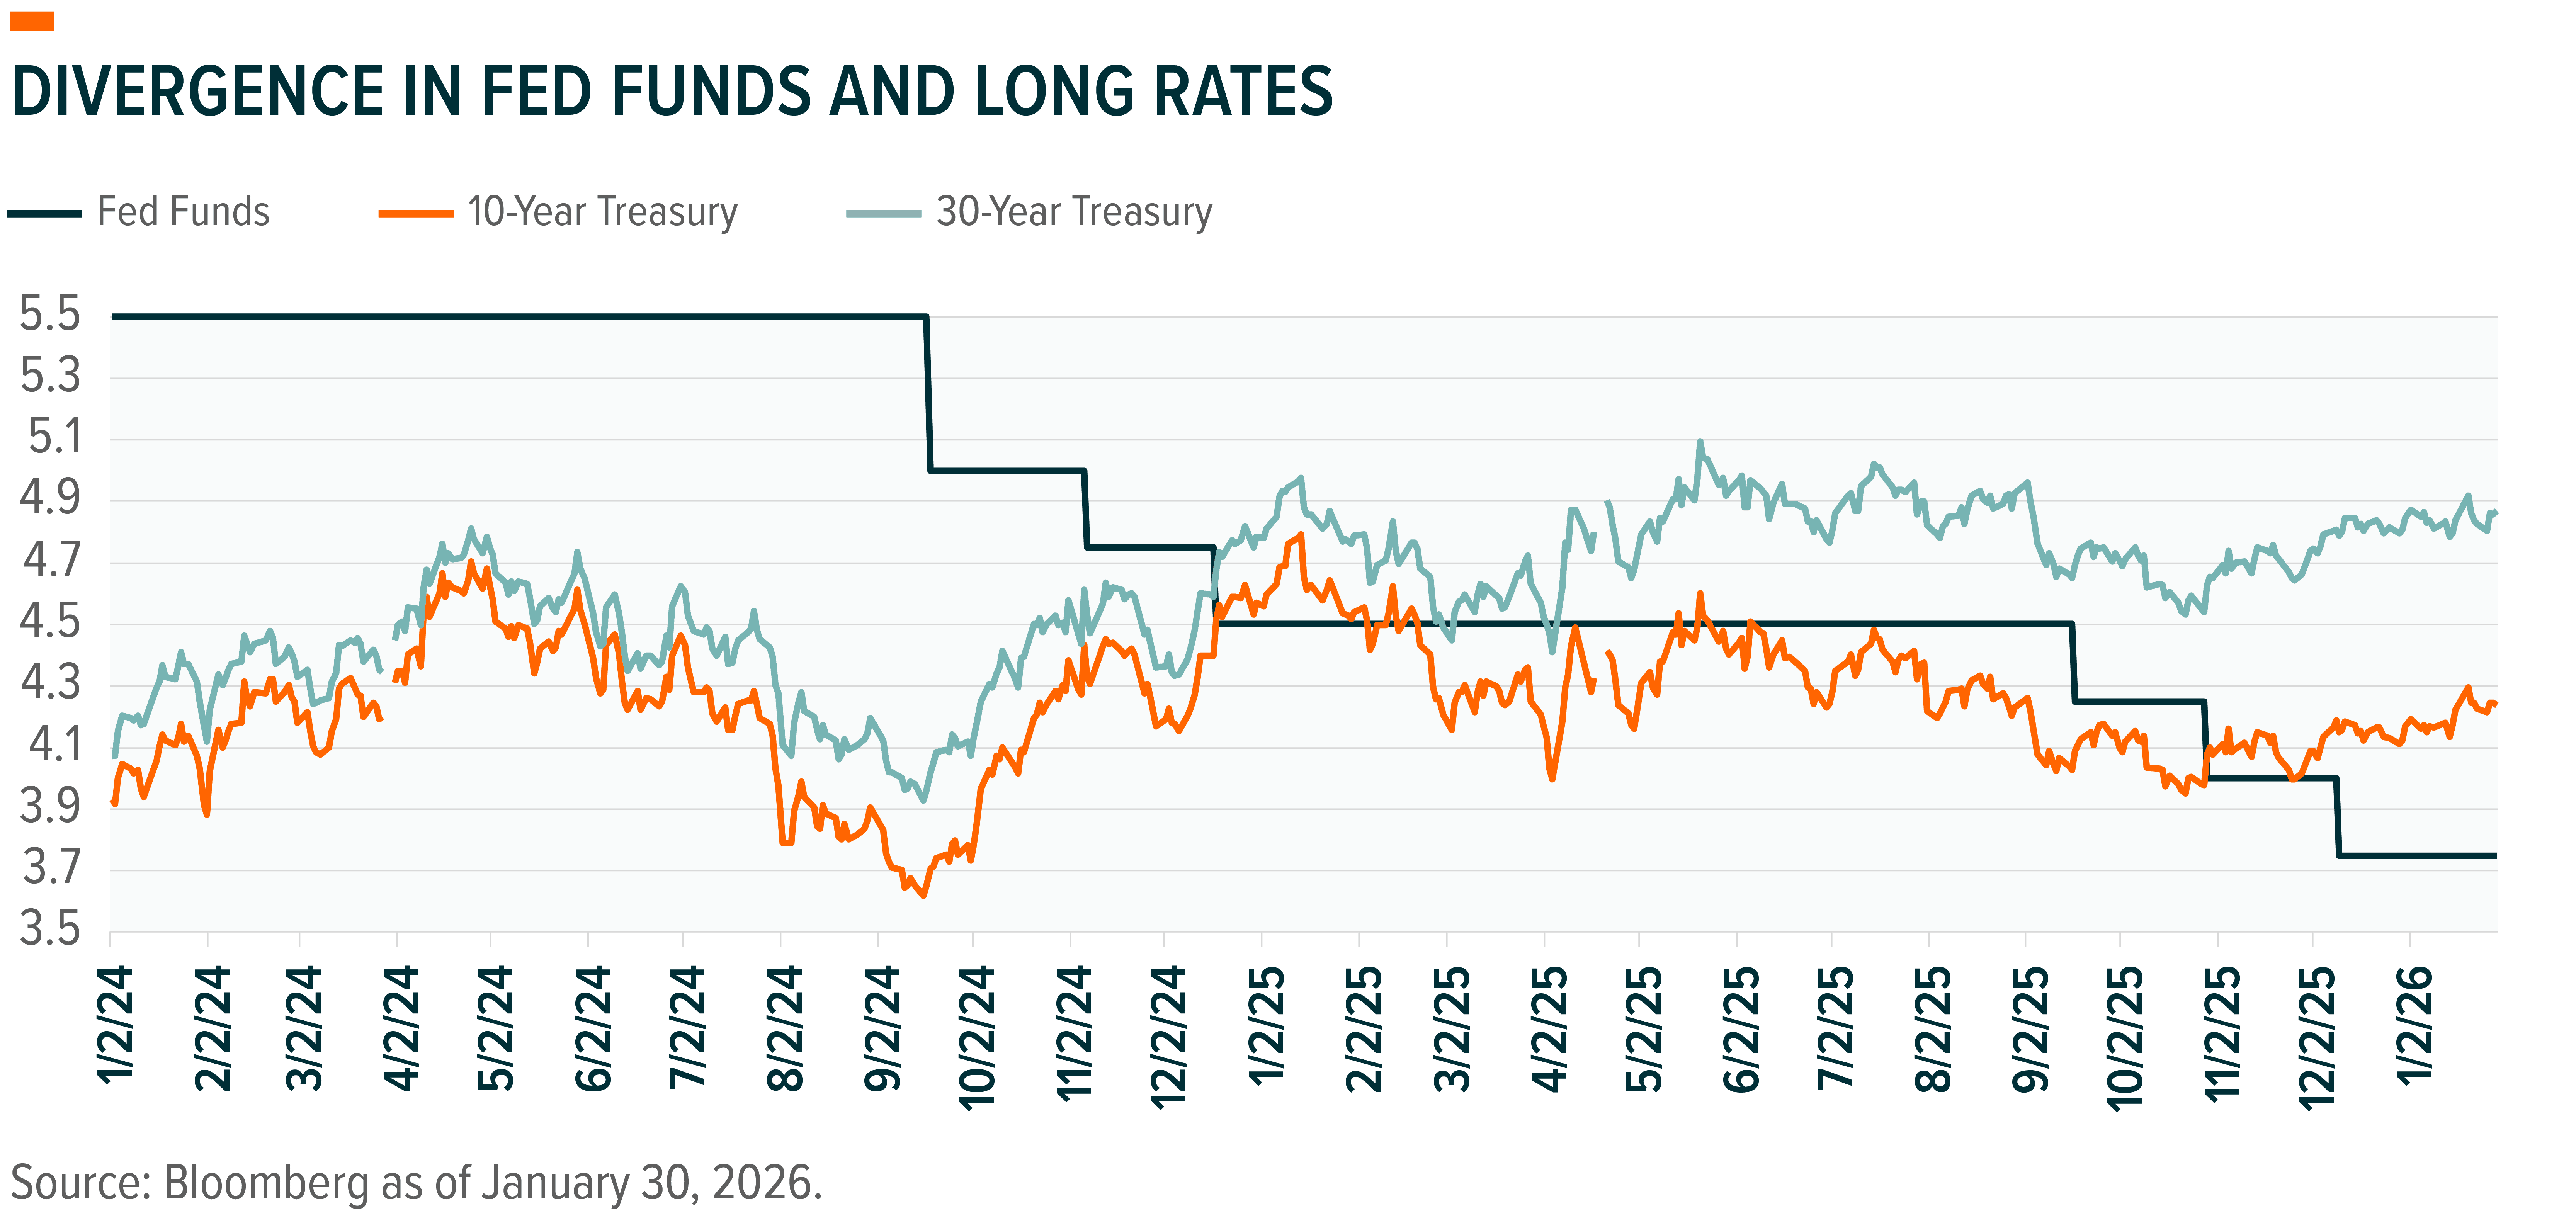
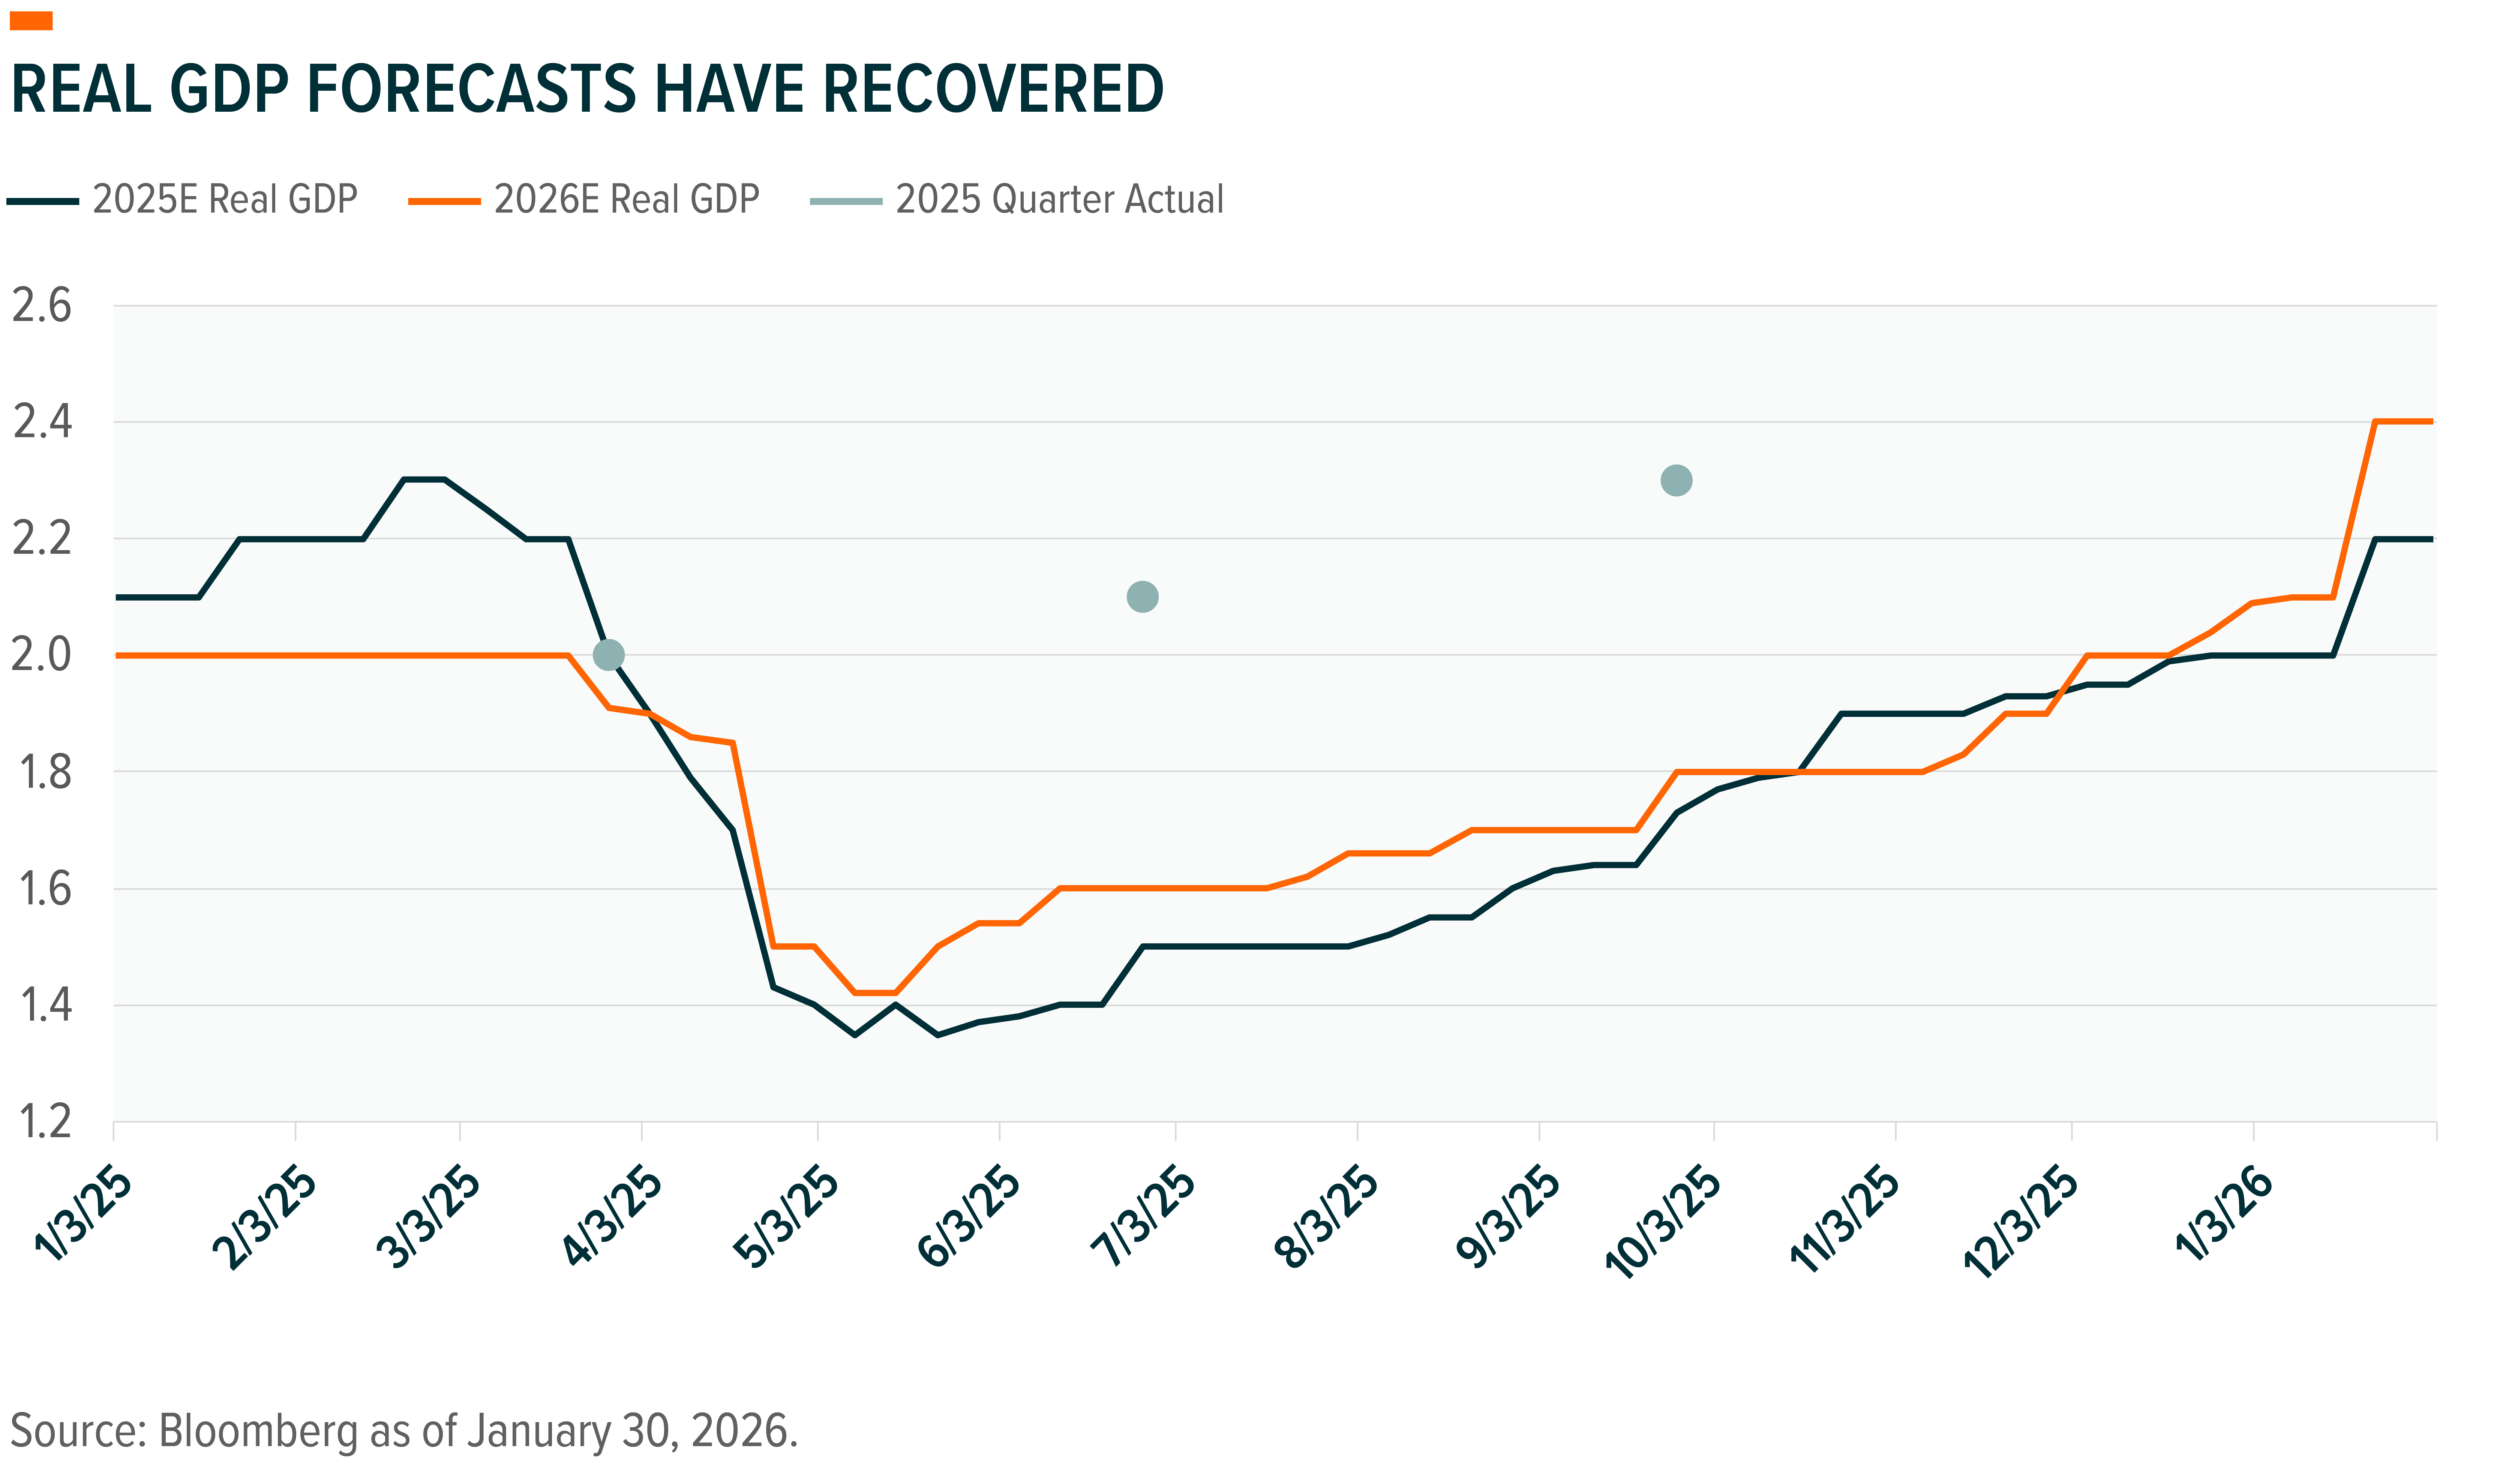
Meanwhile, economic conditions improved. GDP growth forecasts have been off the mark since 2023 with actuals consistently coming in better than expected. In 2025, GDP growth in the second and third quarters were roughly 50 basis points better than forecasted.15 Expectations for 2026 have followed a similar pattern with estimates now moving higher. At the start of 2026, the estimate for real GDP was 2.0%, and has since improved to 2.4%. Nominal GDP growth for the year ahead is now around 5.1%, meaningfully better than the 4.3% forecast at the May 2025 trough.16
Clues in Earnings Guidance
The company performance bar is high at the start of 2026. S&P 500 companies are forecast to grow revenues by 8% and earnings by 15%, with profit margins near record levels. Since 1992, S&P 500 companies have averaged 4% revenue growth and 9% EPS growth, making 2026 expectations an outlier.17 The risk embedded in current market pricing is that companies fail to meet or exceed estimates.
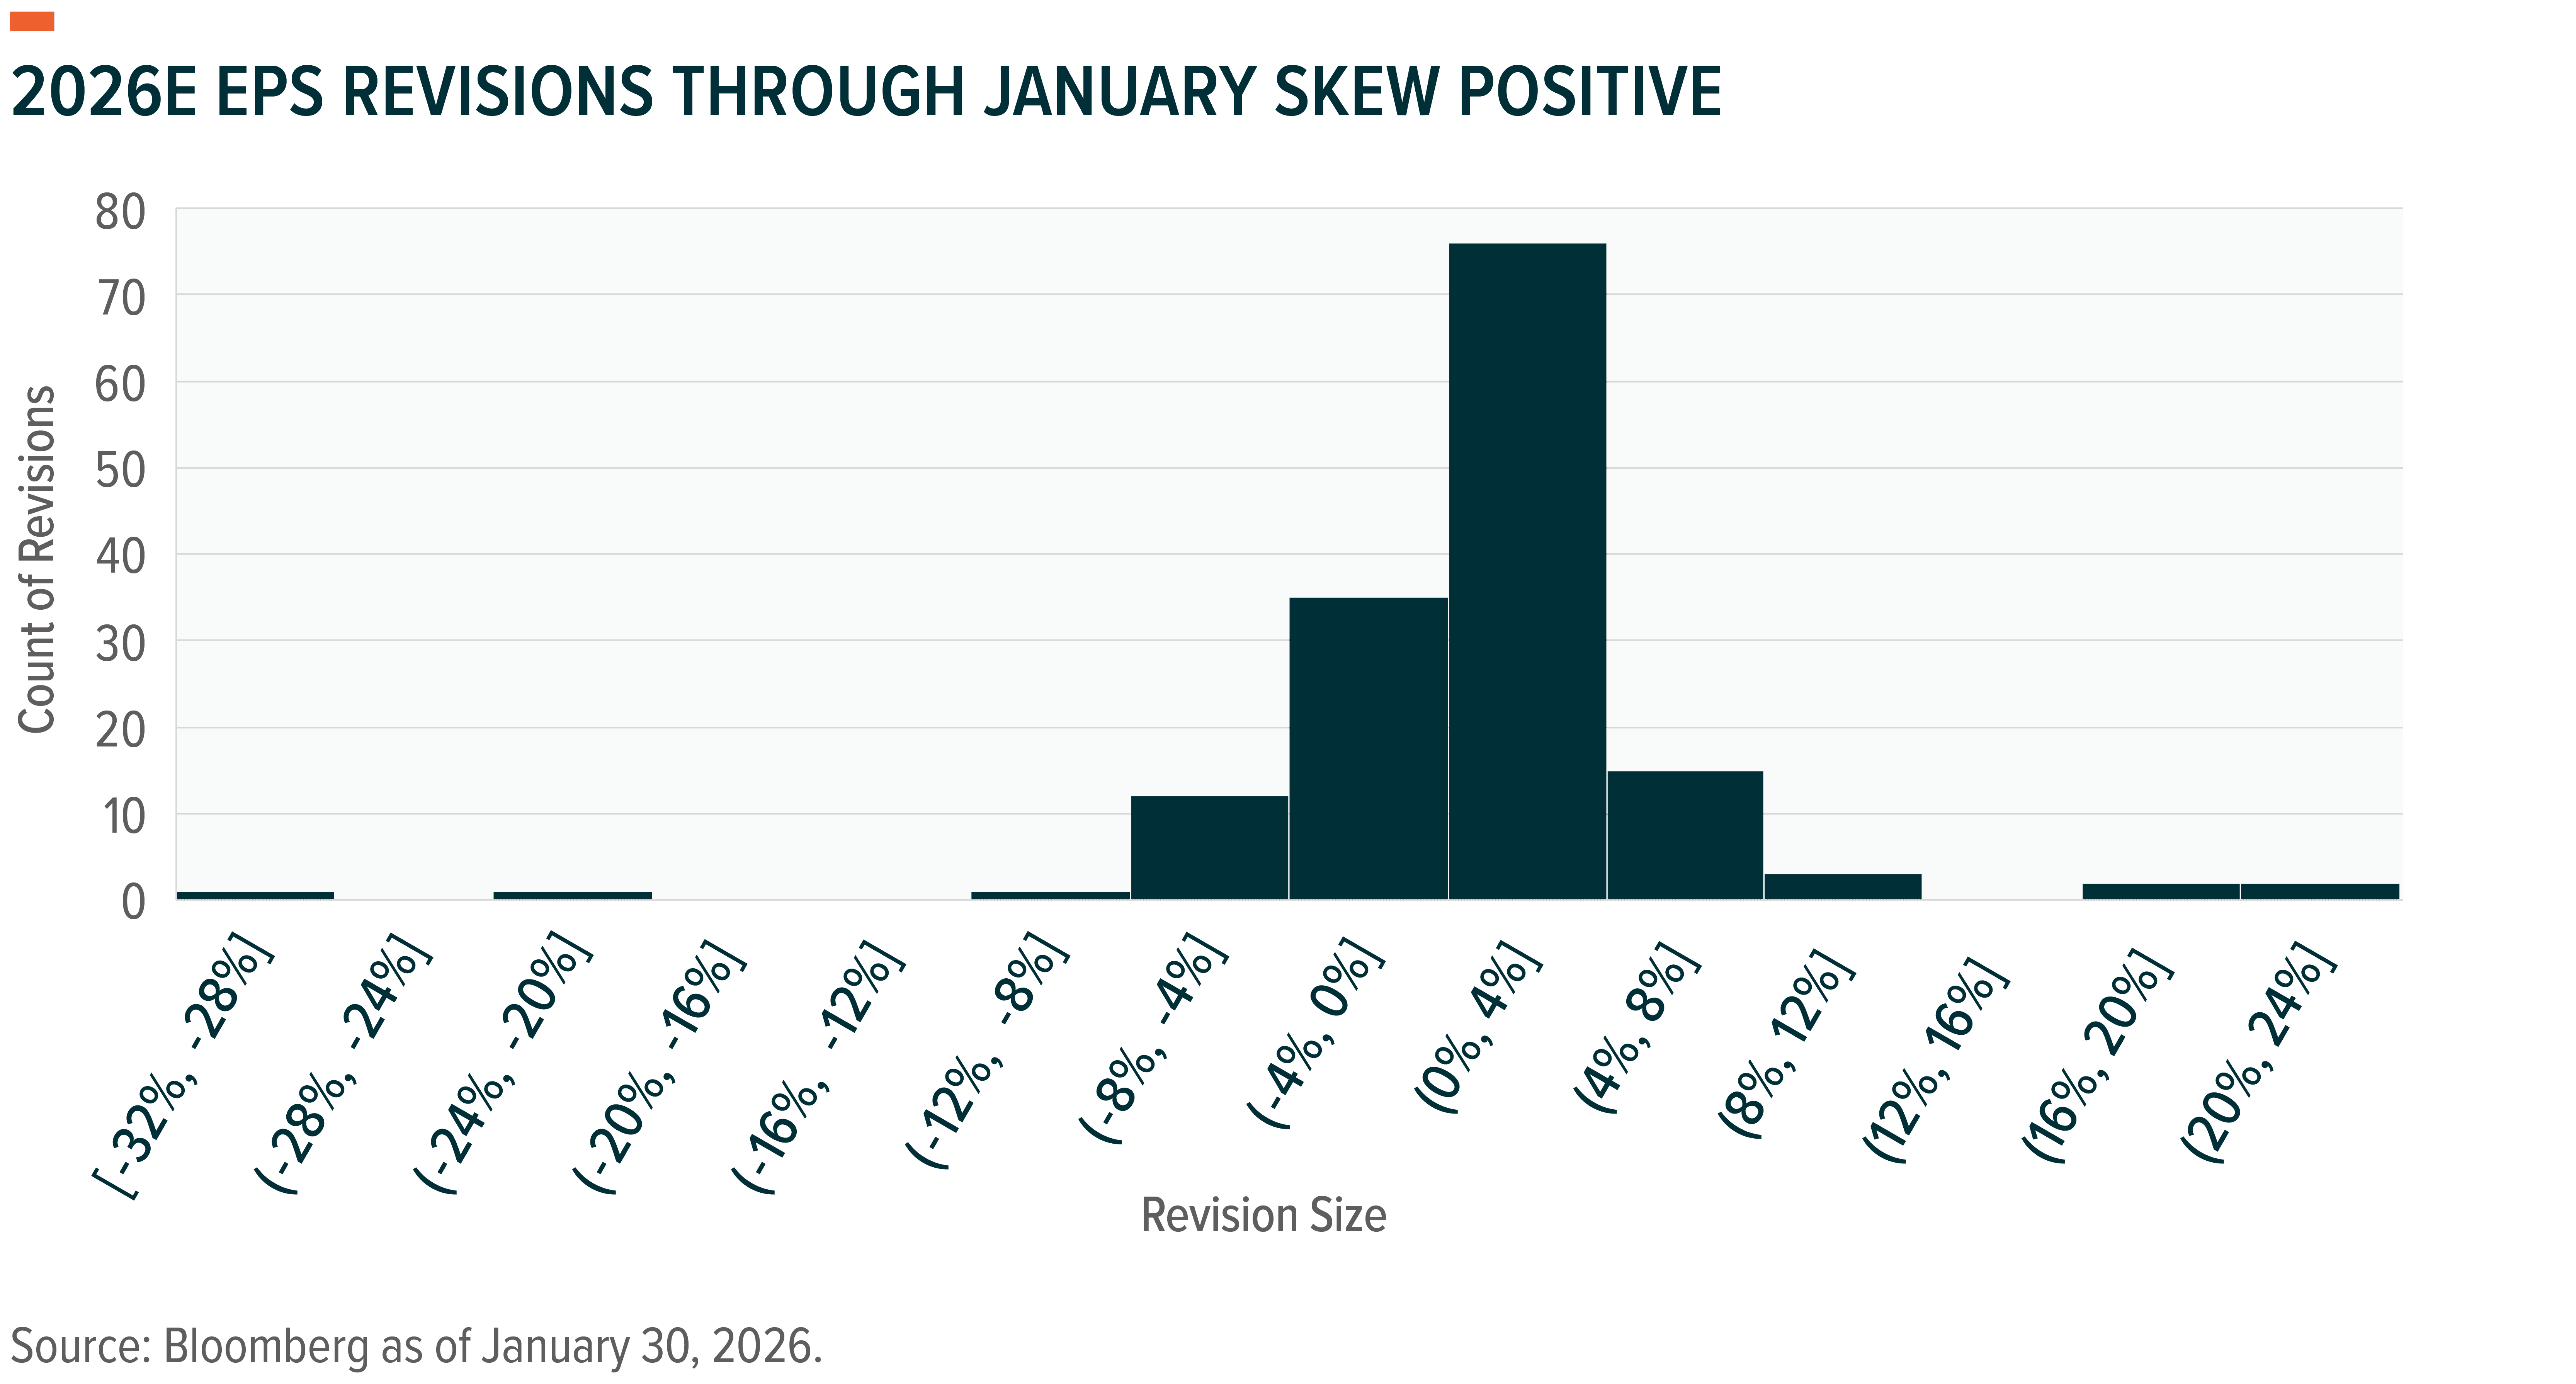
Earnings season gives companies an opportunity to refine guidance based on current data and potential scenarios for the year ahead. Interestingly, one-third of the way through this earnings season, most companies have raised their 2026 guidance. Of the 170 that had reported as of January 30, revenue estimates increased by 1%, EPS rose 0.5%, and 60% raised full-year guidance.18 That represents a solid setup.
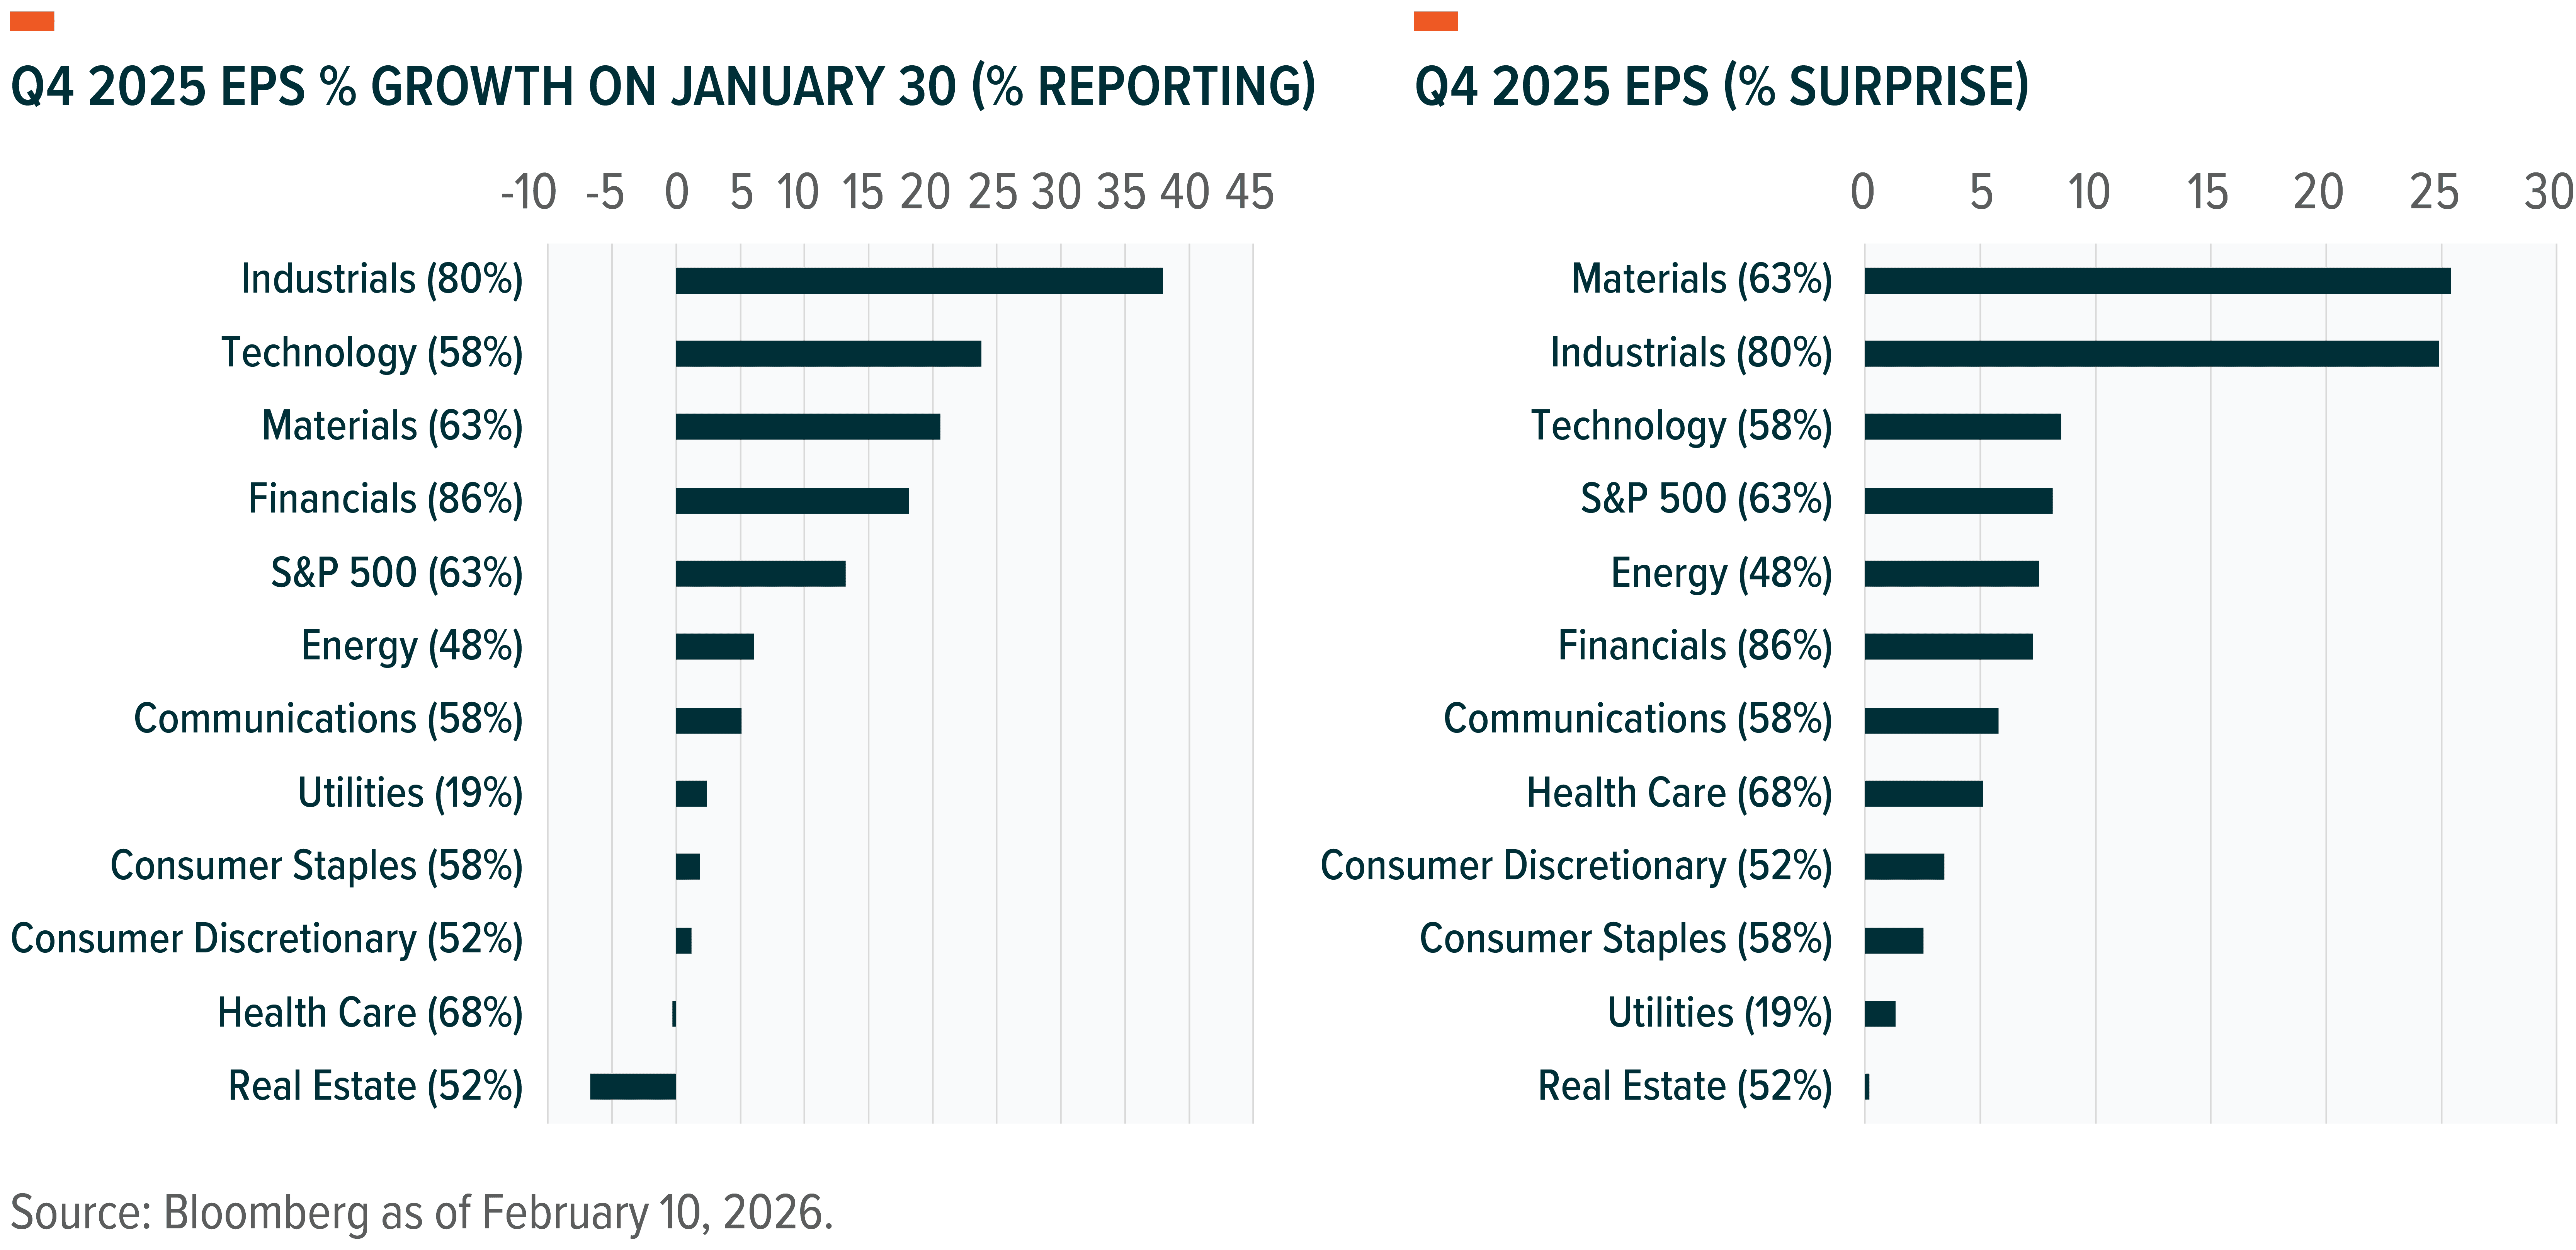
Every S&P 500 sector has delivered positive earnings surprises thus far amid strong growth across most sectors. Tech and communication services profits have been strong, though industrials and material lead the way.19 Financials, utilities, and energy have also delivered respectable year-over-year earnings performance. Importantly, growth and revisions aren’t limited to the Magnificent 7; a broader set of companies and industries are performing well. While staples, materials, healthcare, and discretionary have not, in aggregate, delivered positive profit growth thus far, all have posted upside surprises relative to prior forecasts and solid revenue growth.20
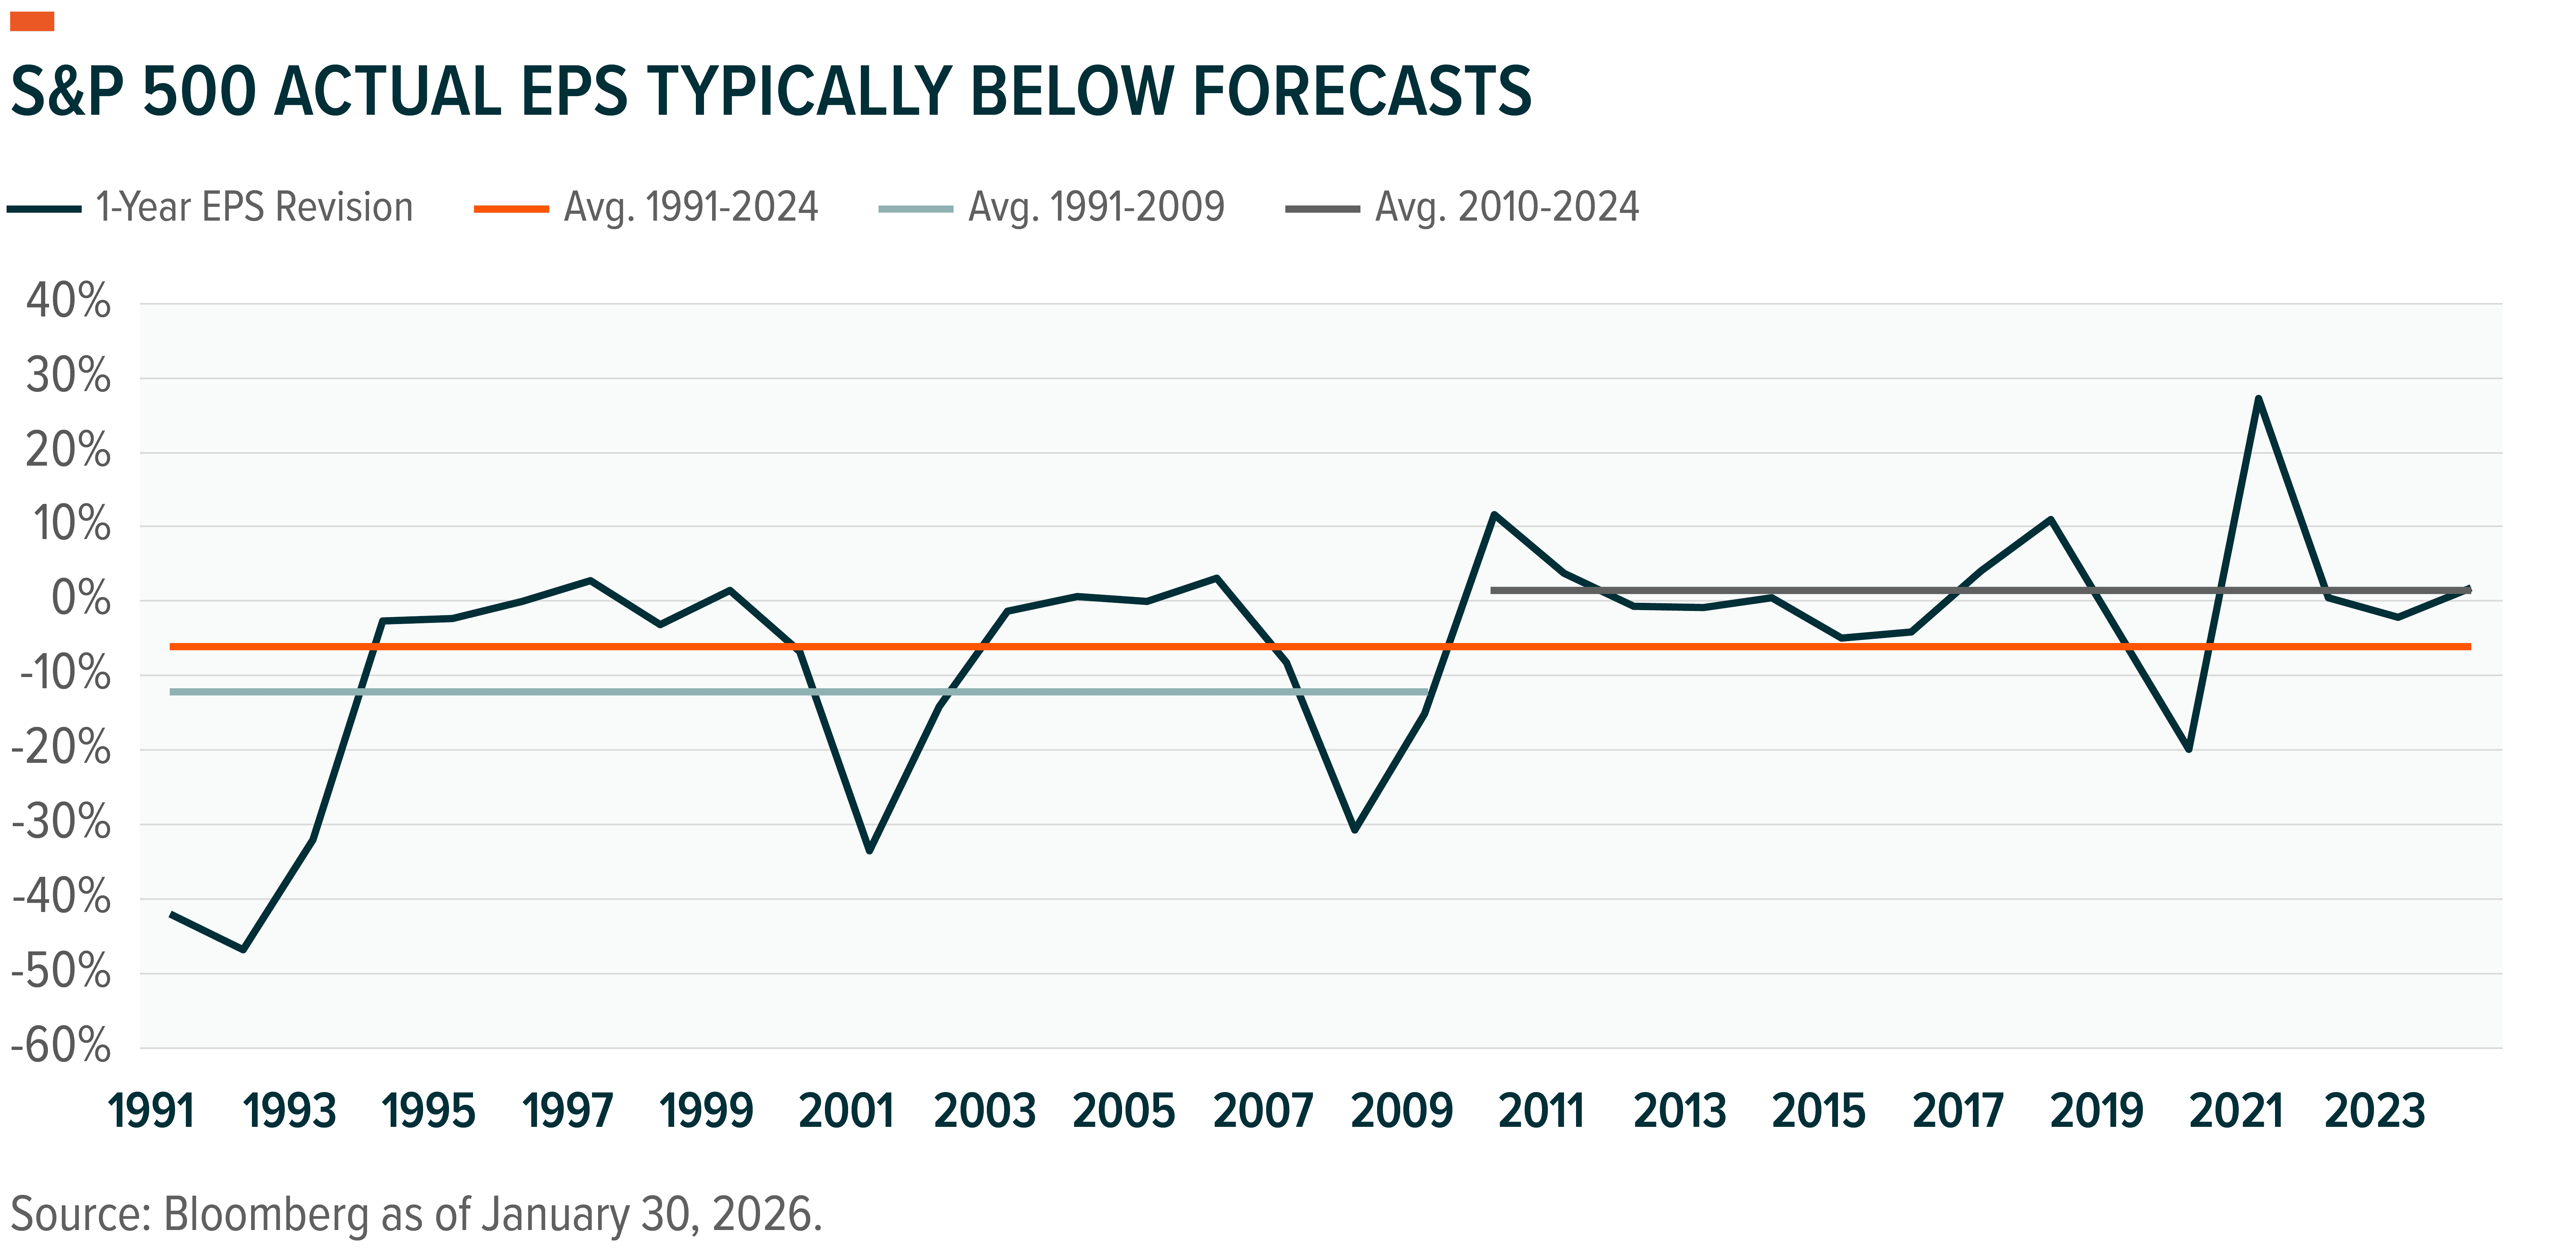
Bullish revisions to guidance are something of a historical anomaly. Since 1991, actual corporate earnings have typically come in 6% lower than the forecast to start the year, as investors begin with rosy expectations that are later revised to reflect economic reality.21 There is, however, a notable break in the data. Prior to 2015, the average deviation between forecast and actual S&P 500 earnings was 9% lower. Over the past decade, this relationship has changed, with actual earnings averaging 2% above expectations set 12 months earlier.22 The current revisions are therefore in line with more recent experience and suggest that actual earnings could still surprise to the upside.
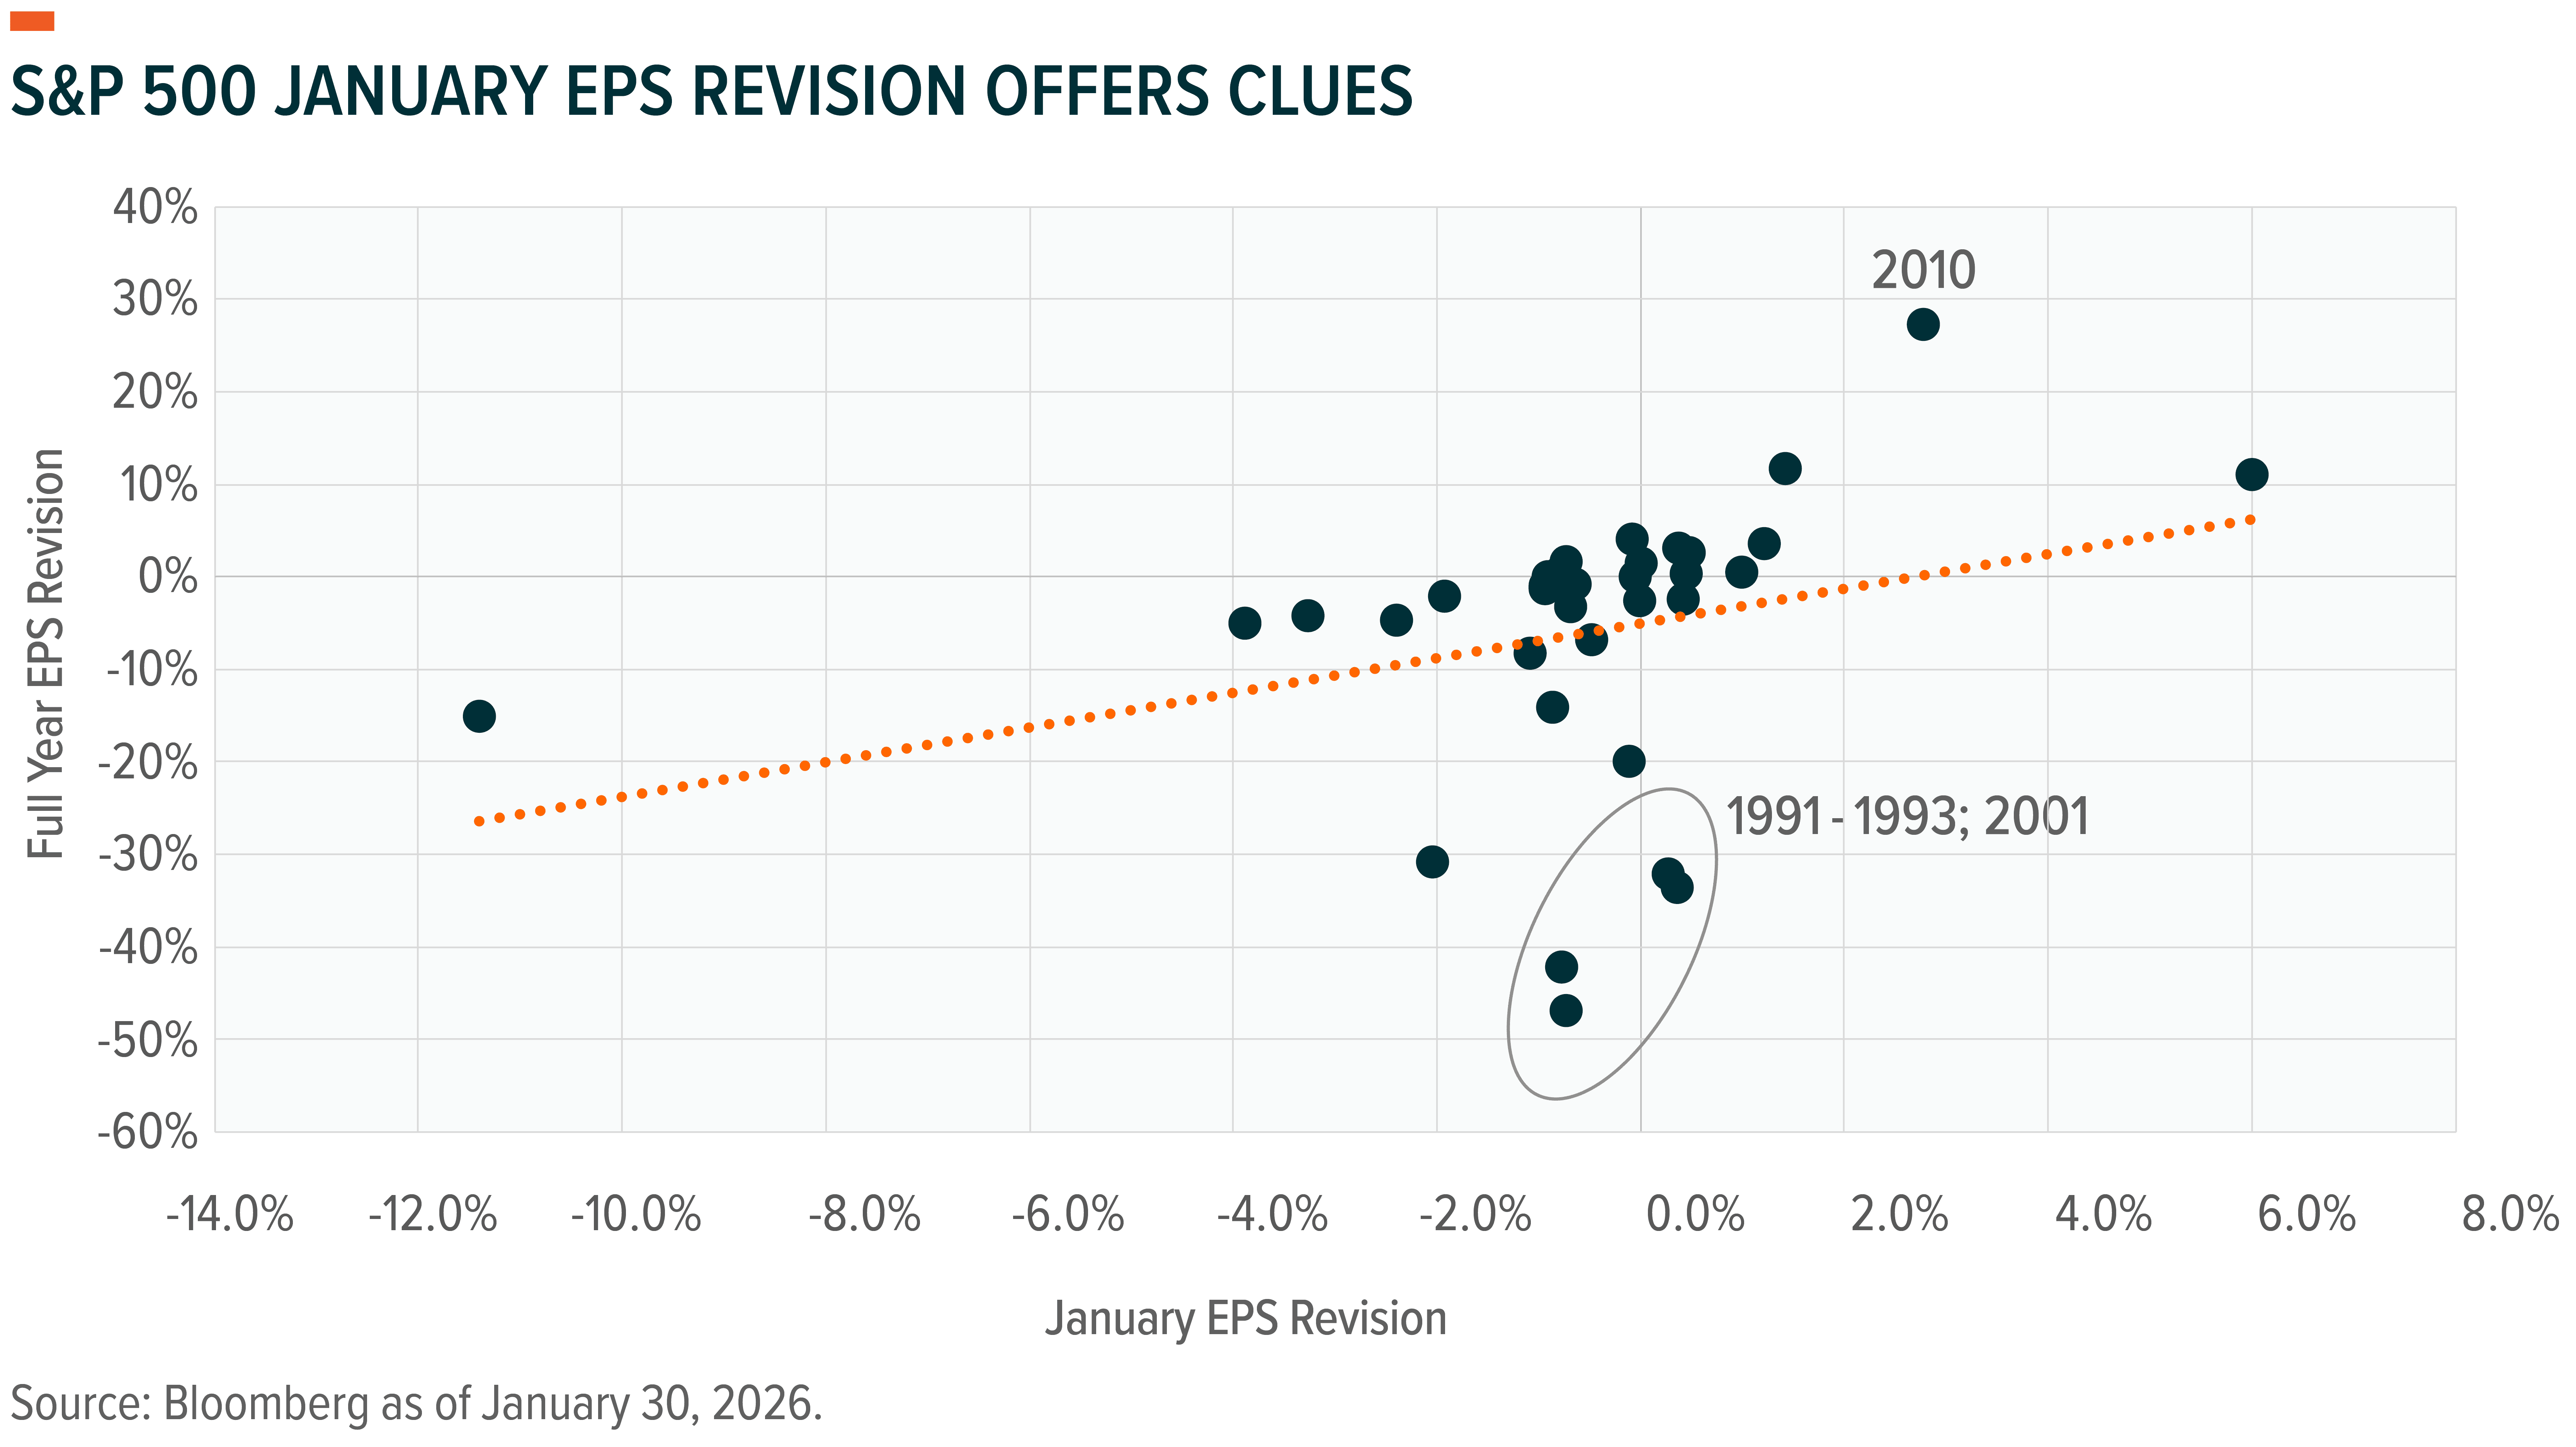
Early January revisions are a positive sign for the year ahead. Historically, in years when S&P 500 earnings estimates are raised in January, full-year estimates also tend to move higher. Excluding the recessionary periods of 1991–1993 and 2001, as well as the post-pandemic economic snapback in 2020, there is a strong statistical correlation between January revisions and full-year performance.23 A 1% increase to January forecasts has historically translated into full-year earnings coming in about 2% above expectations, suggesting there may still be room for upside surprises despite already lofty expectations for 2026.
Market Rotation and Signs of Economic Broadening
The question we get a lot: when will the market broaden out? Mega-cap dominance, led by tech and communication services, has concentrated cap weights; however, a real economic broadening may be driving some of the market moves in early 2026.
While the primary equity indexes started 2026 higher, a rotation began in late January and carried into February.24 Former market darlings in software and data services fell, while commodities and energy outperformed. The contrast has been stark: the top-performing Bloomberg industry, commodity chemicals, is outperforming the weakest, application software, by 60% year to date as of February 4.25
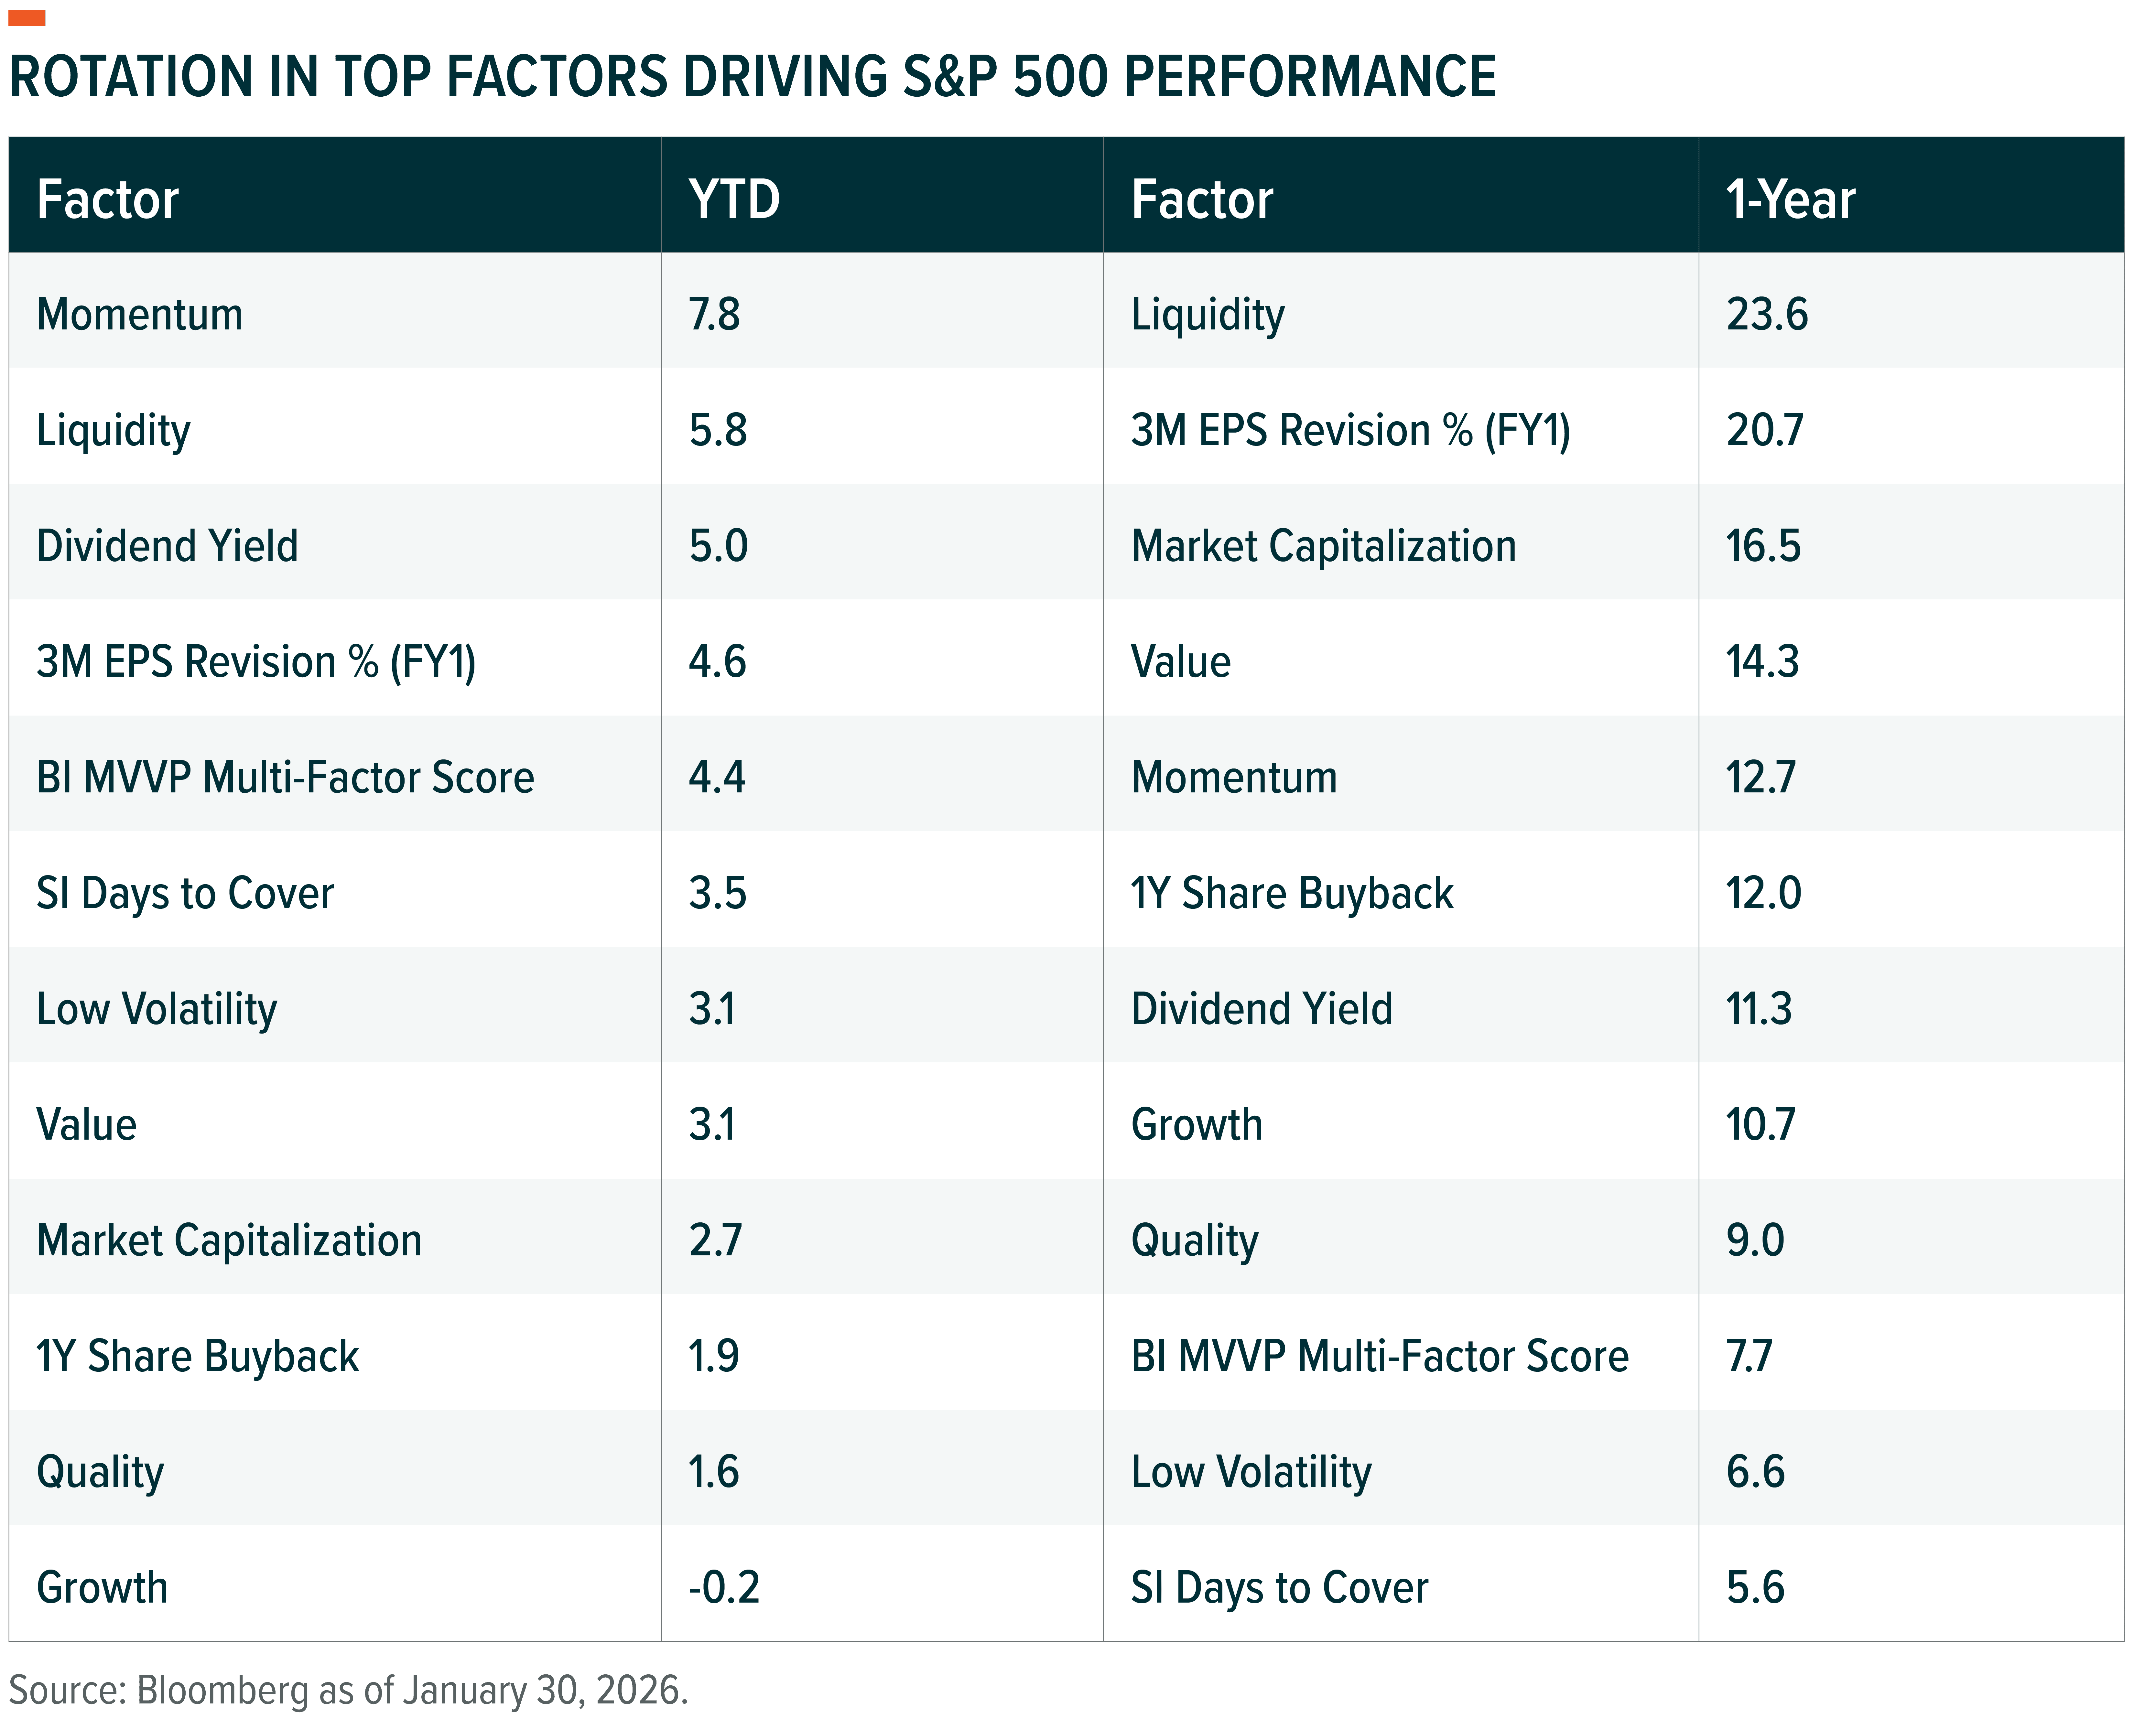
S&P 500 factor performance tells a similar story. Liquidity, fundamentals, and size led the market higher in 2025, while the leading factors in January 2026 were momentum, liquidity, and dividend yield.26 Growth, quality, and size lagged. This rotation could be a knee-jerk reaction or a sign that other parts of the economy may be well positioned to improve productivity, leading to broader participation.
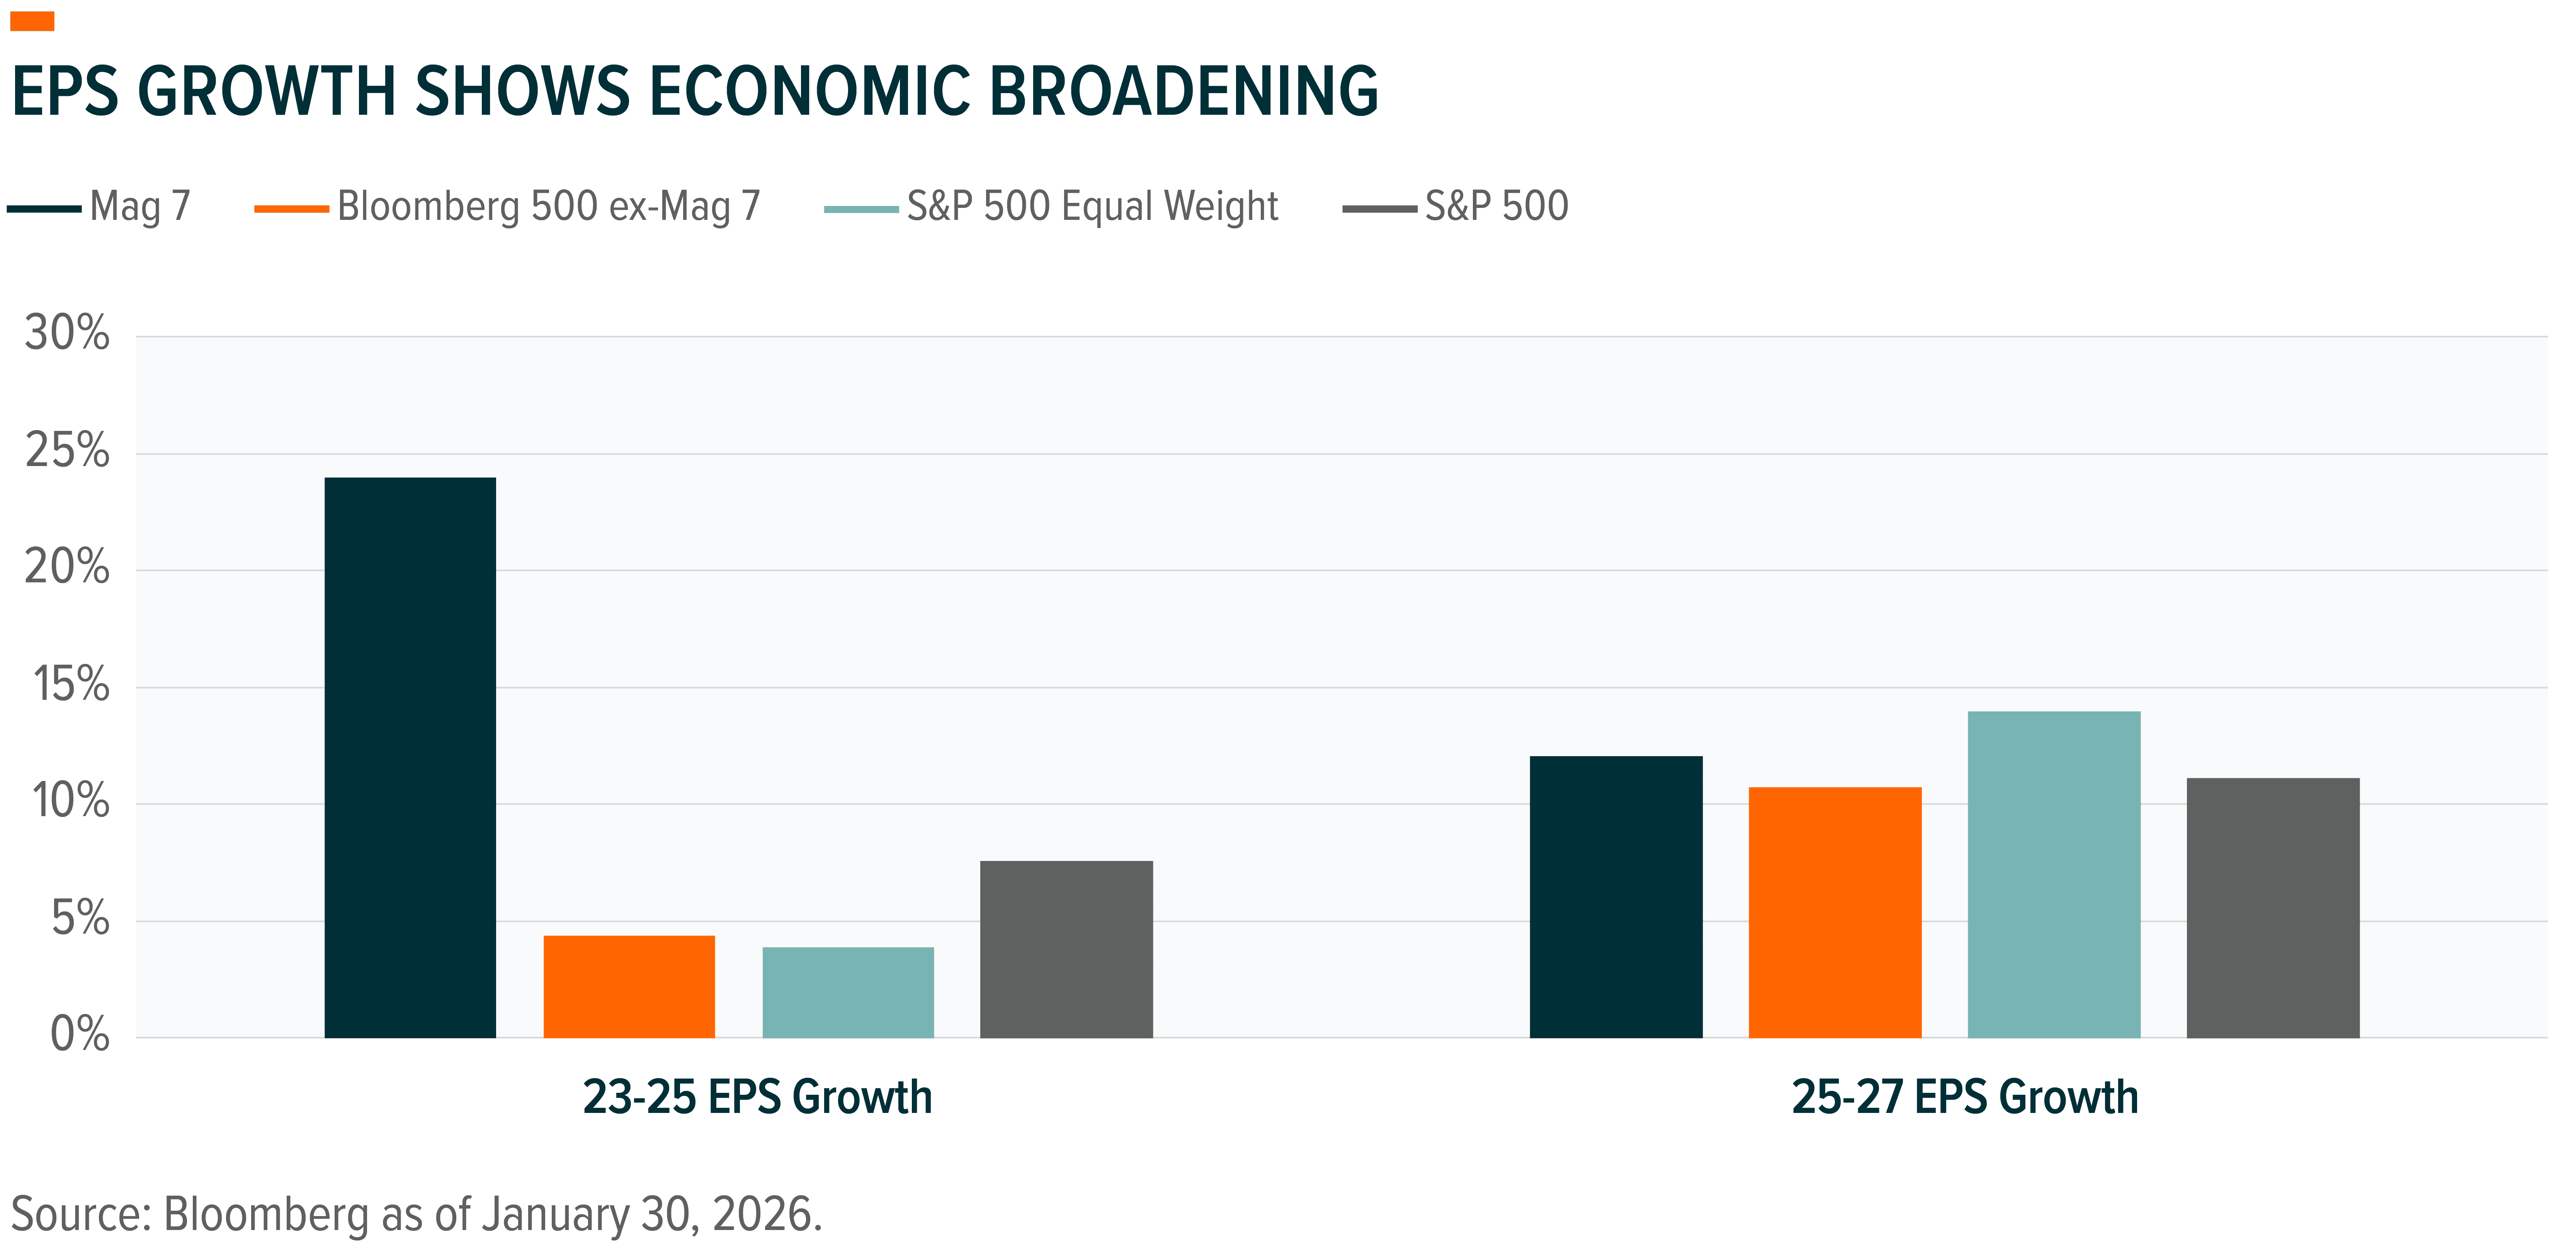
Evidence of broader economic participation is already working into expectations. From 2023 to 2025, the Mag 7 delivered nearly 25% annualized earnings growth, compared with less than 5% for the other 493 companies.27 That gap is forecast to narrow significantly over the next two years, with Mag 7 EPS growth slowing to 13% and the rest of the index accelerating to 11%.
While we have long expected productivity gains to emerge beyond big tech, fundamentals are still likely to win out, and the fundamentals for tech and growth equities remain strong. For example, the S&P 500 Software & Services Index is priced at 23.4 times 2026E earnings, supported by revenue and EPS growth of 19% and profit margins of 30%.28 That valuation still looks attractive relative to S&P 500 revenue growth of 8% and profit margins of 15% at 22 times 2026E earnings.
Rather than tossing the baby out with the bathwater, fundamentals can help navigate a prolonged shift in economic participation. Companies tied to the AI ecosystem are still likely to generate strong cash flow, but the onset of the Automation Age also likely creates opportunities in electrification, commodities, and industrials like infrastructure and defense.
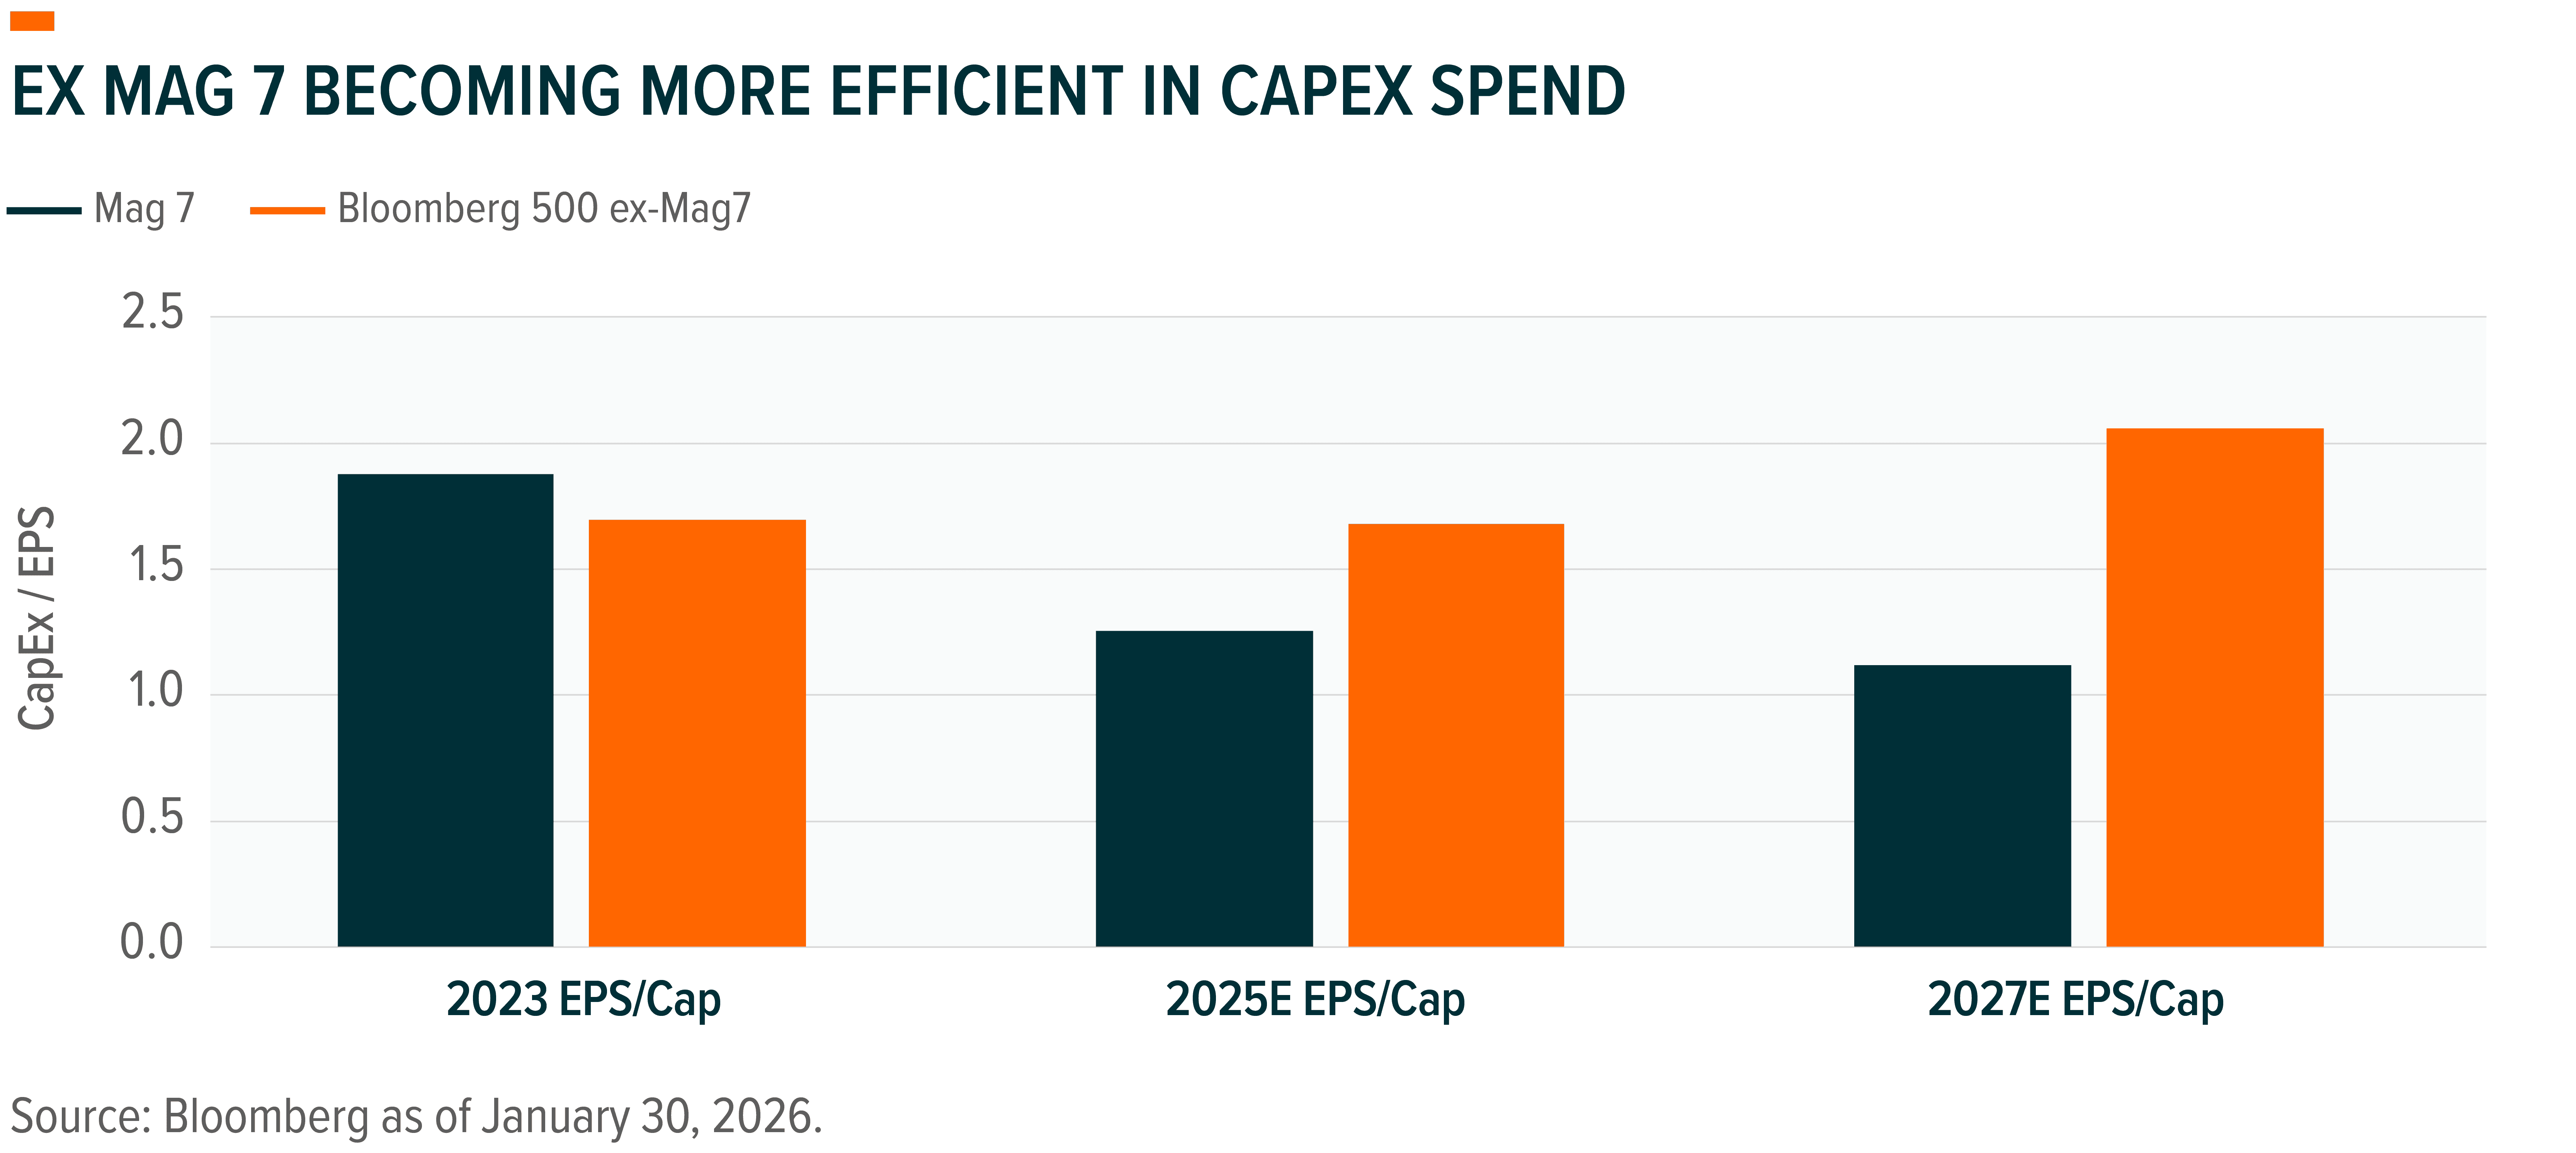
At this stage of the AI buildout, efficiency is an operative word. The major AI players making big investments face a prove-it moment when monetization becomes critical, though much of this pressure is embedded in expectations. Over the next two years, earnings per dollar of capital expenditure for the Mag 7 is expected to decline but rise for the other 493 companies.29 By 2027, these companies are forecast to be roughly twice as efficient as the Mag 7 at converting corporate investment into earnings.
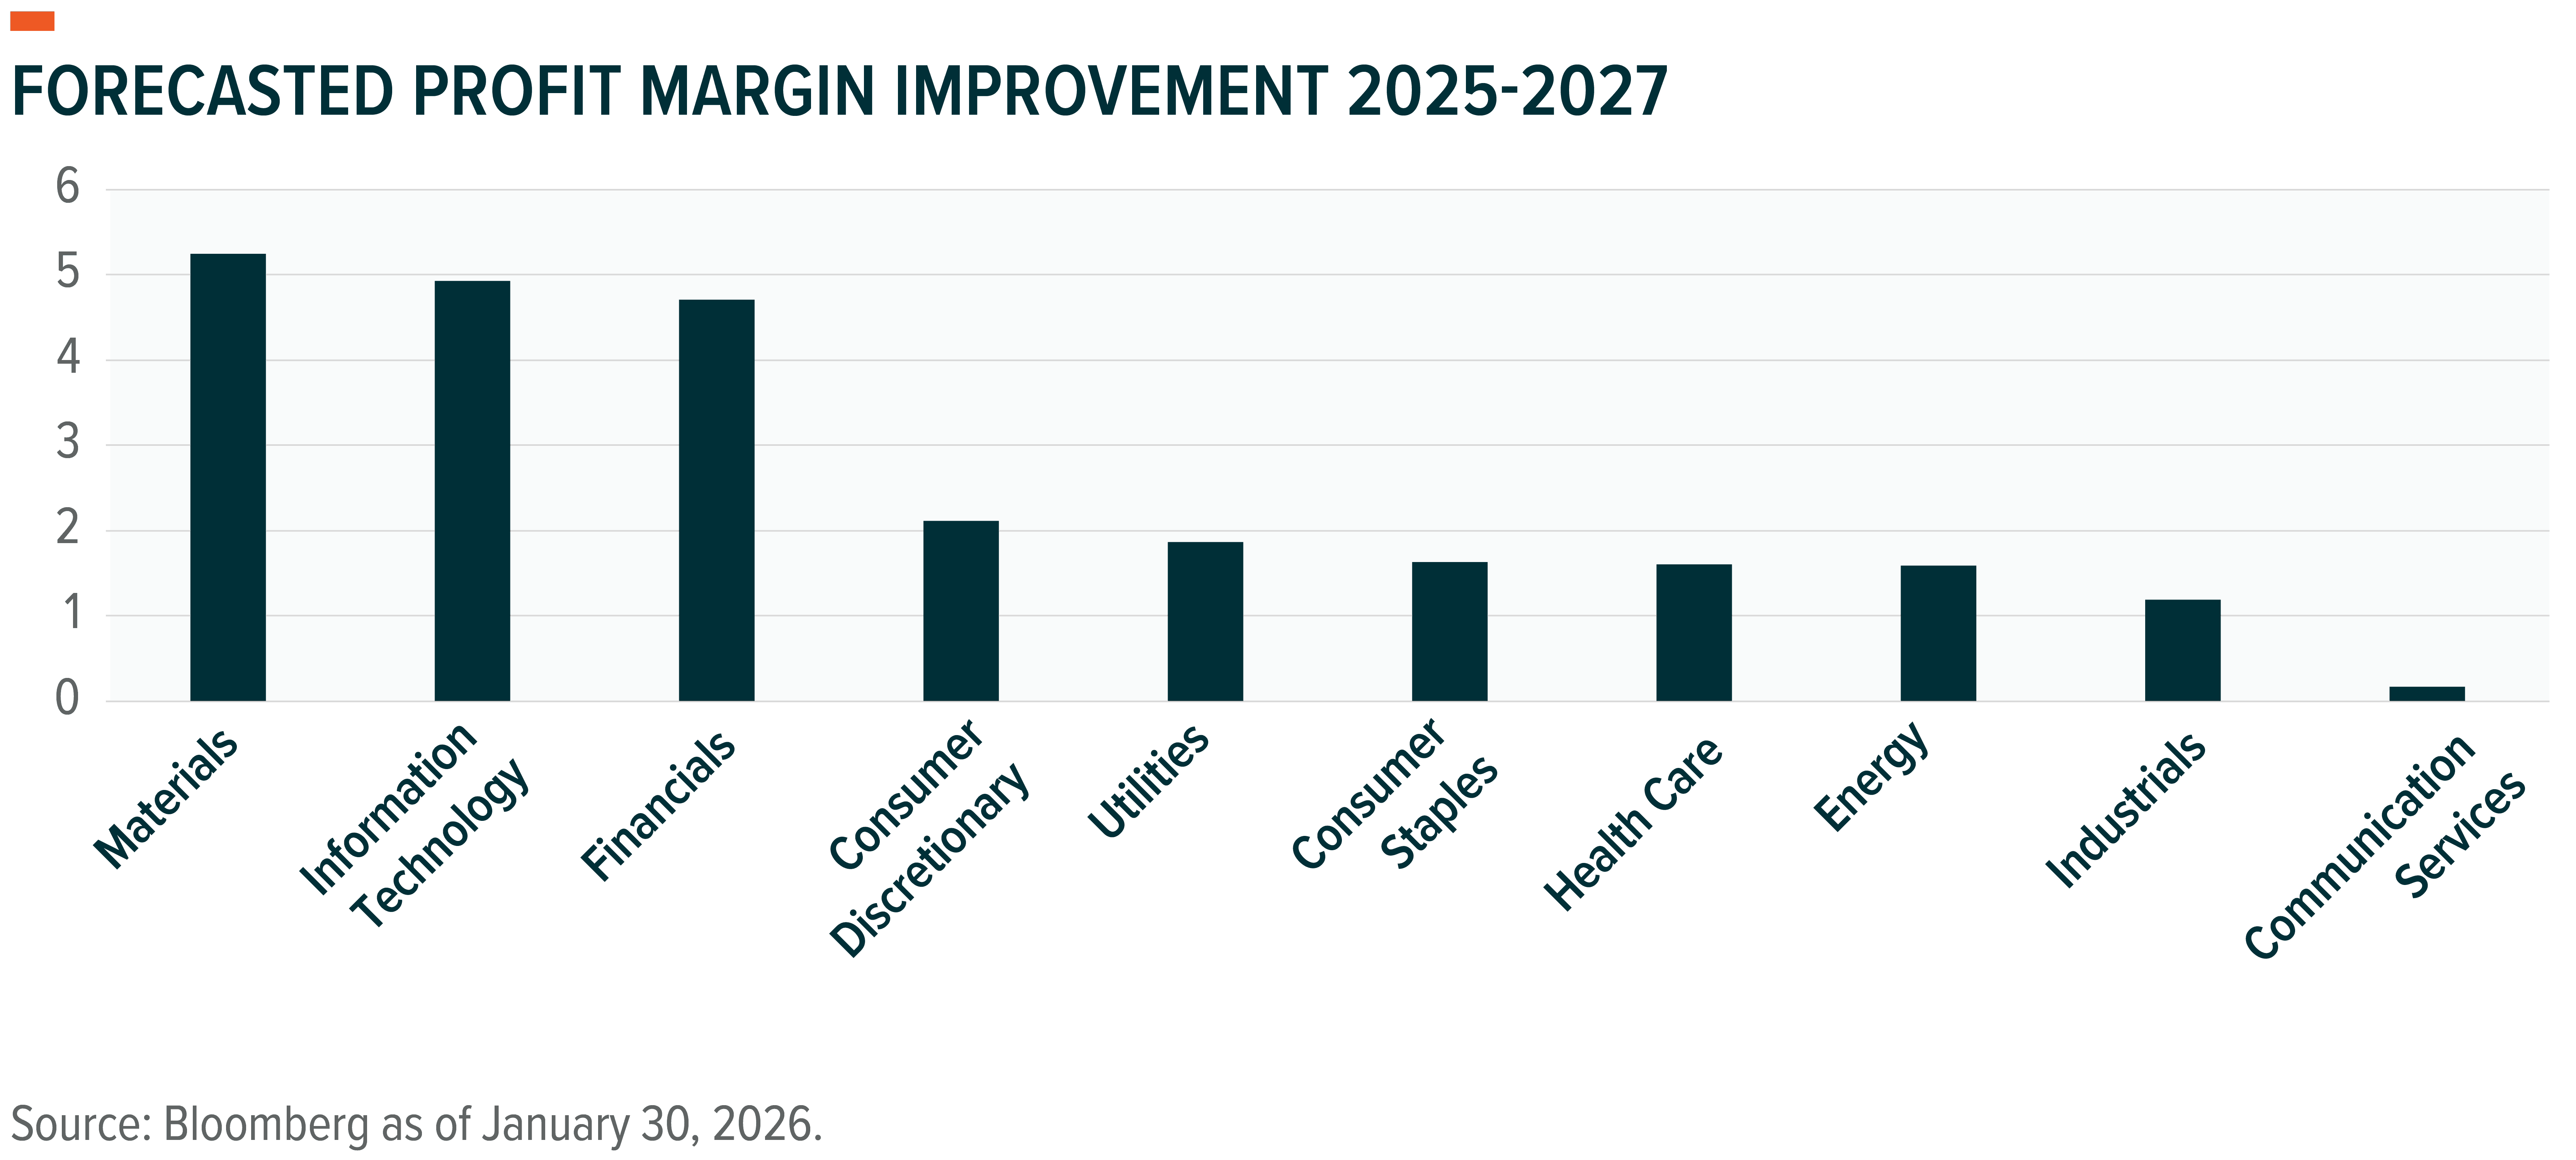
The efficiency angle also appears in expectations for profit margin improvement across sectors over the next two years.30 The best of both worlds may be achieved by owning the AI infrastructure and service providers alongside companies finding efficiency gains. The goal is to benefit from growth and profitability today while participating in the ongoing productivity and profitability shifts likely to emerge in the years ahead.