

After a strong first half of 2026, emerging markets ex-China equities pulled back slightly in the third quarter as an AI chip selloff and rising yields outweighed gains in Latin America and other smaller regions.1
Market Review
The MSCI Emerging Markets ex China Index (“the benchmark”) fell 1.32% in the third quarter.2 A July selloff in AI-linked memory and semiconductor shares did most of the damage and centered on Korea.3 The Federal Reserve raised rates in September for the first time since 2023, and global bond yields rose.4 Elevated oil prices and heavy foreign selling weighed on India.5 Dispersion ran wide. Greece, Colombia and Poland each gained more than 15%, Brazil and Taiwan advanced, and Korea and India declined.6
Fund Performance & Attribution
EMM outperformed the MSCI Emerging Markets ex China Index for the quarter by 96 basis points. Year to date, EMM returned 32.24% at NAV versus 36.95% for the benchmark. This attribution nets each issuer’s local, ADR and GDR lines into one position, isolating the stock decision from the vehicle, and looks through EMM’s holdings in NDIA and BRAZ.7
Contributors: From a country perspective, South Korea, Canada and Greece added the most, with a modest underweight in Korea where our holdings fell less than the benchmark’s, and overweights in Canada and Greece. From a sector perspective, information technology, consumer staples and consumer discretionary led, helped by an underweight of 6.63 points in technology and an overweight of 1.74 points in consumer staples. In terms of individual securities, an underweight in SK Hynix (3.42% versus 7.19%) and overweights in Shinhan Financial Group and MediaTek contributed most.
Detractors: From a country perspective, Taiwan, South Africa and the United Arab Emirates detracted. We held an underweight of 1.55 points in Taiwan, a benchmark weight in South Africa where our holdings fell 7.26% against 0.57%, and a slight overweight in the United Arab Emirates. From a sector perspective, industrials, materials and energy lagged, led by an overweight of 4.70 points in industrials. In terms of individual securities, SK Square (2.24% versus 0.77%) and Samsung C&T (2.31% versus 0.22%), both overweights, and Taiwan Semiconductor, an underweight (17.30% versus 19.23%), detracted most.
This quarter we added Bank Pekao and sold Dino Polska and Salik.8
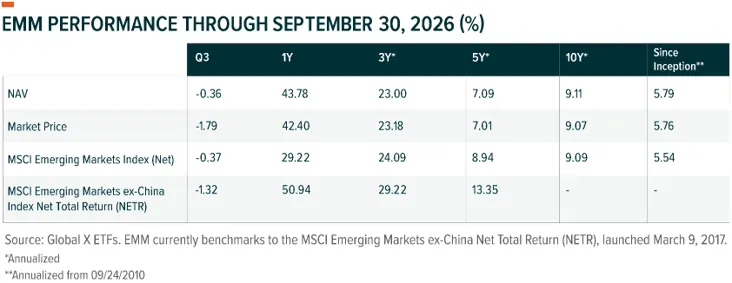
Effective April 1, 2024, the fund’s benchmark changed from the MSCI Emerging Markets Index to the MSCI Emerging Markets ex China Index NETR.
Effective May 12, 2023, the fund acquired the performance, financial, accounting, and other historical information of the Mirae Asset Emerging Markets Fund. Performance shown prior to May 15, 2023 reflects the return of the Mirae Asset Emerging Markets Fund's I shares with a NAV conversion ratio of 0.40 applied in connection with the acquisition. Market price returns prior to that date reflect the predecessor fund’s NAV return.
The performance data quoted represents past performance. Past performance does not guarantee future results. The investment return and principal value of an investment will fluctuate so that an investor's shares, when sold or redeemed, may be worth more or less than their original cost and current performance may be lower or higher than the performance quoted. For performance data current to the most recent quarter- and month-end, please visit globalxetfs.com/funds/emm. Total expense ratio: 0.66%.
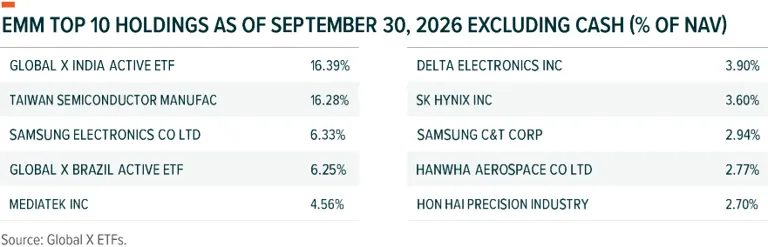
Holdings are subject to change.
Outlook
We stay constructive on emerging markets ex-China heading into the fourth quarter based on 4 factors:
Risks include further Fed tightening, elevated oil prices and the pace of AI capital spending.
Why This Fund
We believe active management remains critical as EM economies do not move in lock step together. Companies that generate returns above their cost of capital, supported by strong management teams and disciplined balance sheets, could outperform. The strategy focuses on identifying businesses with durable competitive advantages and the ability to compound returns over time. EMM delivers bottom-up fundamental analysis with the fee structure, liquidity, and transparency of its ETF wrapper, now with a lower expense ratio of 65 basis points (as of April 1, 2026).10
Related ETF
EMM – Global X Emerging Markets ex-China ETF
Click the fund name above to view current performance and holdings. Holdings are subject to change. Current and future holdings are subject to risk.


