Skip to Main Content
Subscribe to Newsletters
Global X Logo
Search
Content loaded

Explore

Our ETFs

Investment Insights

Thought LeadershipProduct ResearchCharting DisruptionMidyear Outlook 2026

Investor Resources

EducationHow to InvestTax Resources

About Us

About Global XNewsroomCareersContact Us

Follow Us

socaial media icon for LinkedInLinkedInSocial media icon for X (twitter)XSocial media icon for FacebookFacebookSocial media icon for InstagramInstagramSocial media icon for Youtube

Copyright © 2026 Global X. All rights reserved.

Privacy PolicyAccessibility Statement
YouTube

SEI Investments Distribution Co. (1 Freedom Valley Drive, Oaks, PA, 19456) is the distributor for the Global X Funds.

Check the background of SIDCO and Global X's Registered Representatives on FINRA's BrokerCheck.

Subscribe to our newsletter

Get the latest news and updates from our team.

Subscribe
Content
Product ResearchInternationalActive Emerging

Global X India Active ETF (NDIA) 3Q26 Commentary

x
M
Multiple authors
Oct 28, 2026·3 min read

Indian equities fell in the third quarter as higher oil prices, a Federal Reserve rate hike and September foreign selling erased the gains of July and August. NDIA outperformed its benchmark the MSCI India Index (net) through stock selection.

Market Review

Indian equities fell 5.61% in the third quarter after a modest gain through August.1 Brent crude rose more than 20% in July after a fragile pause in the US-Iran conflict collapsed.2 The Federal Reserve raised rates in September for the first time since 2023,3 and foreign portfolio investors, net buyers in July and August, turned net sellers.4 Dispersion ran wide. In the benchmark, Consumer Staples, Utilities and Industrials fell the most, while only Information Technology and Real Estate rose.5 GDP growth remained robust and domestic demand held firm, with September GST (goods and services tax) collections up 14.7% year over year.6

Fund Performance & Attribution

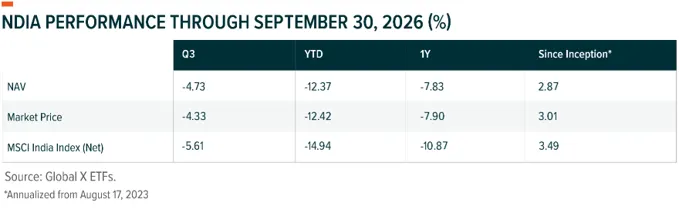
NDIA outperformed its benchmark for the quarter by 88 basis points. Year to date, NDIA returned -12.37% at NAV versus -14.94% for the benchmark.7 This attribution nets each issuer’s local, ADR and GDR lines into one position, isolating the stock decision from the vehicle.8

  • Contributors: From a sector perspective, Consumer Discretionary, Materials and Industrials added the most. Stock selection drove each: NDIA held underweights of 0.79, 0.92 and 0.31 percentage points, but its holdings returned 2.27%, 1.36% and -5.50% against -1.43%, -3.45% and -8.51% for the benchmark sectors. In terms of individual securities, an overweight in Eternal (2.46% versus 0.77%), an overweight in Federal Bank, which we sold during the quarter, and the absence of Suzlon Energy, which fell 33.77% in the benchmark, contributed most.

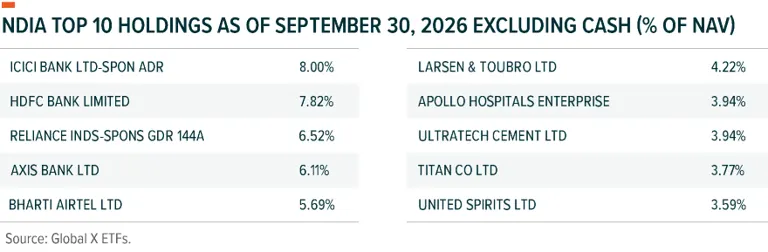
  • Detractors: From a sector perspective, Financials, Energy and Real Estate lagged. NDIA held overweights of 0.68, 0.79 and 1.31 percentage points, and its holdings trailed the benchmark’s in each. In terms of individual securities, Go Digit General Insurance, which the benchmark does not hold, Axis Bank (5.52% versus 2.21%) and Avenue Supermarts (2.32% versus 0.44%) detracted most. Reliance Industries, held through its GDR, also detracted as the GDR trailed the local line.

This quarter we added IndusInd Bank and sold Federal Bank.9
Global X India Active ETF (NDIA) 3Q26 Commentary Image 1

The performance data quoted represents past performance. Past performance does not guarantee future results. The investment return and principal value of an investment will fluctuate so that an investor's shares, when sold or redeemed, may be worth more or less than their original cost and current performance may be lower or higher than the performance quoted. Performance current to the most recent quarter- and month-end is available at https://www.globalxetfs.com/funds/ndia/. Expense Ratio: 0.75%.
Global X India Active ETF (NDIA) 3Q26 Commentary Image 2

Holdings subject to change

Outlook

We stay constructive on India heading into the fourth quarter based on 4 factors:

Risks include further Fed tightening and elevated oil prices.

Why This Fund

We believe active management remains critical to navigating dispersion across Indian sectors and stocks. Companies that generate returns above their cost of capital, supported by strong management teams, could outperform. The strategy focuses on identifying businesses with durable competitive advantages and the potential to compound returns over time. NDIA, the first active India ETF offered by Global X ETFs, delivers bottom-up fundamental analysis, supported by a Mumbai based team at Global X’s affiliate, Mirae Asset, with the fee structure, liquidity, transparency, and potential tax efficiency of its ETF wrapper, at an expense ratio of 75 basis points.12

Related ETF

NDIA – Global X India Active ETF

Click the fund name above to view current performance and holdings. Holdings are subject to change. Current and future holdings are subject to risk.


The combination of discounted valuations and our perception of increasing EPS growth rates. India trades at over one standard deviation below its five-year historical mean and roughly 4% below the 18.6 times for the S&P 500.10

Resilient domestic demand. September GST collections rose 14.7% and first-quarter fiscal 2027 GDP growth reached 7.8%.11

We see India offering the best demographic dividend in international markets

India could be a key beneficiary of dropping oil prices

India may represent an important winner of global supply chain diversification trends

Related articles

1of3
Product ResearchInternationalActive Emerging

Global X Brazil Active ETF (BRAZ) 3Q26 Commentary

M

Multiple authors

Oct 28, 20263 min read
Product ResearchInternationalActive Emerging

Global X Emerging Markets Ex-China ETF (EMM) 3Q26 Commentary

Thought LeadershipIndiaInternational

Why India? And Why NDIA?

M
Product ResearchInternationalActive Emerging

Global X Brazil Active ETF (BRAZ) 3Q26 Commentary

Related funds
International
NDIAIndia Active ETF
Explore All ETFs
Footnotes
  1. Global X ETFs. NDIA Performance History, cumulative returns as of September 30, 2026 (benchmark: MSCI India Index net return of -5.61% for the quarter and -14.94% year to date).

  2. Rigzone (Bloomberg wire). "Brent Caps Strongest Month Since March." Published July 31, 2026 (Brent up nearly 24% in July; front-month contract near $88 on July 31); U.S. Energy Information Administration. "Crude oil prices and refinery margins generally increased throughout the third quarter." Today in Energy, October 5, 2026 (front-month Brent near $72 on July 1; above $100 on July 23).

  3. Board of Governors of the Federal Reserve System. "Federal Reserve Issues FOMC Statement." Press release, September 16, 2026; Trading Economics. "Fed Raises Rates for 1st Time Since 2023." Published September 16, 2026.

  4. UNI. "FPIs pull out Rs 20,974 cr from Indian equities in Sep so far." Published September 20, 2026 (CDSL data: net inflows of Rs 20,200 crore in July and Rs 29,630 crore in August; net outflow of Rs 20,974 crore in September through September 18); FPJ Web Desk. "FPIs Dump Rs 7,443 Crore In September First Week, 2026 Equity Exodus Hits Rs 2.32 Lakh Crore." Free Press Journal. Published September 7, 2026.

  5. Bloomberg LP. PORT attribution, NDIA versus MSCI India Index (NDEUSIA Index), quarter ended September 30, 2026, benchmark sector returns.

  6. IANS via The Morung Express. "Gross GST collection rises 14.7 pc to almost Rs 2.04 lakh crore in September." Published October 1, 2026 (gross GST collections of ₹2,03,521 crore, up 14.7% year over year).

  7. Global X ETFs. NDIA Performance History, cumulative returns as of September 30, 2026 (fund NAV and benchmark returns).

  8. Bloomberg LP. PORT attribution, NDIA versus MSCI India Index (NDEUSIA Index), quarter ended September 30, 2026. Local, ADR and GDR lines of the same issuer are combined. Overweights and underweights compare average portfolio weights with average benchmark weights over the quarter.

  9. Bloomberg LP. NDIA holdings as of June 30, 2026 and September 30, 2026. Adds and sells reflect positions absent at one date and present at the other.

  10. Bloomberg LP. MSCI India Index (MXIN Index) and S&P 500 Index (SPX Index), price-to-earnings ratio on two-year estimates (2GY Est), as of October 7, 2026 (MXIN 17.83x; SPX 18.56x). Bloomberg five-year historical mean of 20.08x; one standard deviation above the mean at 21.85x.

  11. All India Radio News (newsonair.gov.in). "India’s real GDP growth rate rises to 7.8% in first quarter of FY 2026-27." Published August 31, 2026 (Ministry of Statistics and Programme Implementation estimate; first-quarter fiscal 2027 GDP growth of 7.8%); IANS via The Morung Express. "Gross GST collection rises 14.7 pc to almost Rs 2.04 lakh crore in September." Published October 1, 2026.

  12. Global X ETFs. Global X India Active ETF (NDIA), fund page, accessed October 8, 2026 (investment objective; total expense ratio of 0.75%); Global X ETFs. "Global X India Active ETF (NDIA) 2Q26 Commentary." July 2026 (first active India ETF offered by Global X ETFs). Tax efficiency is not guaranteed.

Glossary
  • Standard Deviation: Standard deviation is a measure of the dispersion of data points around their mean.

Brazilian equities rose in the third quarter as higher oil prices lifted energy, the central bank kept cutting rates and foreign flows returned in September.

Brazilian equities rose in the third quarter as higher oil prices lifted energy, the central bank kept cutting rates and foreign flows returned in September.

After a strong first half of 2026, emerging markets ex-China equities pulled back slightly in the third quarter as an AI chip selloff and rising yields outweighed gains in Latin America and other smaller regions.

M

Malcolm Dorson

Oct 28, 20264 min read

We believe India’s favorable demographics, reforms, and digital transformation may support long-term growth opportunities for active investors.

Multiple authors

Sep 3, 20260 min read
M

Multiple authors

Oct 28, 20263 min read
Product ResearchInternationalActive Emerging

Global X Emerging Markets Ex-China ETF (EMM) 3Q26 Commentary

After a strong first half of 2026, emerging markets ex-China equities pulled back slightly in the third quarter as an AI chip selloff and rising yields outweighed gains in Latin America and other smaller regions.

M

Malcolm Dorson

Oct 28, 20264 min read
Thought LeadershipIndiaInternational

Why India? And Why NDIA?

We believe India’s favorable demographics, reforms, and digital transformation may support long-term growth opportunities for active investors.

M

Multiple authors

Sep 3, 20260 min read