


Last year, equities and fixed income underwent a significant shift as the Federal Reserve embarked on its most potent tightening campaign since the 1980s to combat inflation levels not seen in decades.1 In the first quarter of 2023, the results of some of these policy changes began to percolate into the banking sector specifically. A few high-profile incidents in the regional banking sector of the market began leading to depositor uncertainty. Preferred stocks became one pocket of the market investors began to zero in on as the fallout from the regional banking sector issues were analyzed by market participants. As financial institutions are the primary issuers of preferreds, in this piece, we seek to provide an update on the U.S. banking sector while delving deeper into the broader issues affecting regional banks and more specifically, our current outlook for preferreds.
Key Takeaways
The latest strains affecting U.S. regional banks have intensified the spotlight on the health of the country’s banking sector. Relative to the past, the present status of the banking sector may be more positive than the market is giving it credit for.
“Big Bank” common equity and preferreds have held up against regional banks, showing where investor fear is being concentrated in the markets, and in our opinion, signals low contagion risk for well diversified banks.
The Global X U.S. Preferred ETF (PFFD) offers exposure to a broad basket of U.S. preferred stocks, an asset class that has historically offered higher yield potential compared to others. With a higher level of exposure to Global Systemically Important Banks (“GSIBs”) relative to its regional bank preferred holdings, PFFD may be well positioned for the prevailing economic conditions.
Historical Bank Failures and the Impact on Preferreds
The recent banking turmoil involving three major coastal-based banks - Silicon Valley Bank, Signature Bank, and First Republic - has sparked concern within the financial sector about whether these are contained issues or more widespread across the banking sector. Investors are evaluating the possibility of any potential contagion effects for US banks. Preferred stocks, which have typically been issued by financial institutions, specifically banks, is one pocket of the market where the fallout from specific coastal-based banks raised questions about the outlook for this asset class. Although these recent events may appear infrequent, partly due to the historically sparse number of bank failures since 2017, it is important to note that there is a precedent for bank failures, as shown in the graph below.
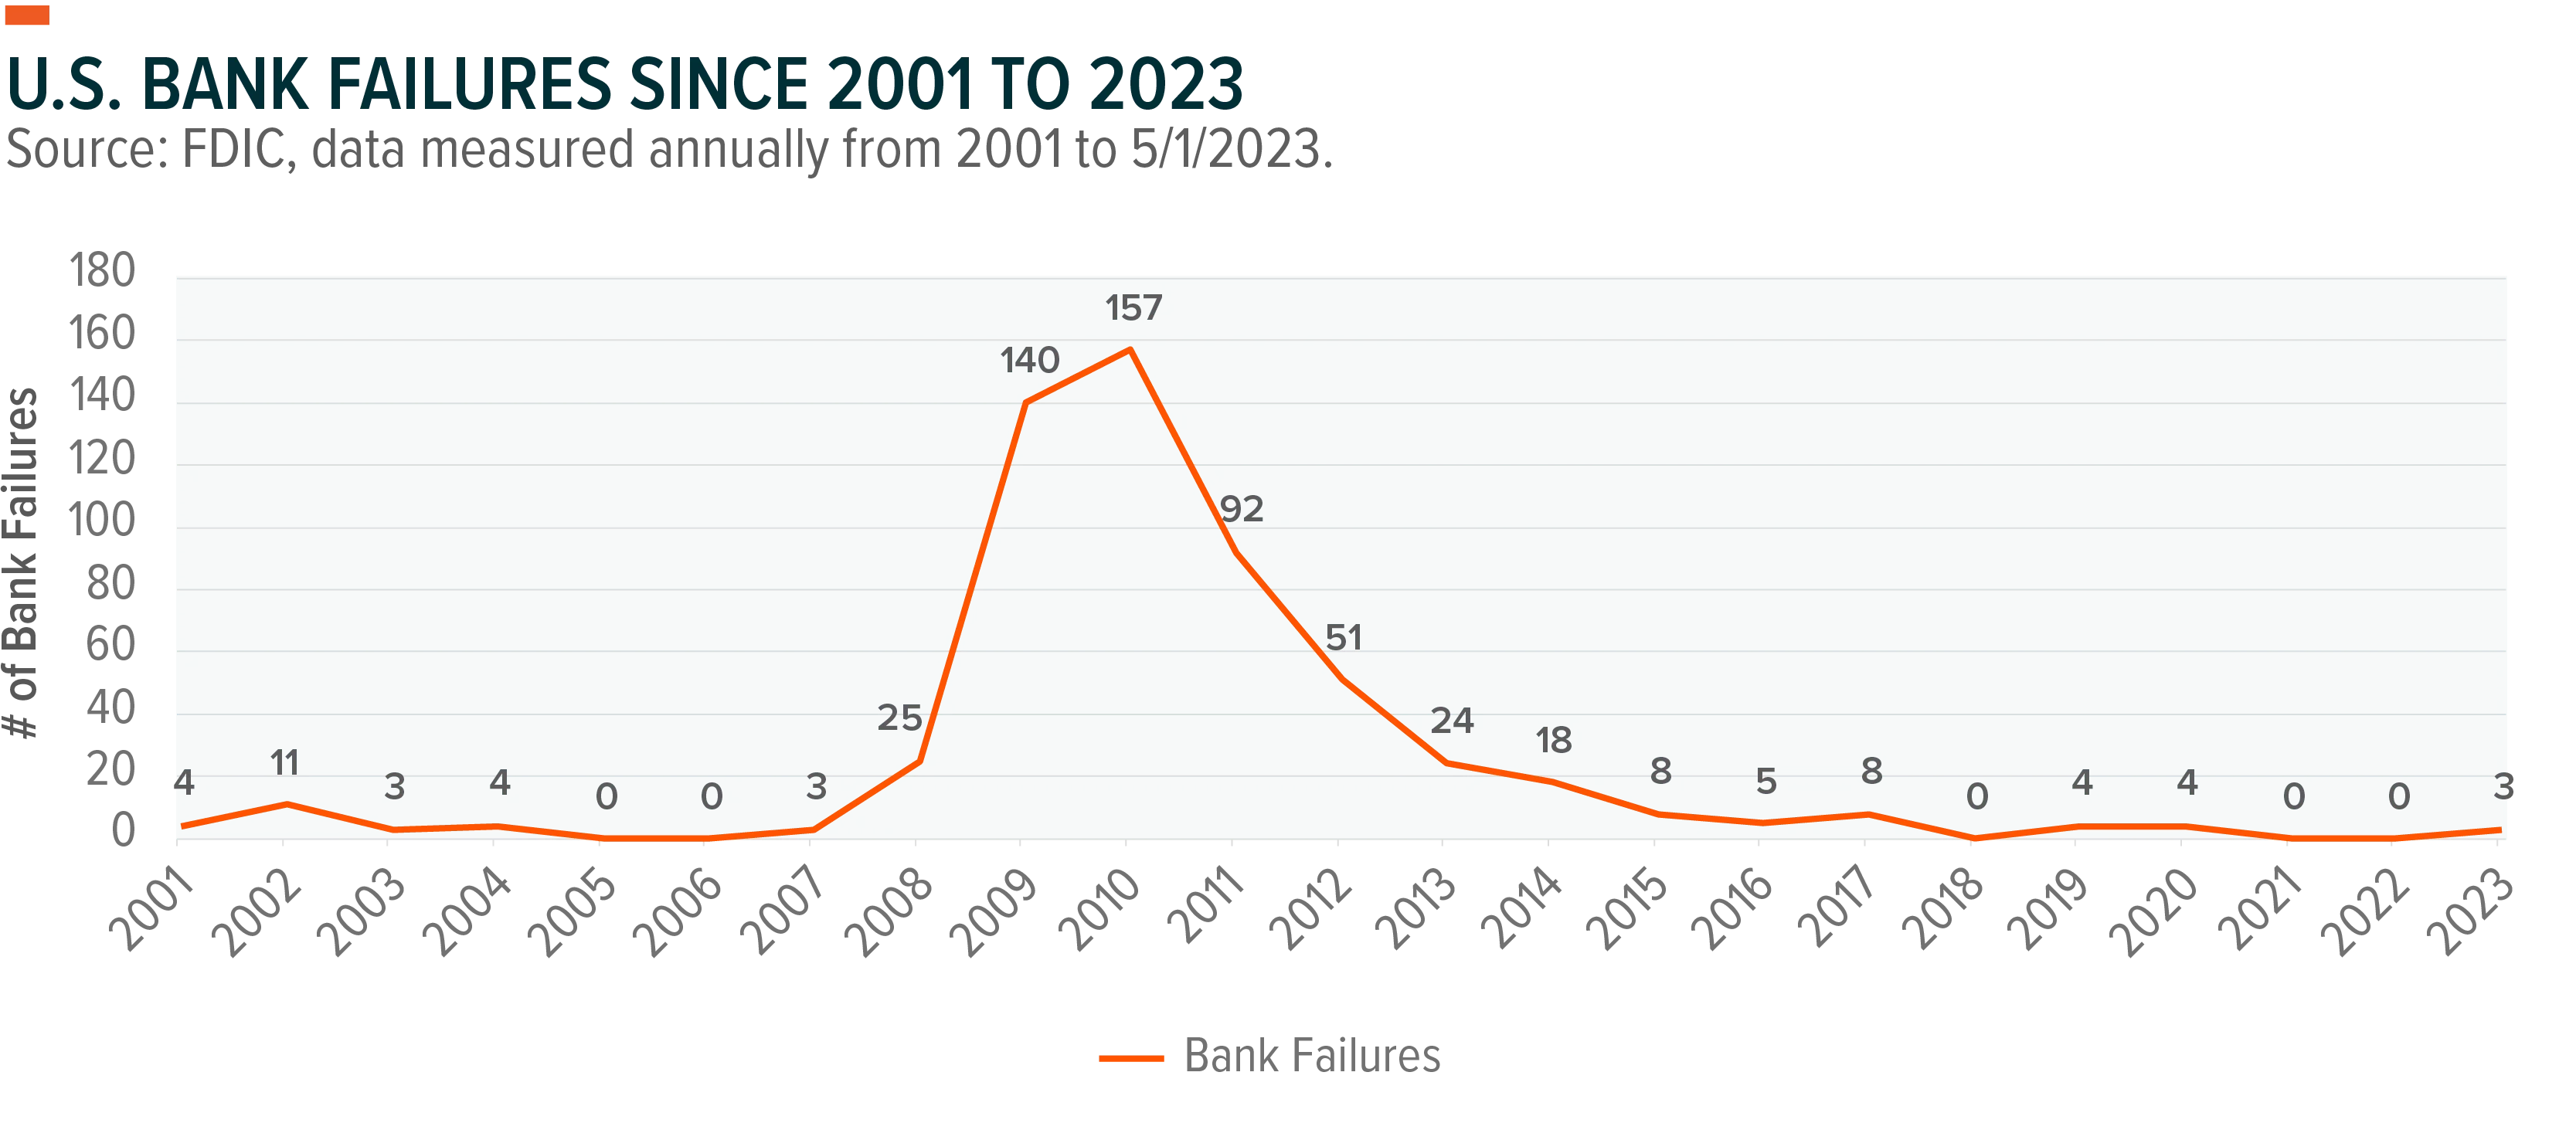
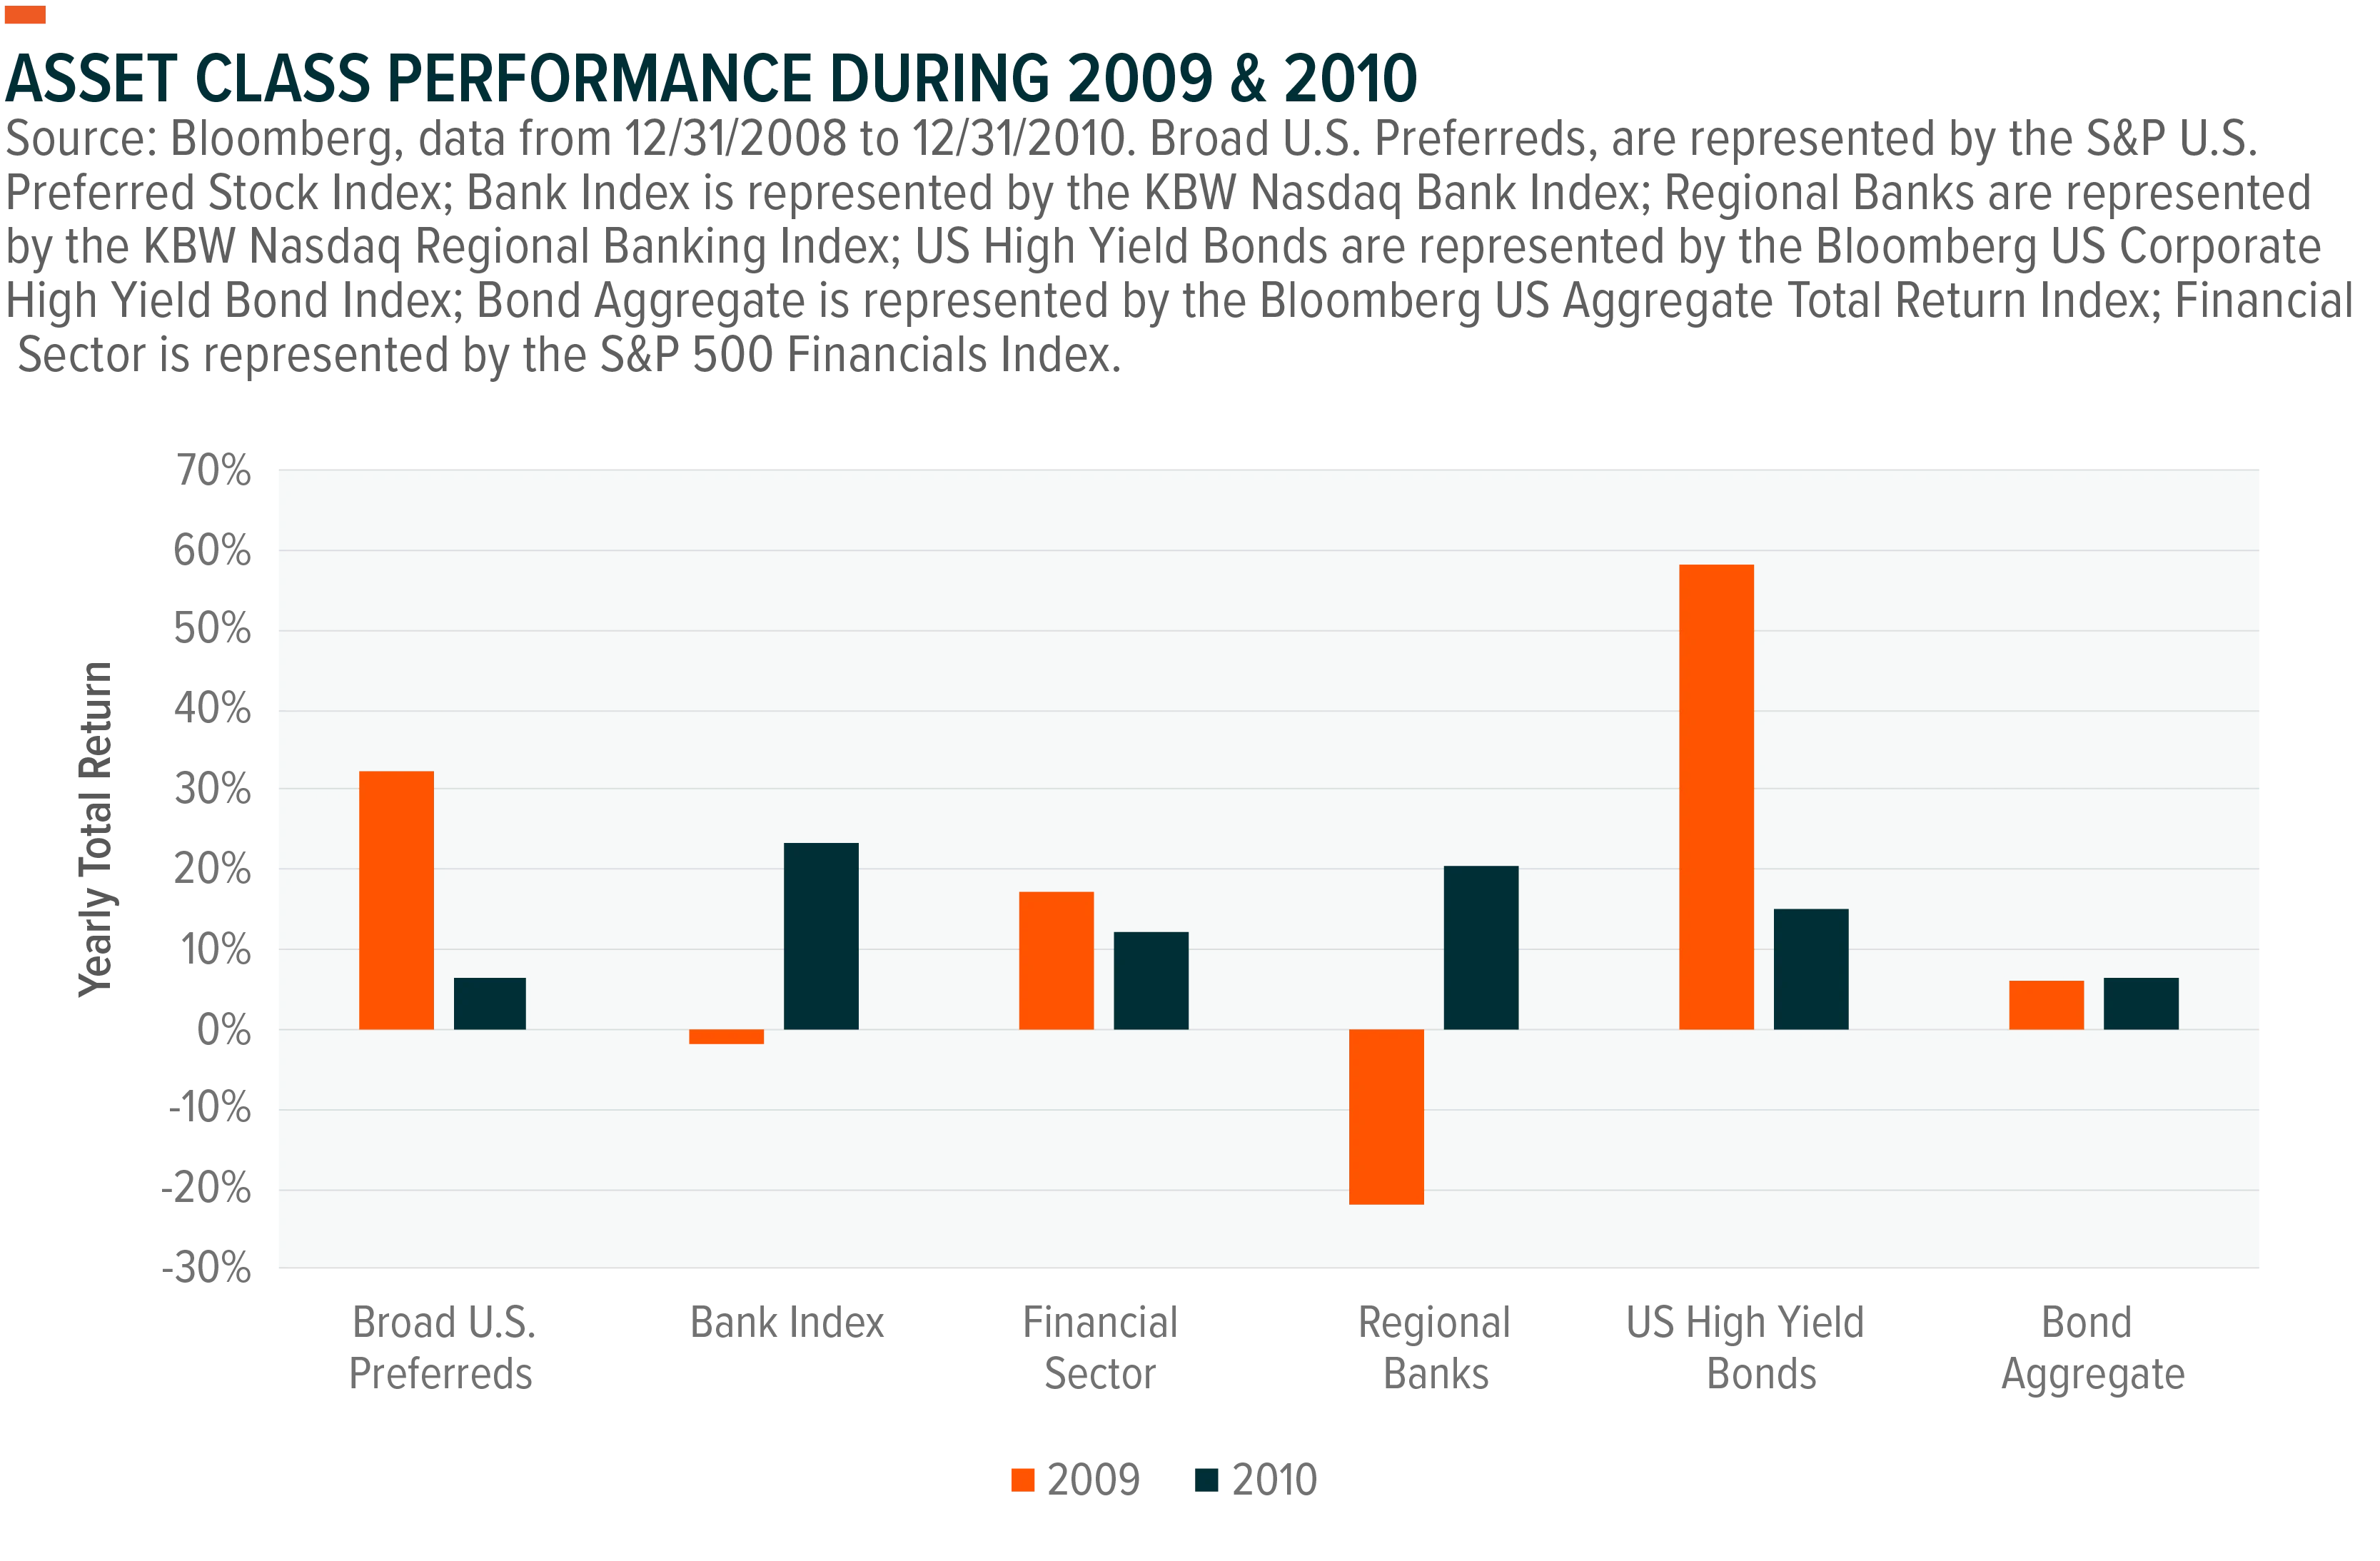
During the Great Financial Crisis (GFS), bank equity performance was negatively impacted by bank closures with bank failures peaking at 157 in 2010 and only slightly less the year prior. Regional banks were not immune to the domino effect of bank failures with the regional bank index and broad bank index declining -22.06% and -1.76% in 2009, respectively.2 Preferreds, however, as represented by the S&P U.S. Preferred Stock Index, returned 32.12% in 2009 and 6.36% the following year, indicating that preferred shares may not be as correlated to overall banking conditions compared to banks common equity counterpart.3
Collapse of SVB, Signature Bank and First Republic Bank
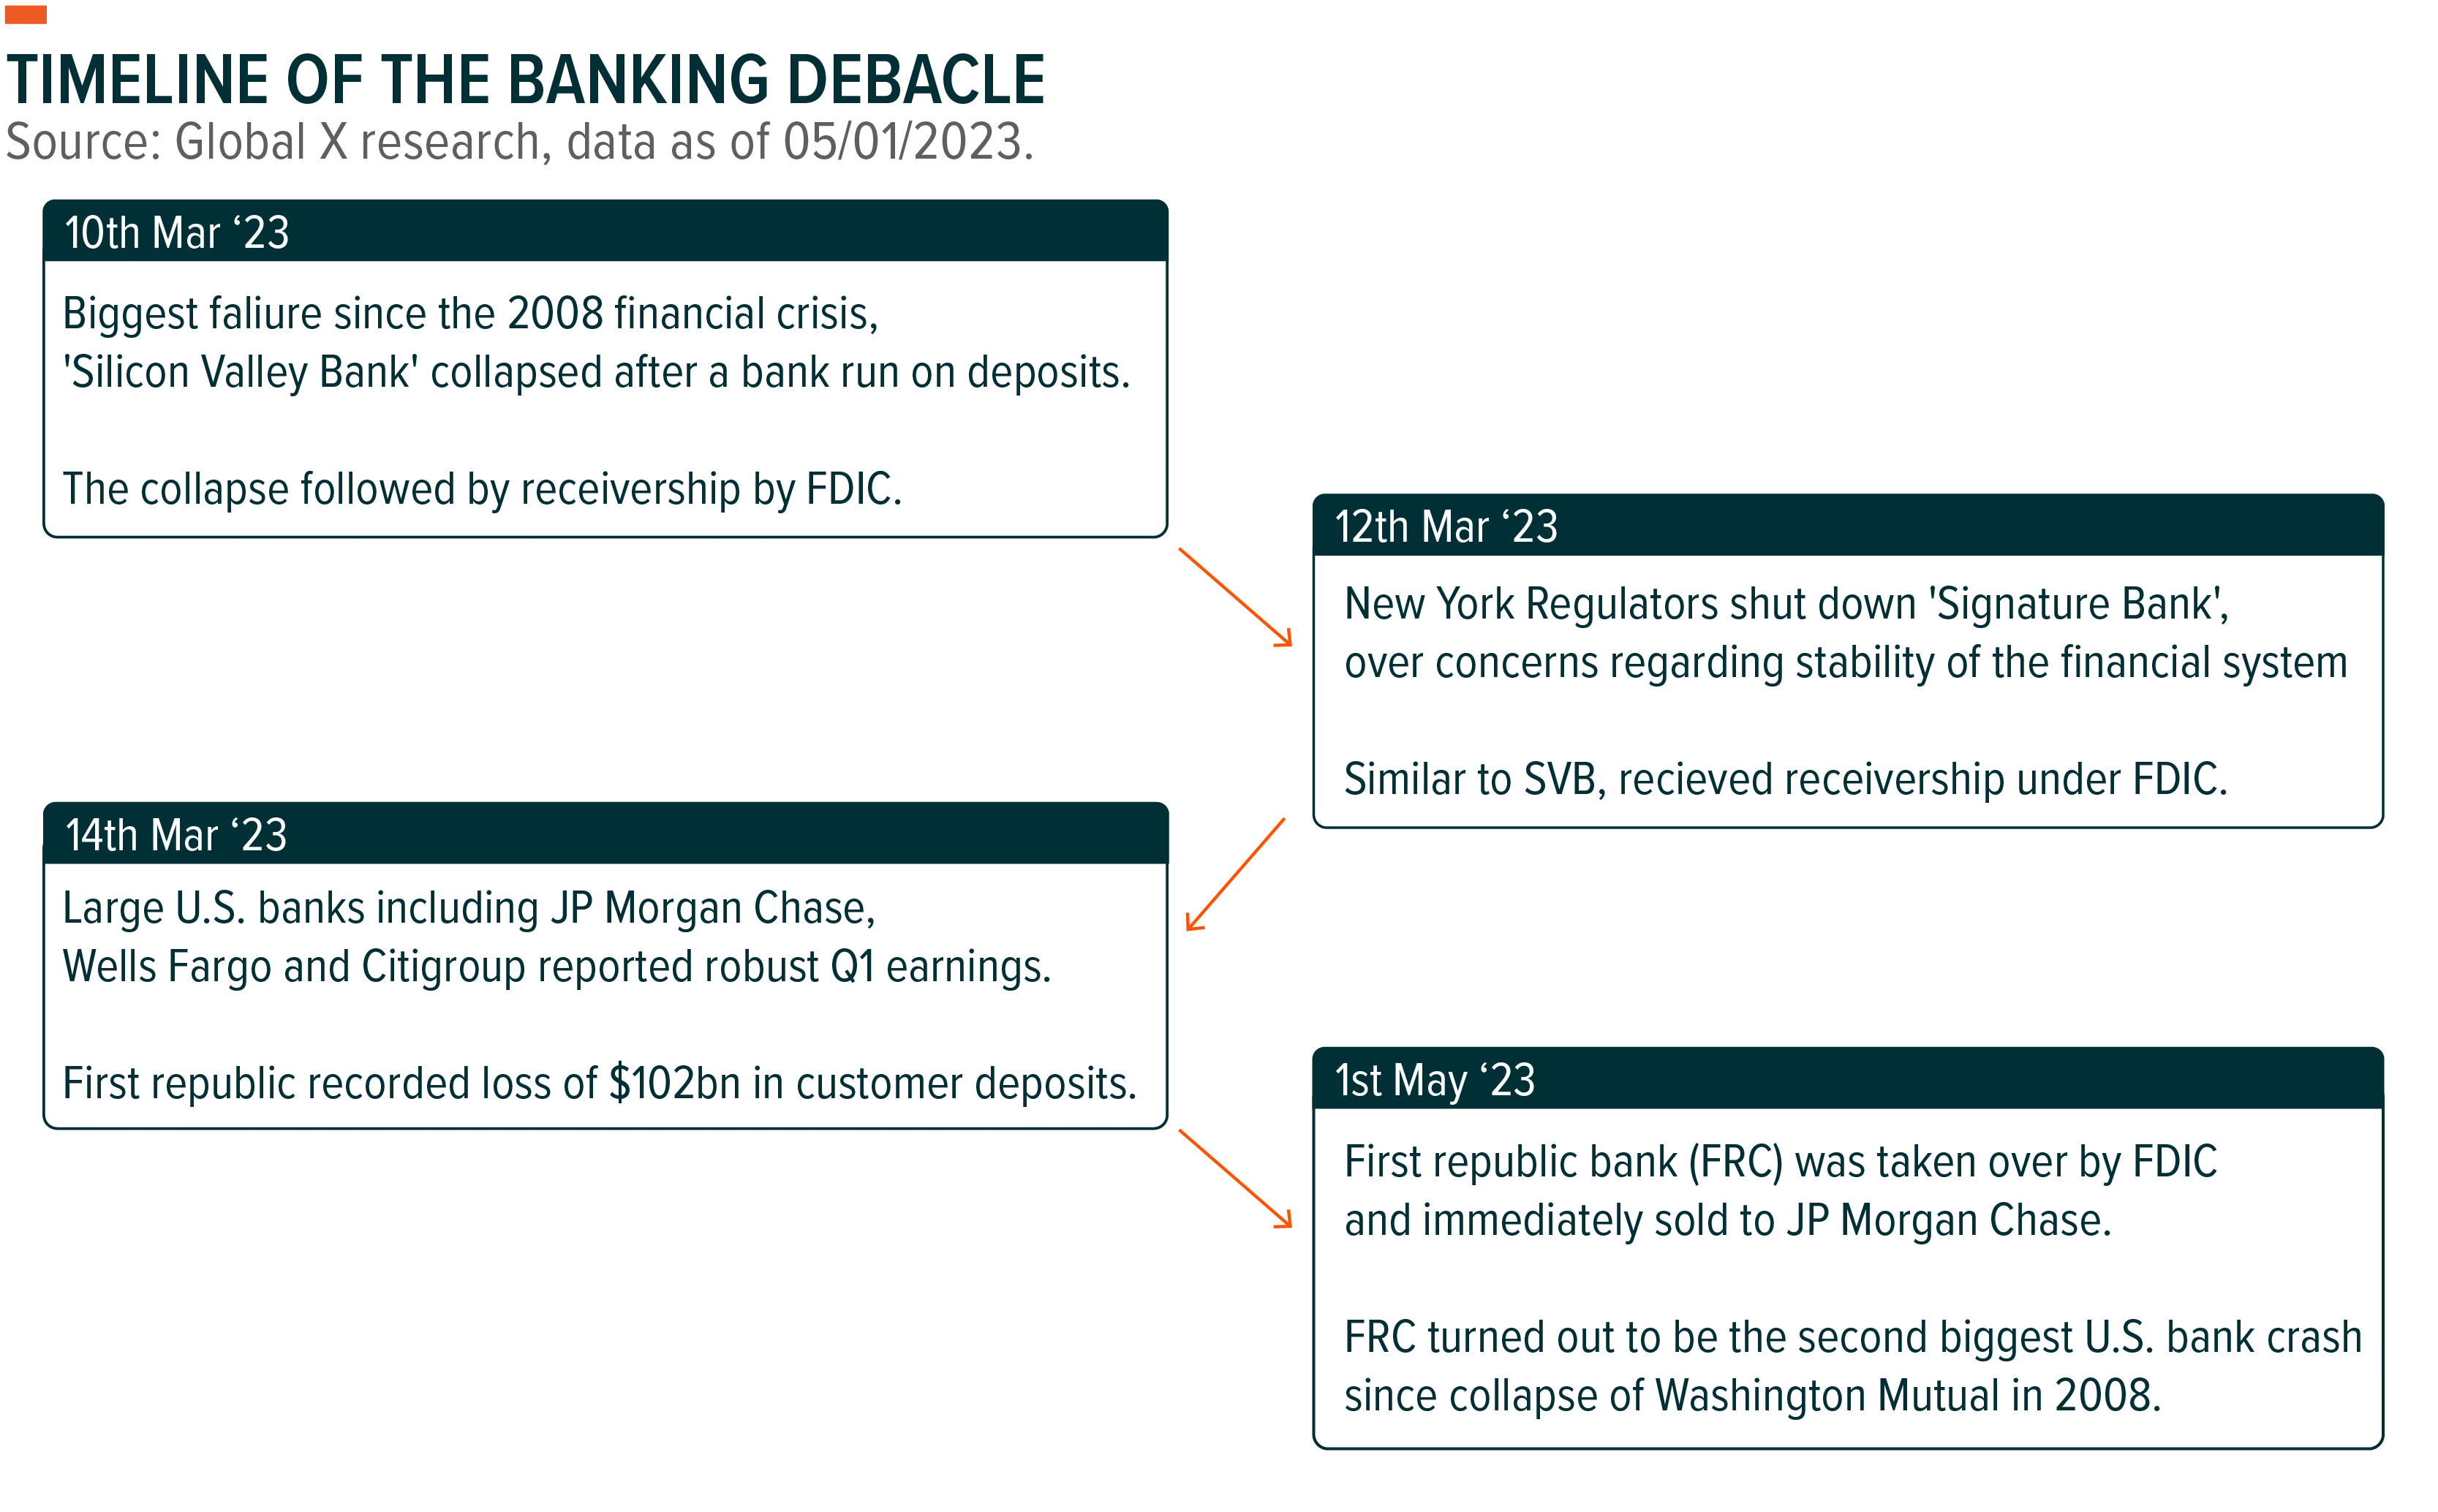
A series of major events shook the US banking industry, beginning on March 10, 2023, with the failure of Silicon Valley Bank (SVB), the 16th largest bank in the United States. This marked the largest bank failure since the GFC.4 SVB, based in Santa Clara, California, experienced a rapid outflow of deposits that escalated into a bank run after reporting a significant sale of “held to maturity” bond assets and a failed capital raise. The bank's extensive lending to higher-risk technology startups, which were adversely affected by tightening financial conditions and reduced investments from venture capital partners, coupled with 89% of the bank's $175 billion deposits being uninsured and exceeding the $250,000 FDIC-insured limit as of the end of 2022, played a crucial role in its collapse.5 Two days later, Signature Bank, a prominent crypto bank in California, encountered operational difficulties primarily attributed to mismanagement, including challenges related to crypto oversight, corporate governance, and a delayed response to the Federal Deposit Insurance Corporation’s (FDIC's) recommendations. These developments raised concerns among regulators, prompting depositors to increase their withdrawals amid growing apprehension about the potential for contagion risk.
In the aftermath of these two collapses, both SVB and Signature Bank entered receivership under the FDIC. However, the tremors did not end there. On May 1, 2023, First Republic Bank (FRC) in California suffered a similar fate. This time, the FDIC and California regulators announced the sale of all $93.5 billion of the bank's deposits and most of its assets to JP Morgan for $10.6 billion. The deal caused a significant loss for First Republic's investors, and is estimated to have cost the FDIC's insurance fund approximately $13 billion. While these three banks catered to different borrowers, all three had a heavy number of uninsured depositors due to their focus on high-net-worth individuals and entities.6
Biggest U.S. Banks Reported Bumper Profits Amid Industry Turmoil
Amidst the recent failures within the banking sector, it is notable that the largest banks in the United States have emerged relatively unscathed, as demonstrated by their strong first-quarter earnings. We do believe these series of events in the regional banking space may result in larger, more diversified banks benefiting in the future due to their more diversified risk profile. Q1 2023 earnings from some of the banks may be evidence of this. Out of the nine diversified banks within the S&P 500, seven exceeded earnings expectations, with KeyCorp and US Bancorp being the only exceptions in terms of earnings per share (EPS). Both of those banks also had a market capitalization below $50 billion as of the end of April 2023. When examining the banking industry further, it becomes clear that a significant bifurcation in performance existed between regional banks and diversified banks, particularly those classified as "Too Big to Fail."
The 4 largest U.S. banks by deposits (Bank of America, JP Morgan Chase, Citigroup, and Wells Fargo), surpassed earnings expectations and all but Wells Fargo beat earnings estimates by more than 10%.7 This trend may suggest that customers have developed a strong preference for larger institutions that follow stringent regulations aimed at preventing over-lending like the market saw with the less regulated 3 Californian regional banks during the low-interest rate environment in 2020 and 2021. Additionally, the current rise in interest rates has allowed banks to charge borrowers higher loan rates compared to what they pay depositors, exemplified by the average savings yield of 39 bps for U.S. banks. Some of the largest institutions still offering rates well below the average, such as Bank of America's savings yield of 0.01%.8, These factors have further solidified the position of the largest US banks following the recent crisis caused by the collapse of Silicon Valley Bank and Signature Bank.
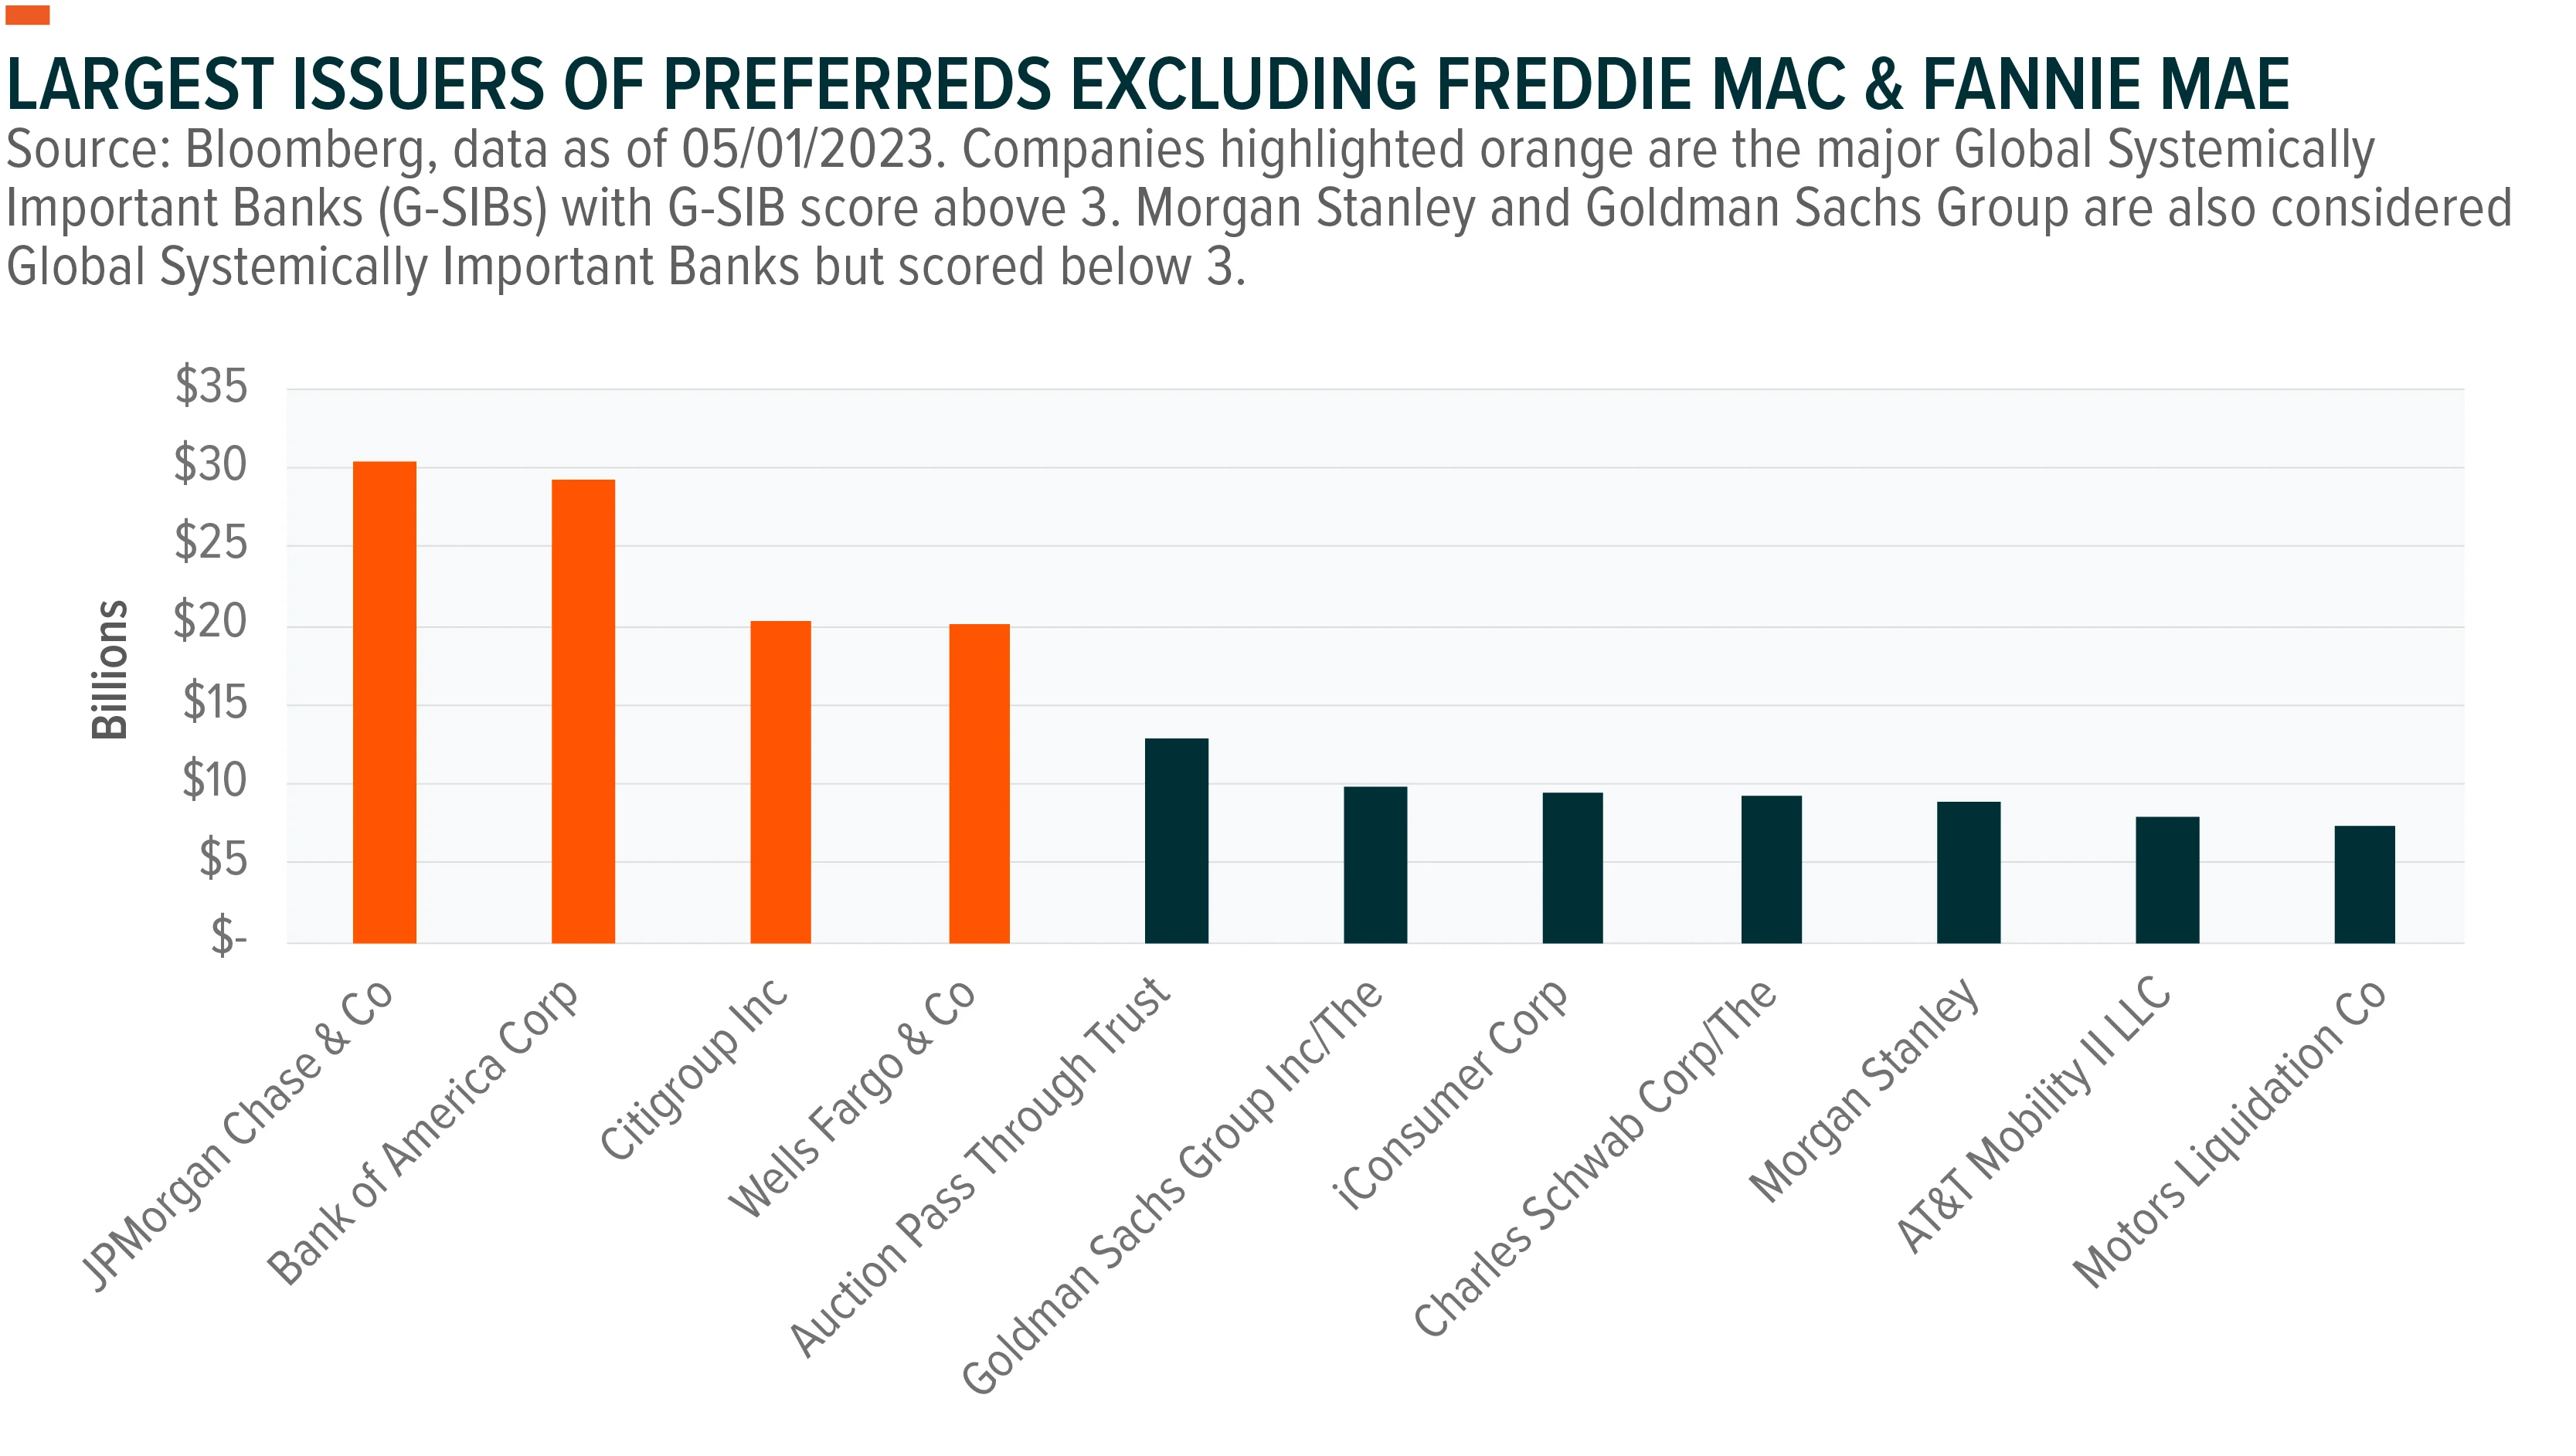
Moreover, these large-cap and GSIB banks are also among the primary issuers of preferreds. This may aid in minimizing the impact of regional bank contagion on broad preferred markets. Interestingly, the four major G-SIBs domiciled in the US also happen to be the four largest preferred issuers. Furthermore, the diversified nature of these banks' businesses, which include business loans, credit cards, trading, investment banking, and more, may help mitigate the risk associated with any one type of lending practice, resulting in more effective risk mitigation.
Pendulum Shift from Interest Rate Risk to Liquidity Risk
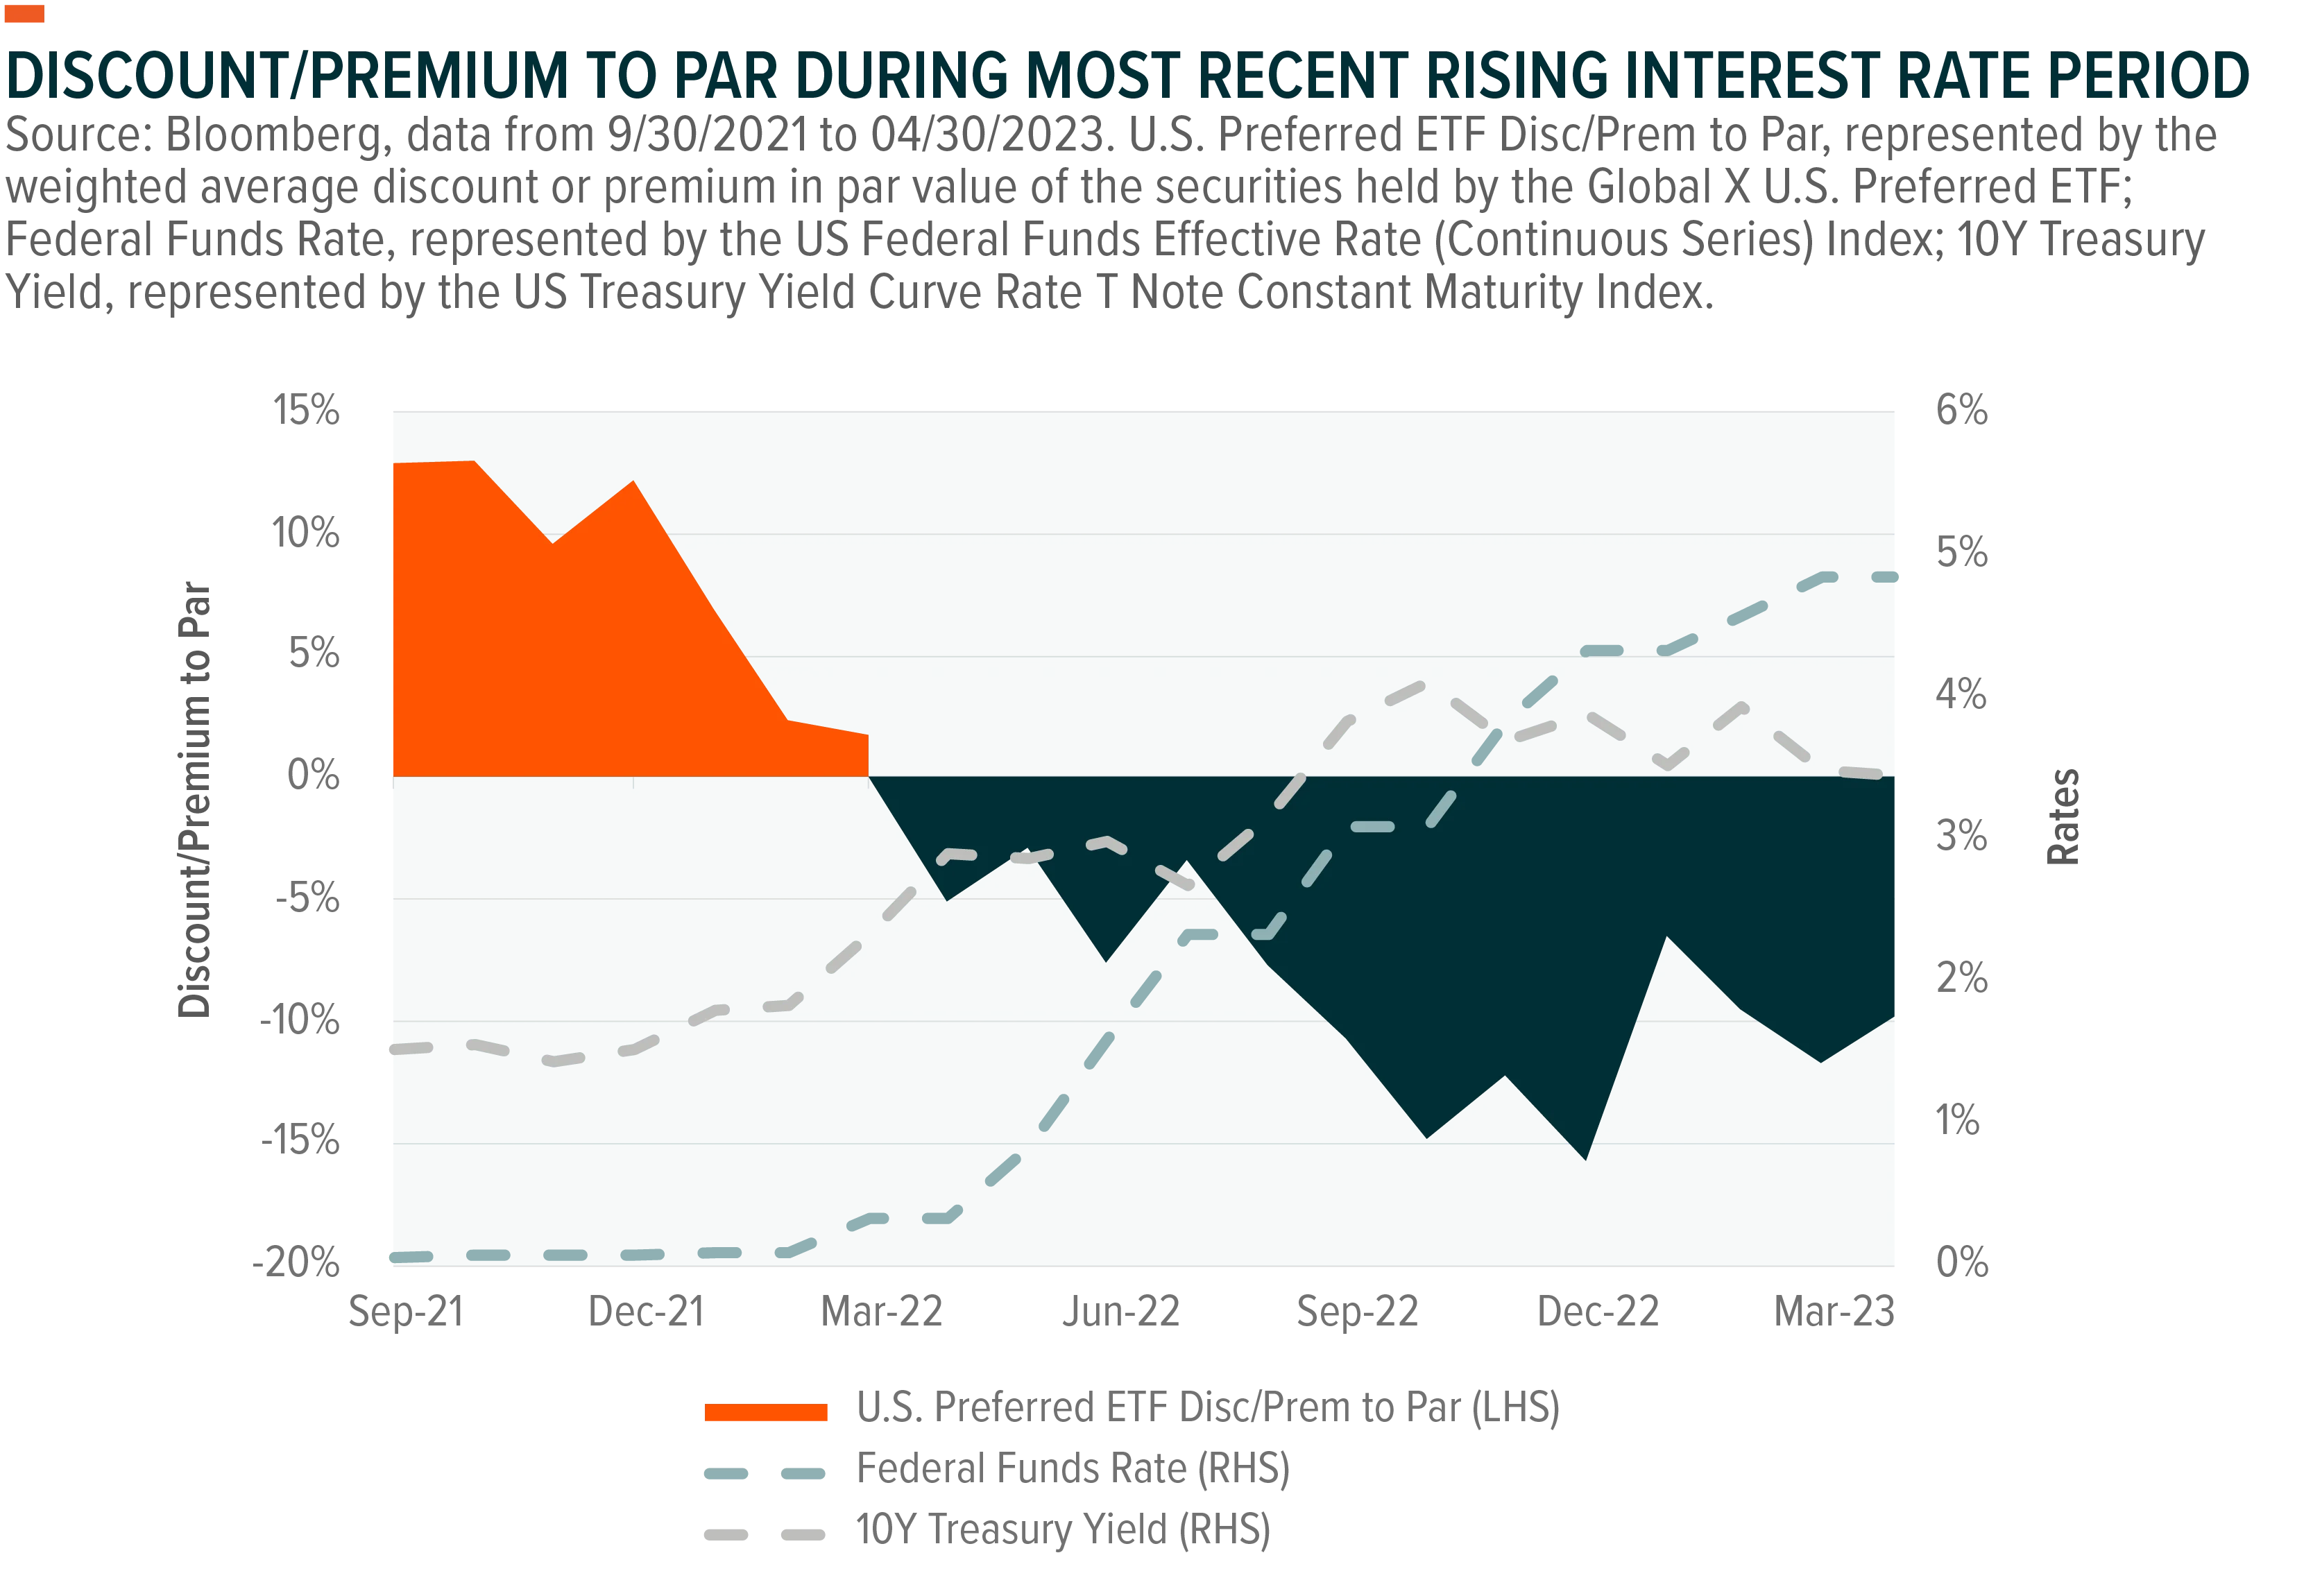
Negative performance in 2022 occurred in broad market cap-weighted preferreds, which have a larger allocation towards large U.S. banks and other entities that, by virtue of their lower risk profile, also offer lower coupon rates. All else equal, bonds with lower coupon payments tend to be more susceptible to changes in interest rates. Given that a considerable proportion of preferred securities are perpetual, with no fixed maturity date, the duration of these securities and their associated interest rate risk are further compounded.
As depicted in the chart below, the weighted average discount to par value of preferred securities in the Global X U.S. Preferred ETF reached its peak in December 2022, which coincided with a time when the Federal Funds Rate breached the 4% level. This highlights the heightened sensitivity of preferred securities to interest rate changes during periods of rising rates.
Outlook on Interest Rates
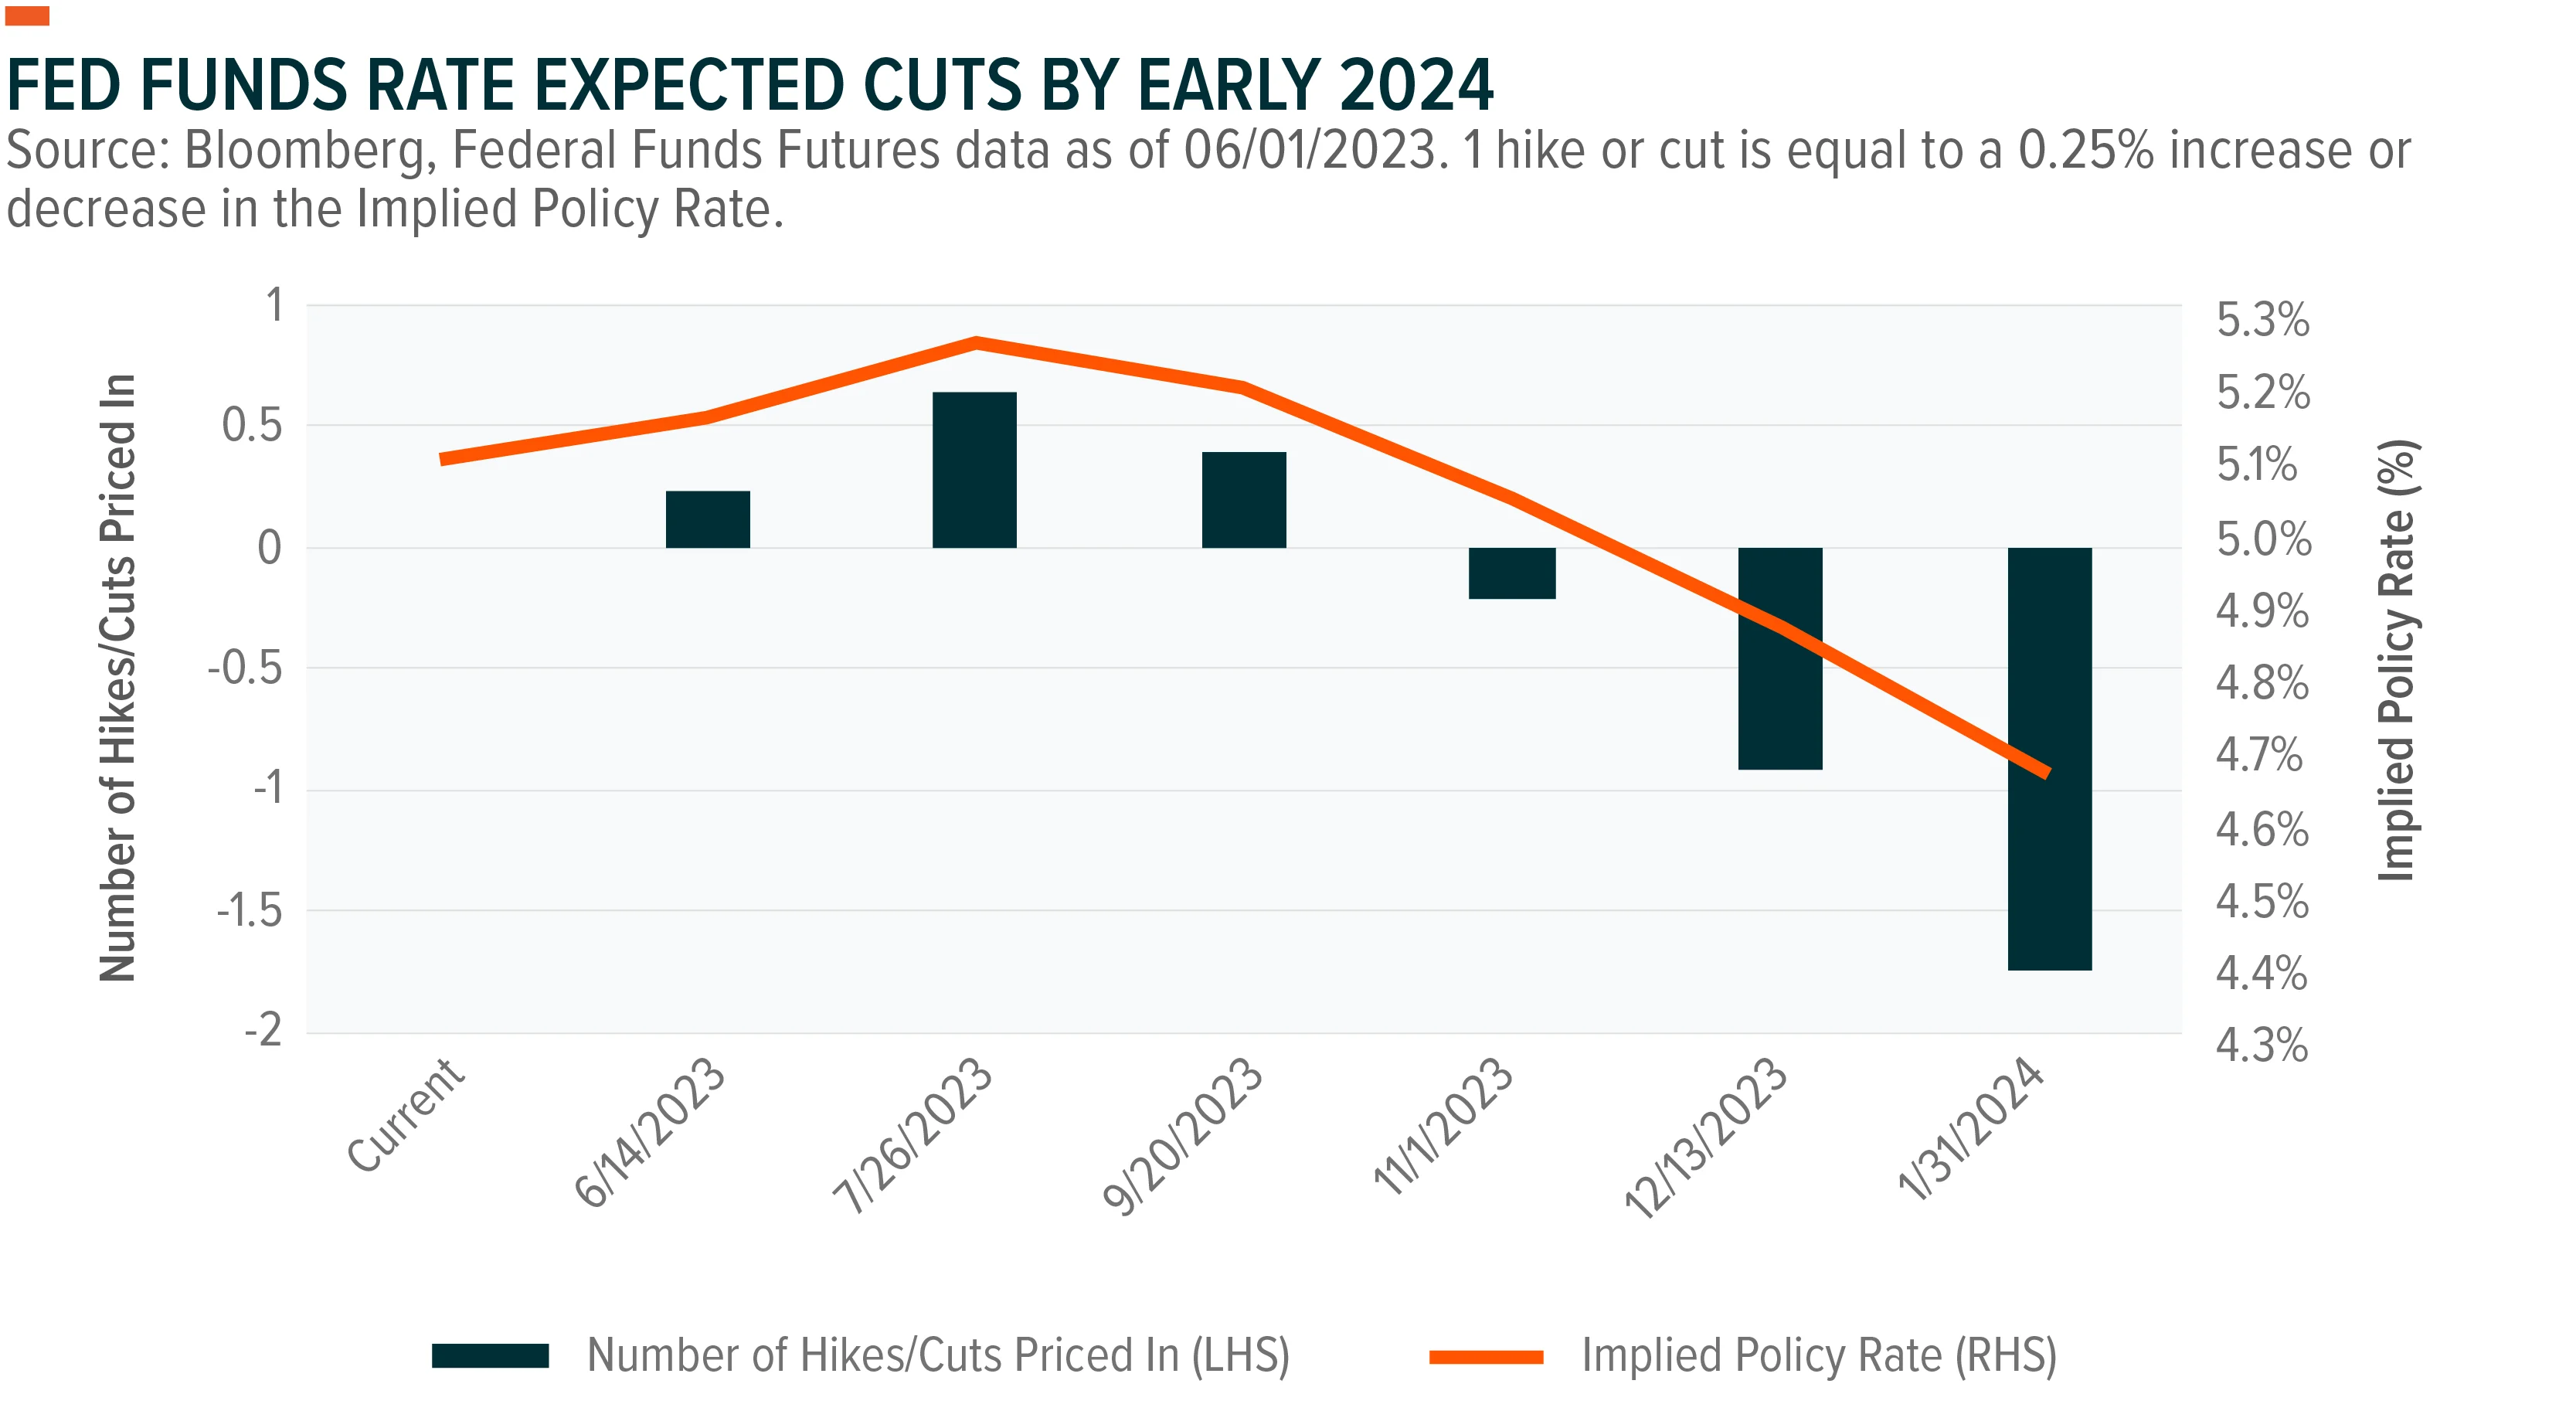
US inflation has exhibited signs of cooling, with the April Consumer Price Index (CPI) rising by 4.9% from the previous year, marking the first sub-5% reading in almost two years.9 This development has given the Federal Reserve leeway to potentially pause interest-rate increases or even consider cutting them if this trend continues. Federal funds futures markets are already anticipating between two to four 25 basis points cuts by the early onsets of 2024, as depicted in the chart below, and shows potential rate cuts starting 11/01/2023.
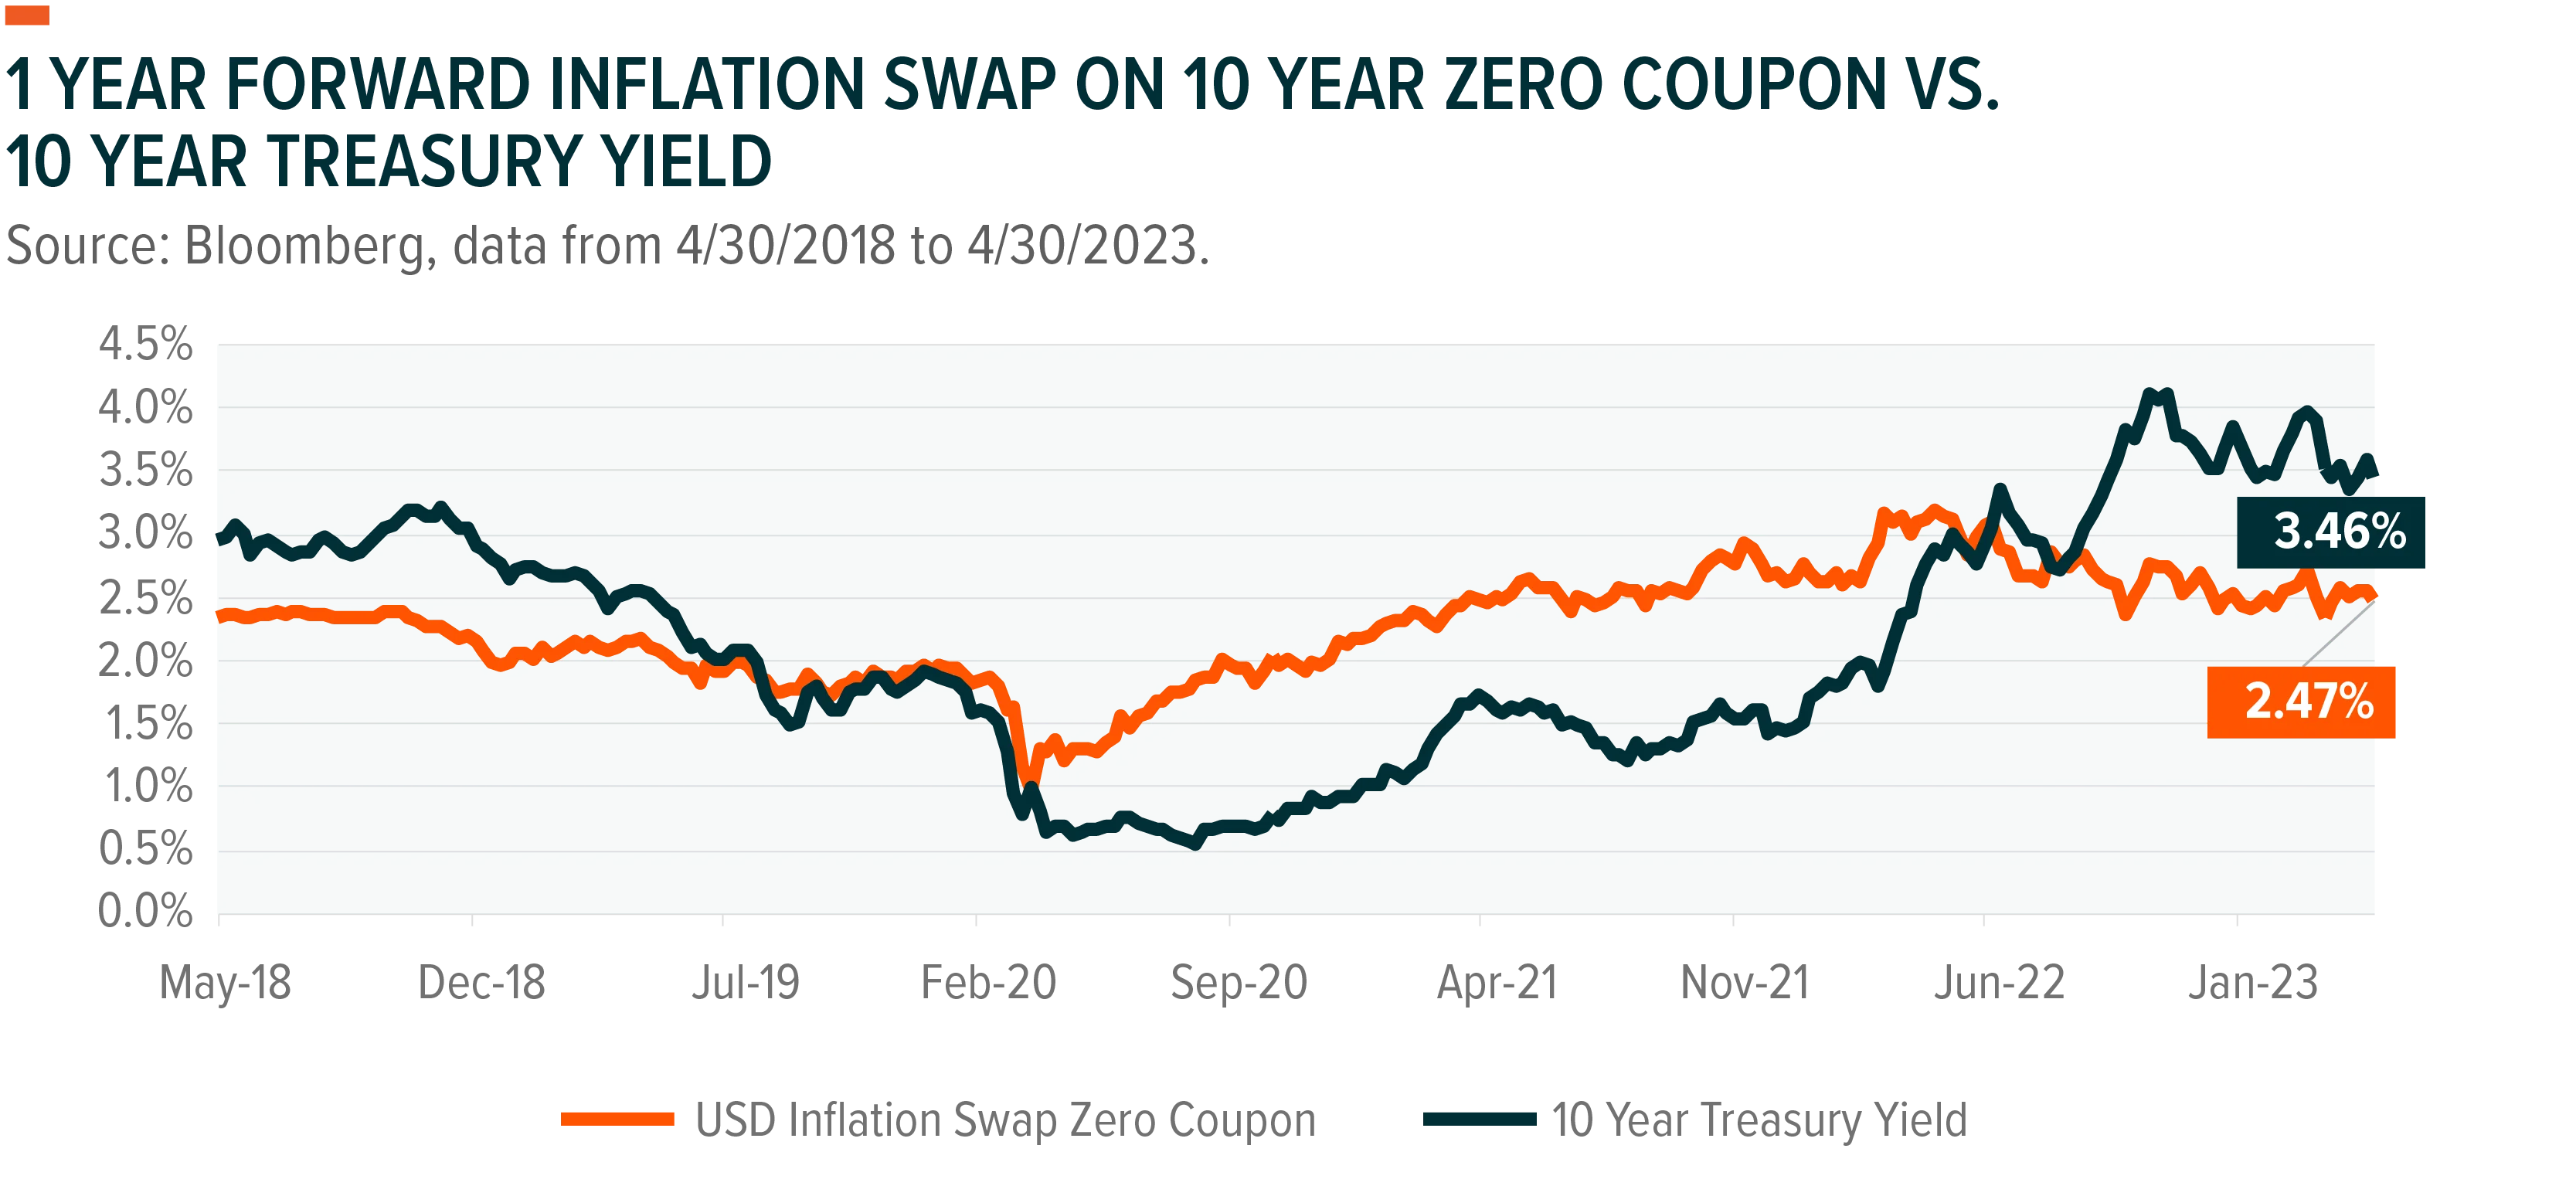
When examining the 1 Year Forward Inflation Swap 10-year Zero Coupon Index, a measurement of inflation expectations, we see a similar trend with the index currently positioned 1% lower than the 10-year treasury yield, one year in the future. The high duration aspect of preferreds should benefit if the expectations are accurate, as the Federal Reserve has made it clear that inflation is the primary driver for hiking rates. The ICE BofA Diversified Core U.S. Preferred Securities Index currently has an option-adjusted duration of 7.1 years, which shows that a 1% downward movement in interest rates should cause a 7.1% upward move in performance, keeping other variables constant, such as credit risk.10
Preferreds Issued By Large Banks Outperformed Smaller Banks
The divergent performances of preferred shares issued by different market cap buckets shows that preferreds issued by large banks have been able to withstand negative market sentiment, while smaller and less creditworthy banks have not been as fortunate. Since SVB's demise, exchange-traded preferreds by banks with a market capitalization of under $10 billion have experienced an average decline of over -17%. In contrast, preferred shares issued by large banks such as Bank of America, Morgan Stanley, and Goldman Sachs have demonstrated a modest gain of almost +0.4% over the same period.
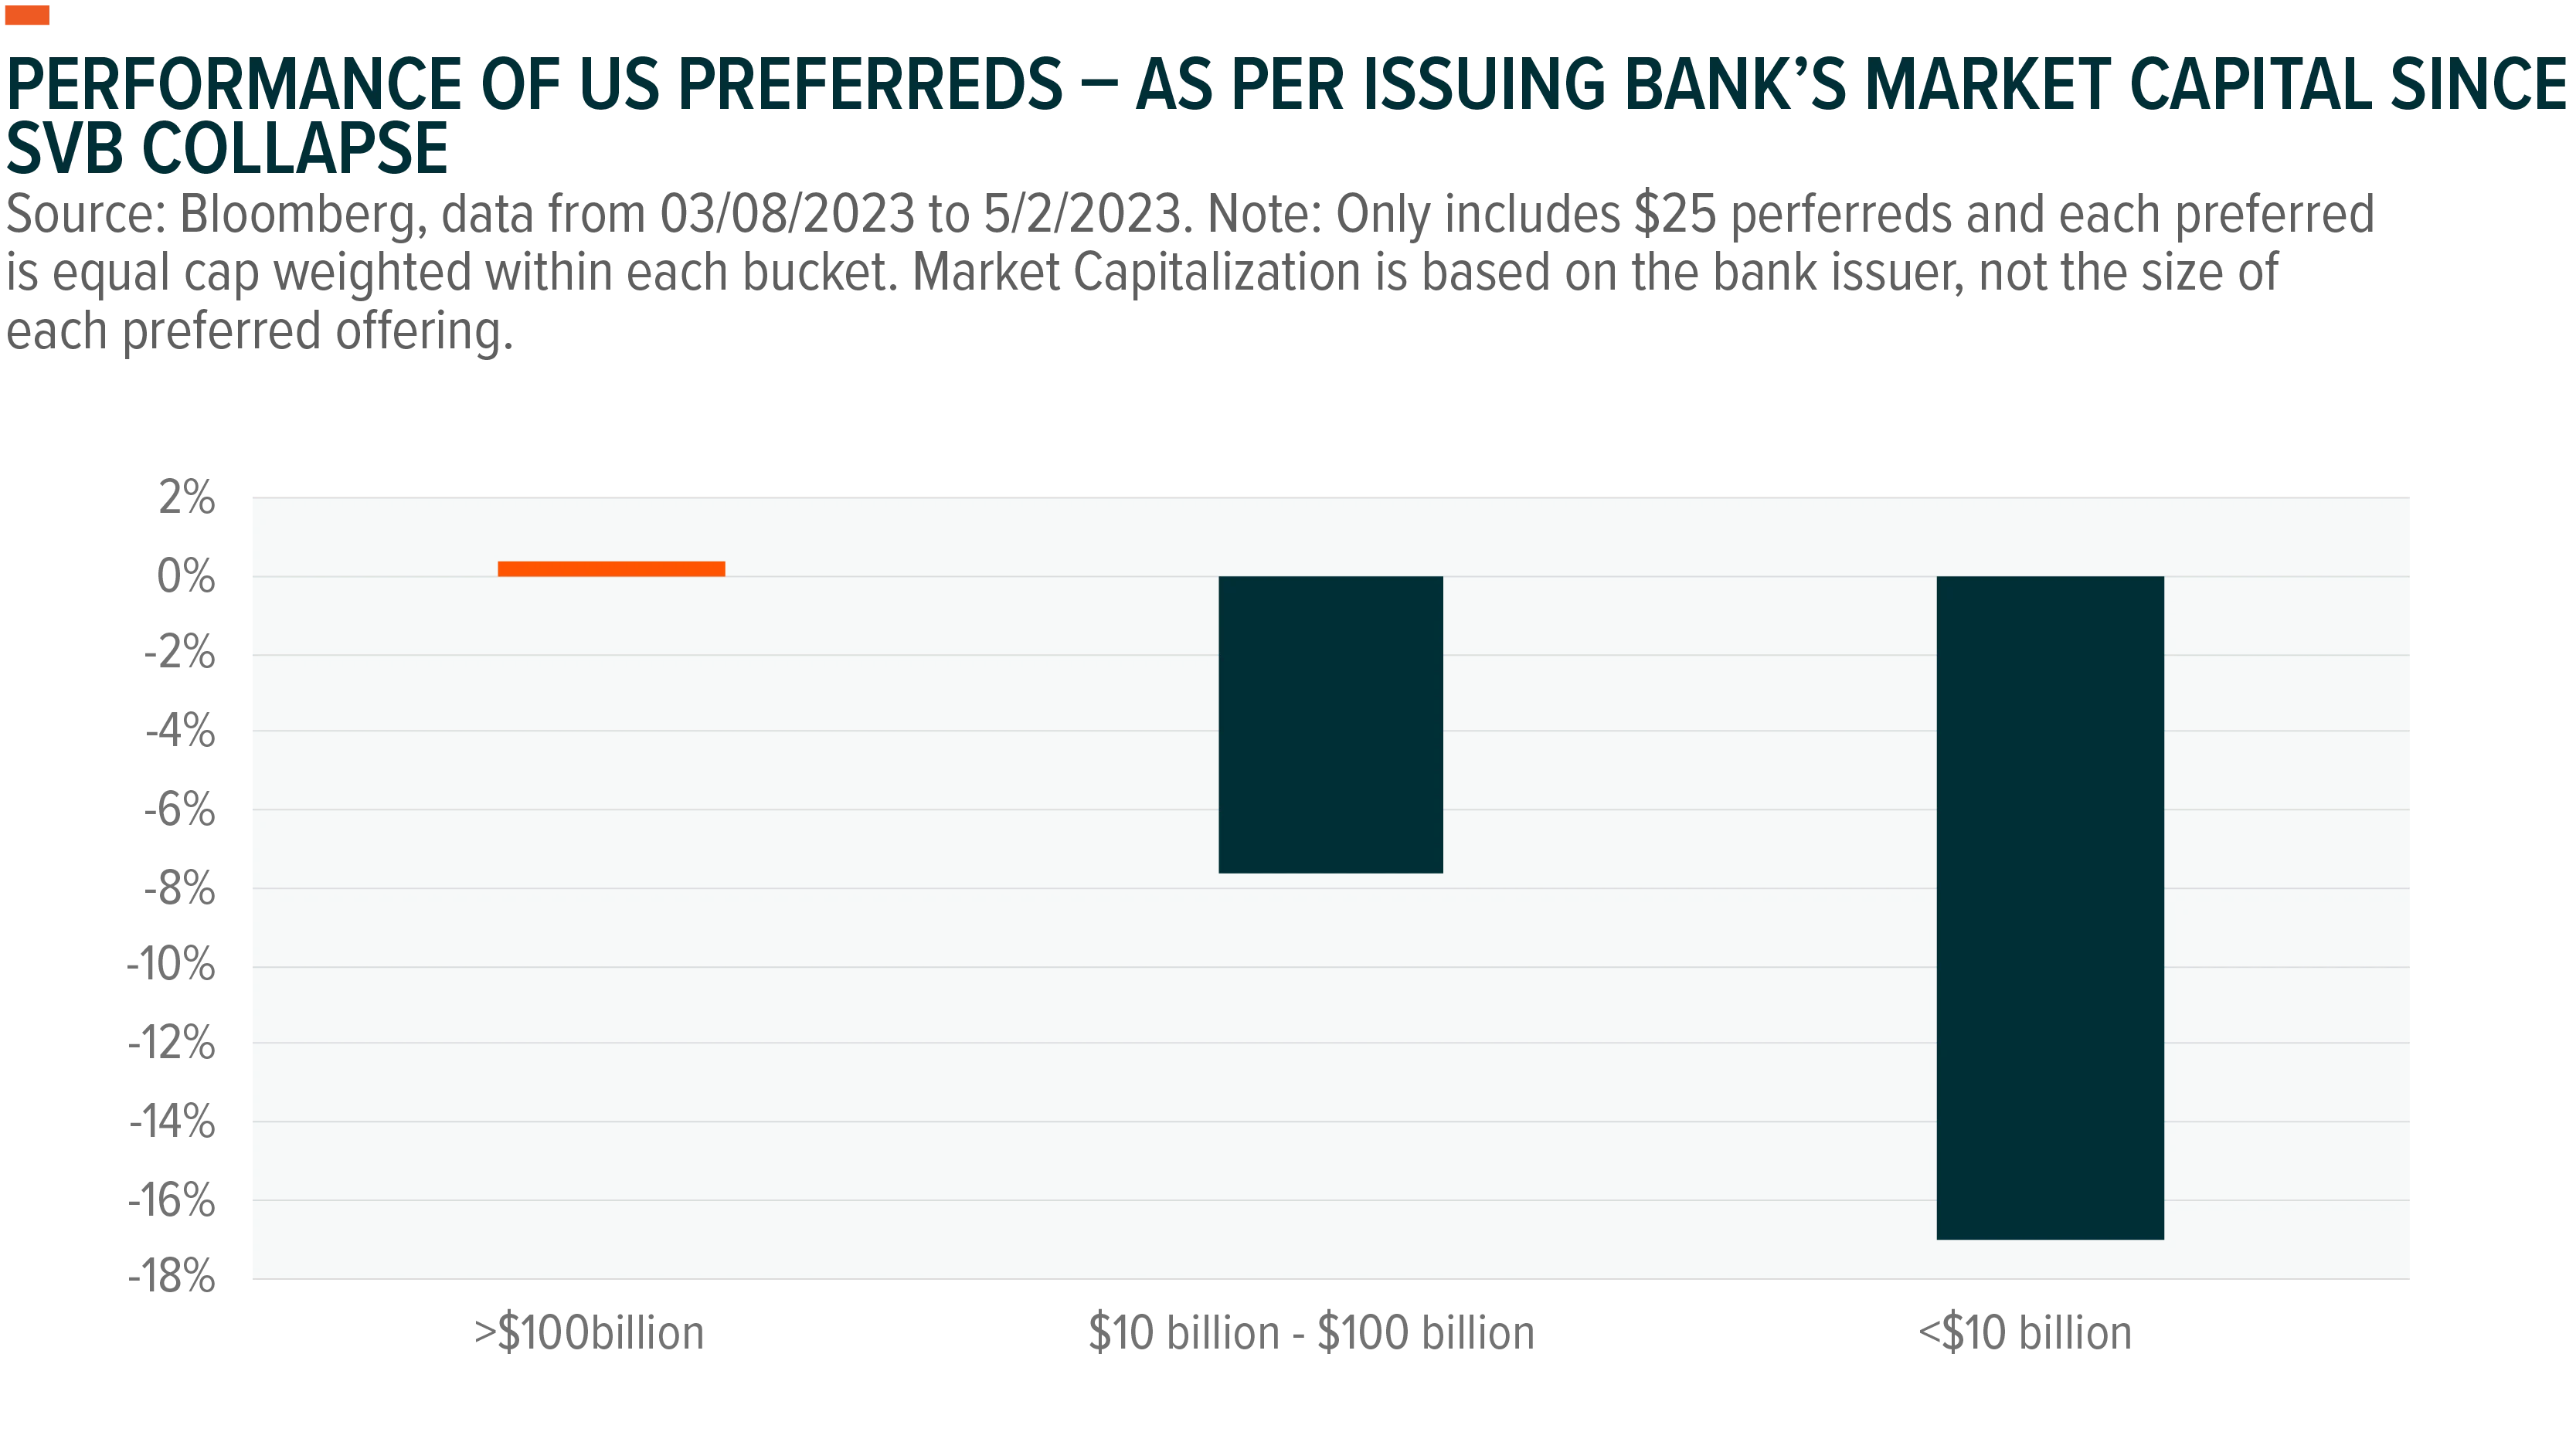
It is worth noting that small cap banks, heavily represented by regional banks that have targeted affluent clients and extended a considerable volume of loans during the period of zero-bound interest rates amid the pandemic, have exhibited prominent levels of unsecured deposits and possess loan portfolios that are more sensitive to interest rate changes. These banks have experienced a more pronounced deterioration in their performance, with PacWest Bancorp being one example, as its year-to-date (YTD) decline exceeded -70% as of May 15, 2023. To bolster its financial position, PacWest Bancorp has announced plans to divest $2.7 billion worth of assets while simultaneously exploring options for potential partners and investors.11
Understanding the Performance of Regional Banks
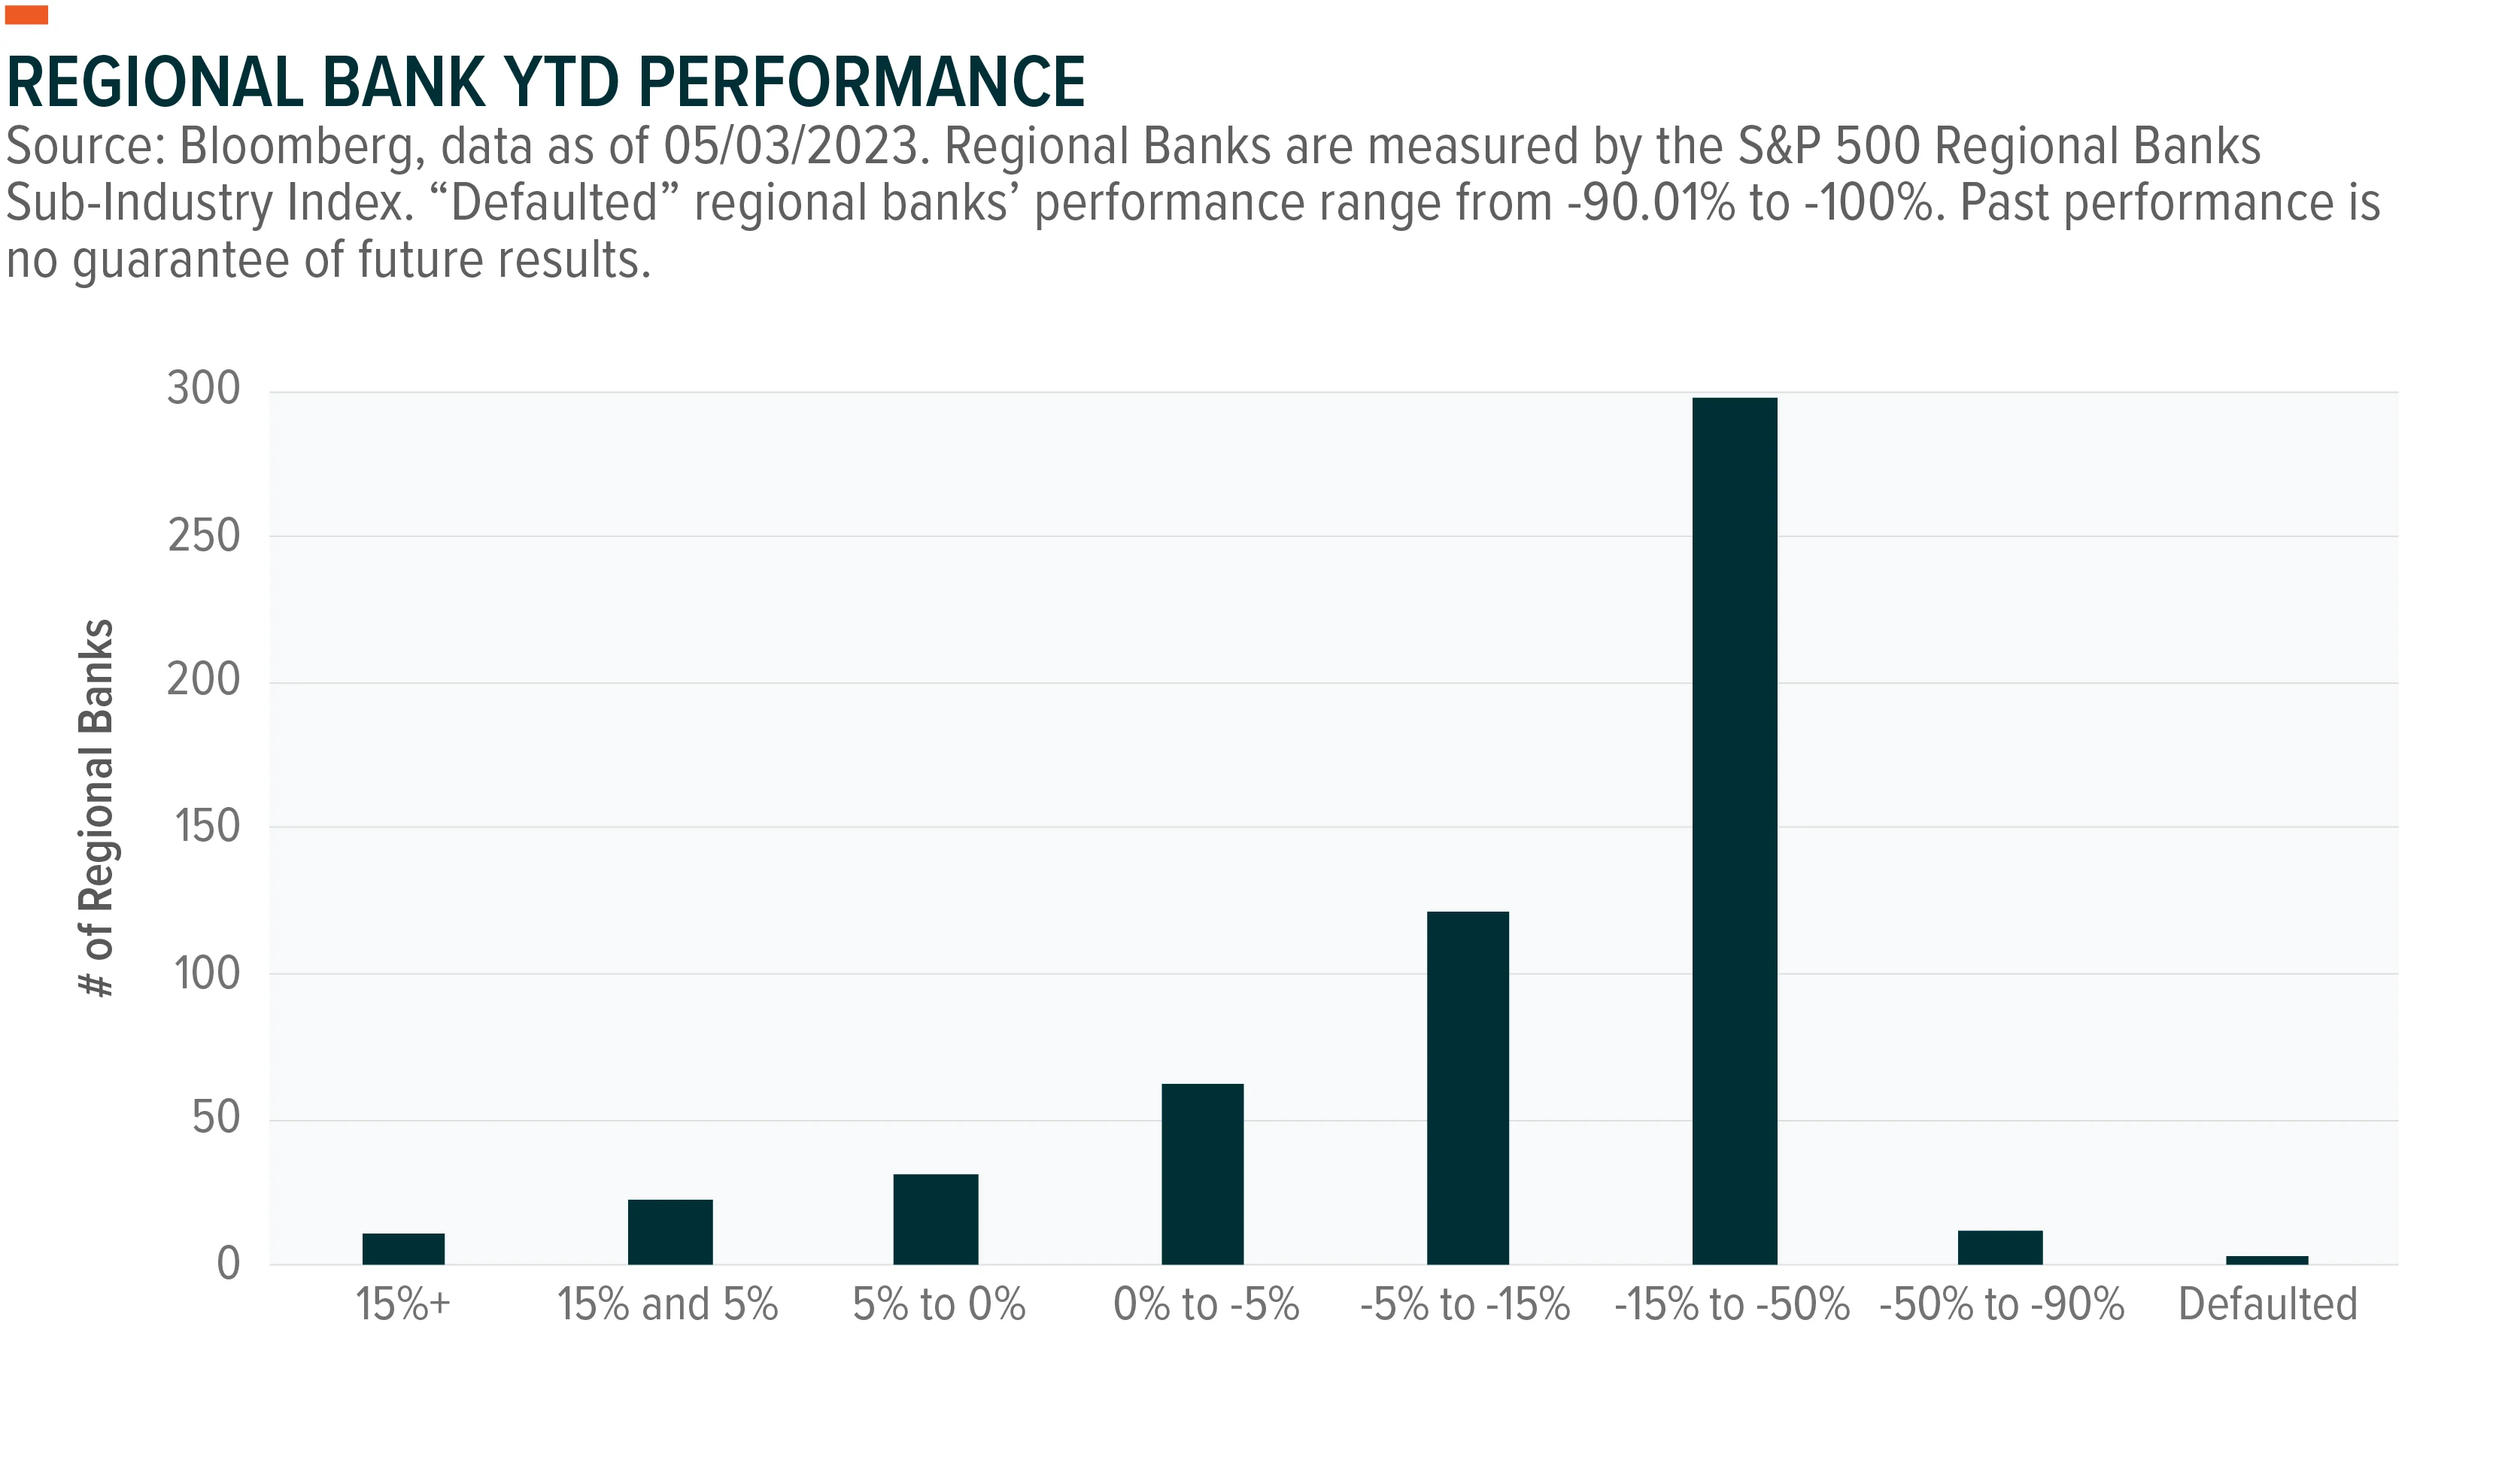
The YTD performance of regional banks shows a left-skewed distribution, with a significant amount of these banks experiencing declines ranging from -15% to -50%. The mean YTD decline for regional banks was -17%. In contrast, diversified banks found within the S&P 500 have had a relatively muted YTD decline, amounting to -2.27%.12
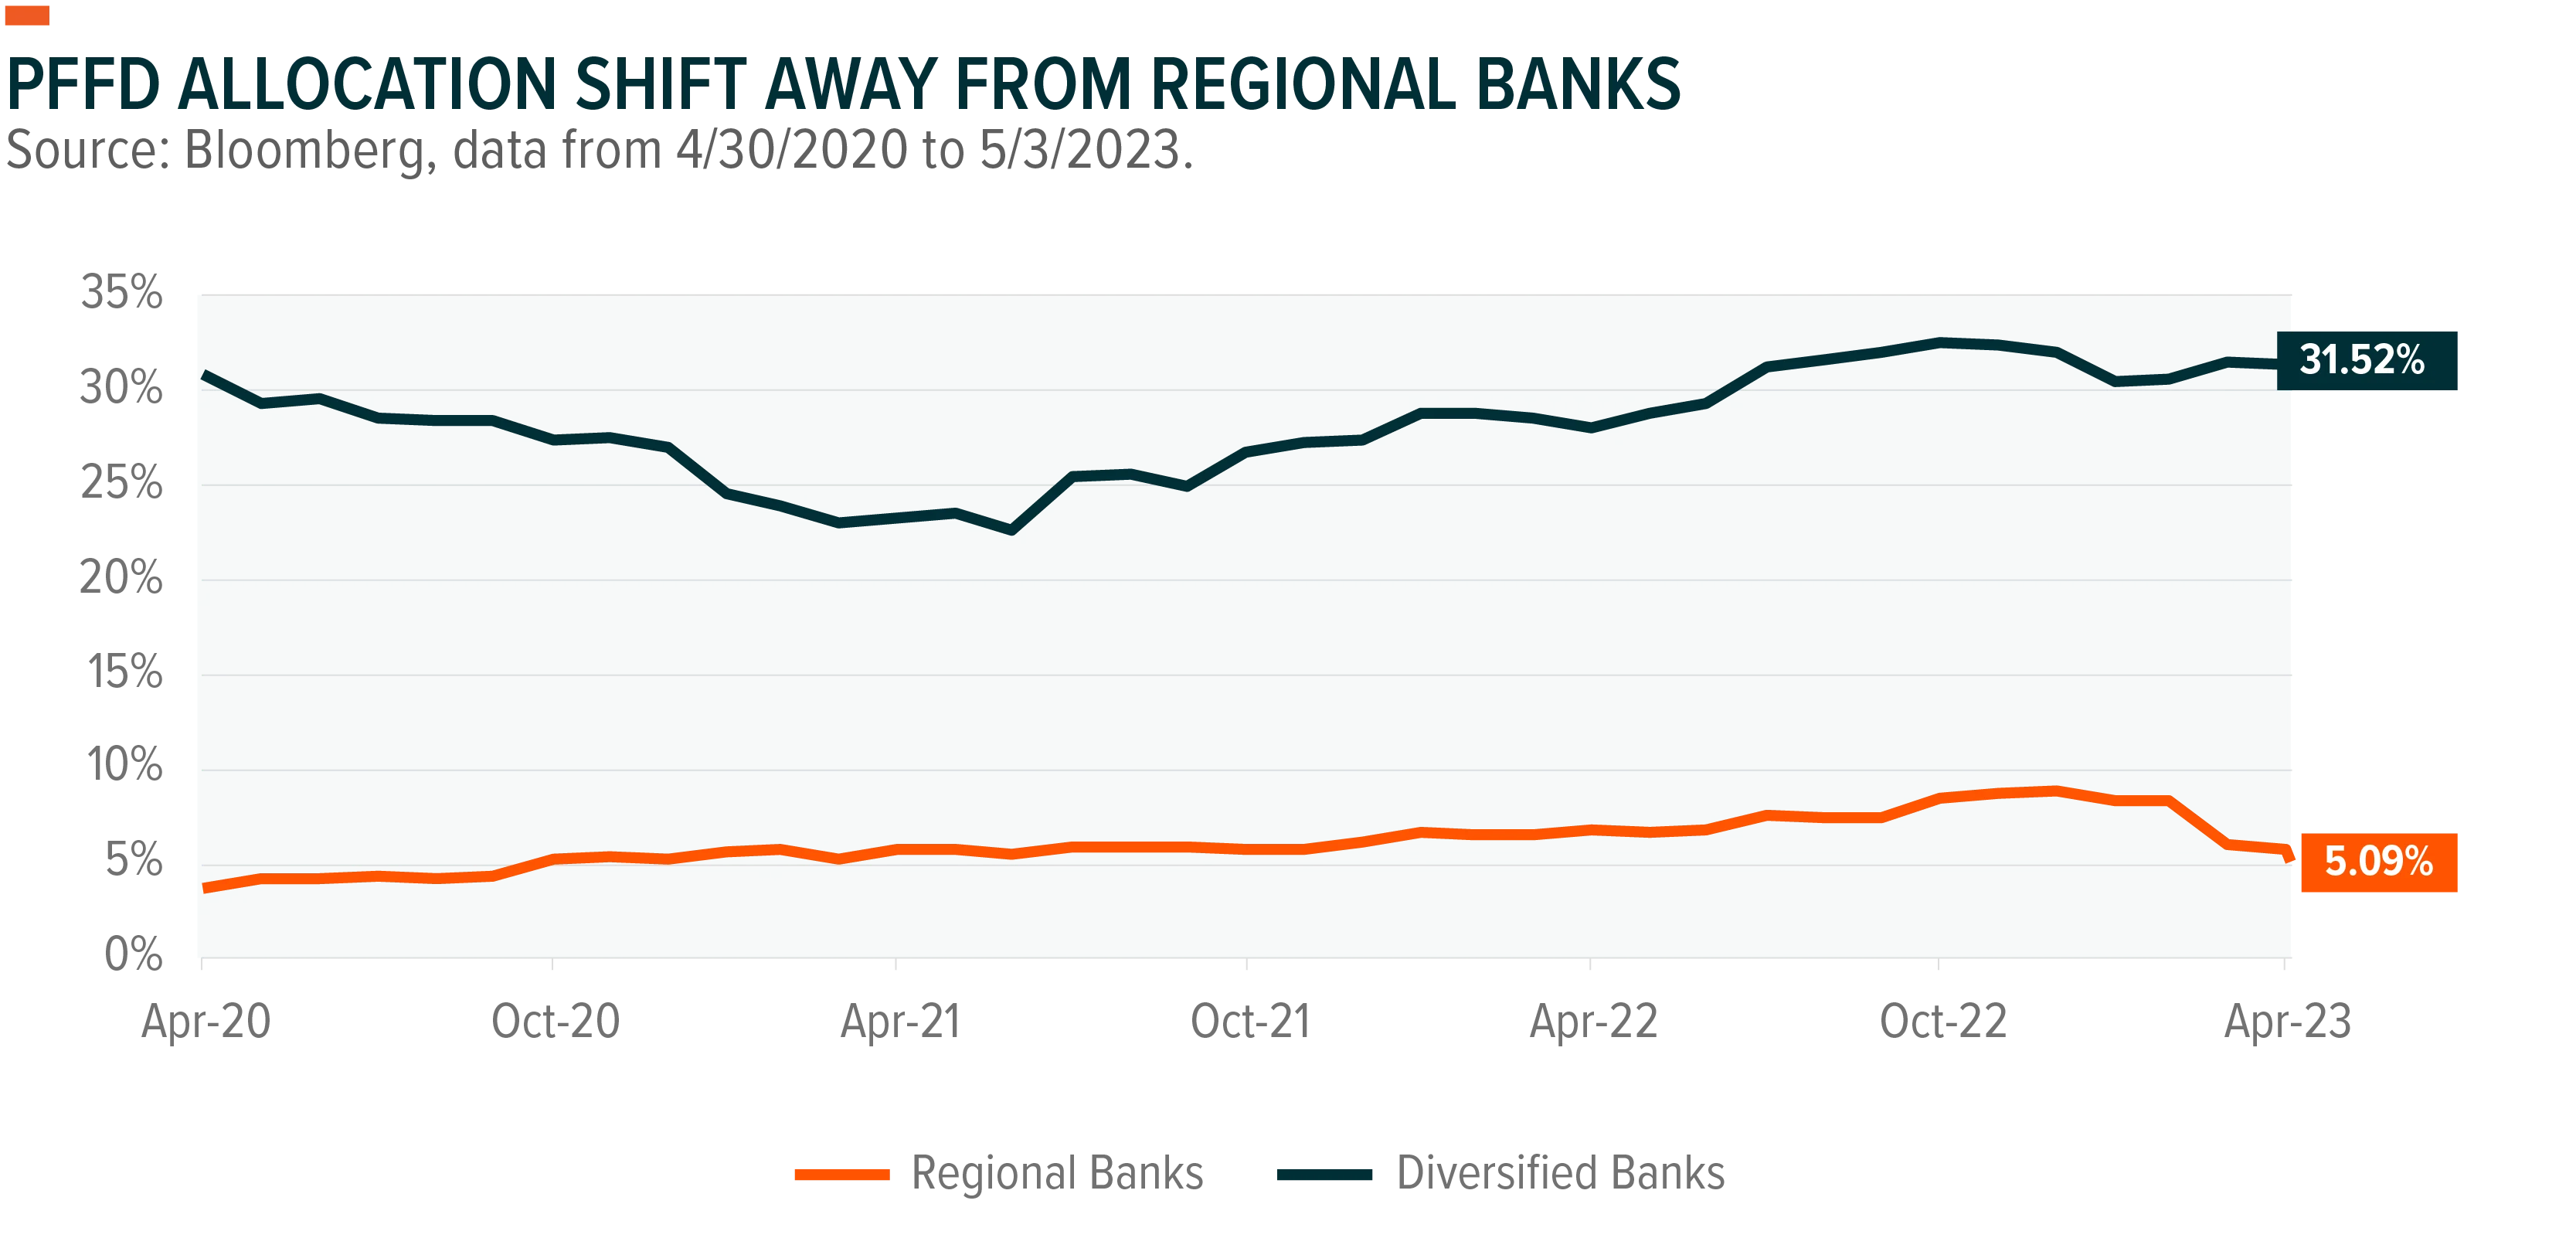
Low Level of Contagion Risk within PFFD
The current investment climate has led investors to seek out “safer” banking alternatives, resulting in a divergence in performance between large US banks and their regional counterparts. While elevated rates and deposit outflows may potentially disadvantage regional bank investors, the market-capitalization weighted structure of the index tracked by the Global X U.S. Preferred ETF (PFFD) has resulted in a gradual reduction in exposure to regional banks and an increase in allocation towards diversified banks. With a weight of 32% in diversified banks and only 5% in regional banks, PFFD has the potential to largely mitigate the overall impact of potential bank runs from small and mid-cap regional banks.
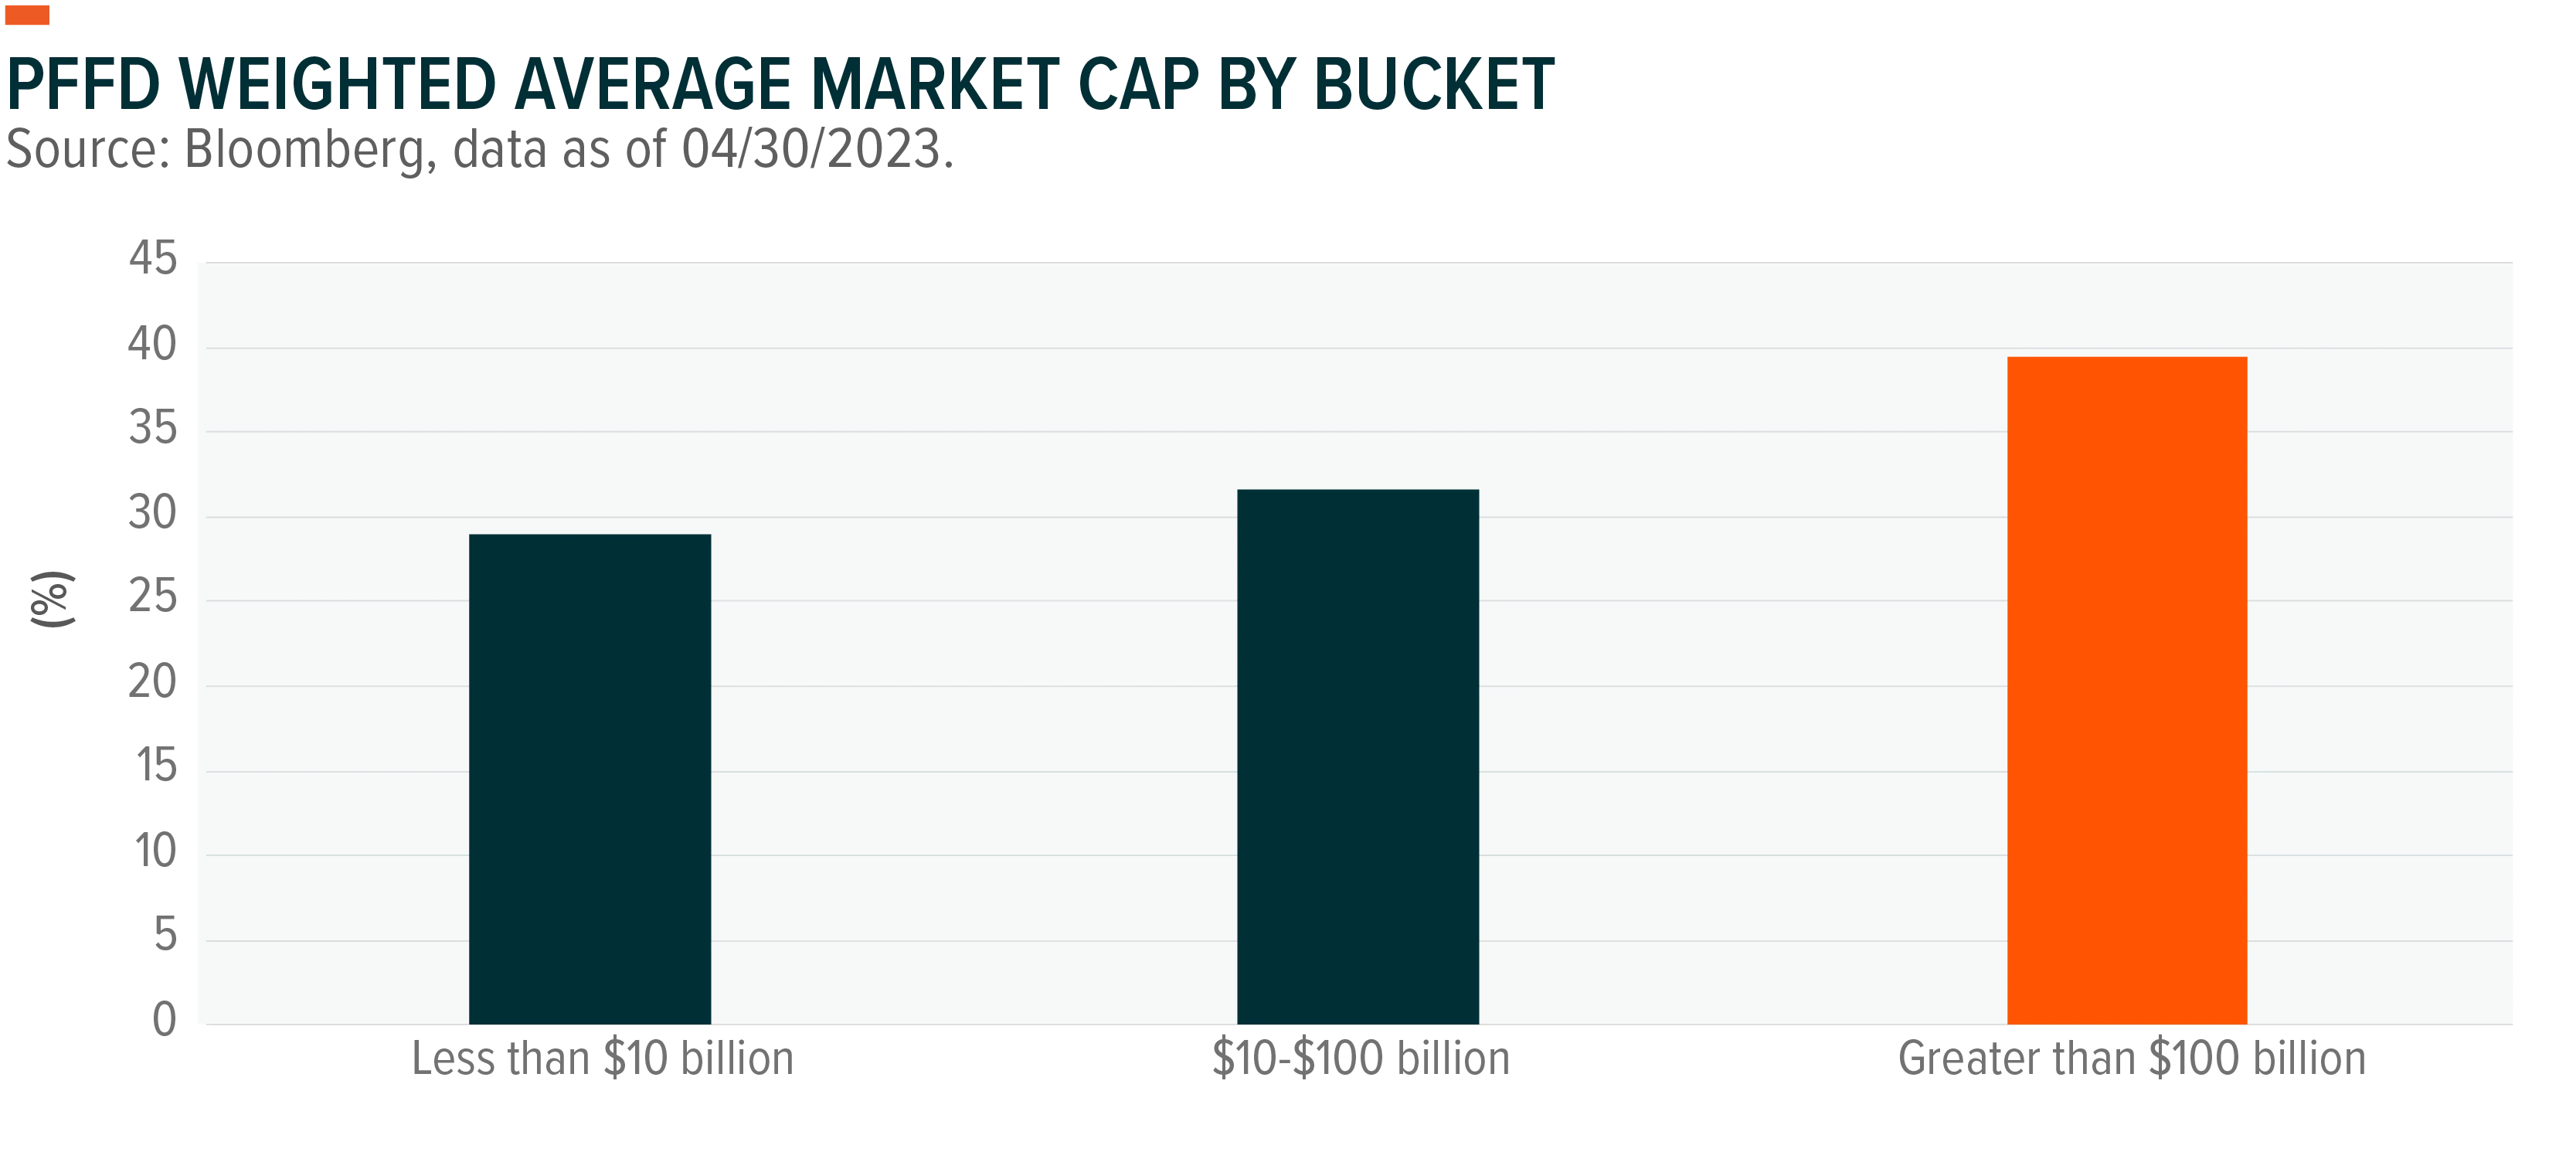
Weighted Average Market Cap by Size Buckets
The Global X U.S. Preferred ETF provides investors with a diversified opportunity to invest in preferred securities issued by institutions across the market capitalization range. When analyzing the portfolio weights, the fund holds 39.45% of its assets in preferred securities issued by institutions with a market cap greater than $100 billion, 31.61% in preferred securities issued by institutions with a market cap ranging from $10 billion to $100 billion, and the remaining 28.9% in preferred securities issued by comparatively smaller institutions with a market cap of less than $10 billion. The overall allocation towards preferred issued by larger institutions is reinforced by the weighted average market cap of issuers found in PFFD, which stands at $110 billion.13
As discussed above, the significant presence of big banks within PFFD, forming a sizable proportion of its assets, has resulted in better-than-expected performance. This may continue to contribute positively to the fund's returns, particularly if we see a continuation of regional bank contagion and investors migrate towards larger banks that are perceived to be less risky. On the other hand, the fund may also offer diversification benefits by investing a decent proportion of its assets in preferred securities issued by comparatively smaller institutions. Overall, PFFD offers a balanced investment approach with a goal to generate regular income from preferred stocks.
PFFD Overweight G-SIBs and Large Cap Issuers
PFFD's exposure towards large banks is evident not only in its allocation towards diversified and large-cap issuers but also in its exposure to G-SIBs, which are widely perceived as "too big to fail." PFFD holds preferreds issued by the four largest U.S. banks, by deposits, and whom are also classified as G-SIBs. PFFD has currently allocated 30% of its portfolio weight to their preferred shares as of 04/30/2023. These banks have demonstrated resilience in the face of market volatility and we believe possess the resources to hedge interest rate risks, which could benefit PFFD if rates remain elevated for an extended period.
The pie chart below demonstrates the current allocation of PFFD, highlighting its substantial weighting towards diversified banks, along with a well-diversified distribution across various industries and sub-industries within the broader financial ecosystem.
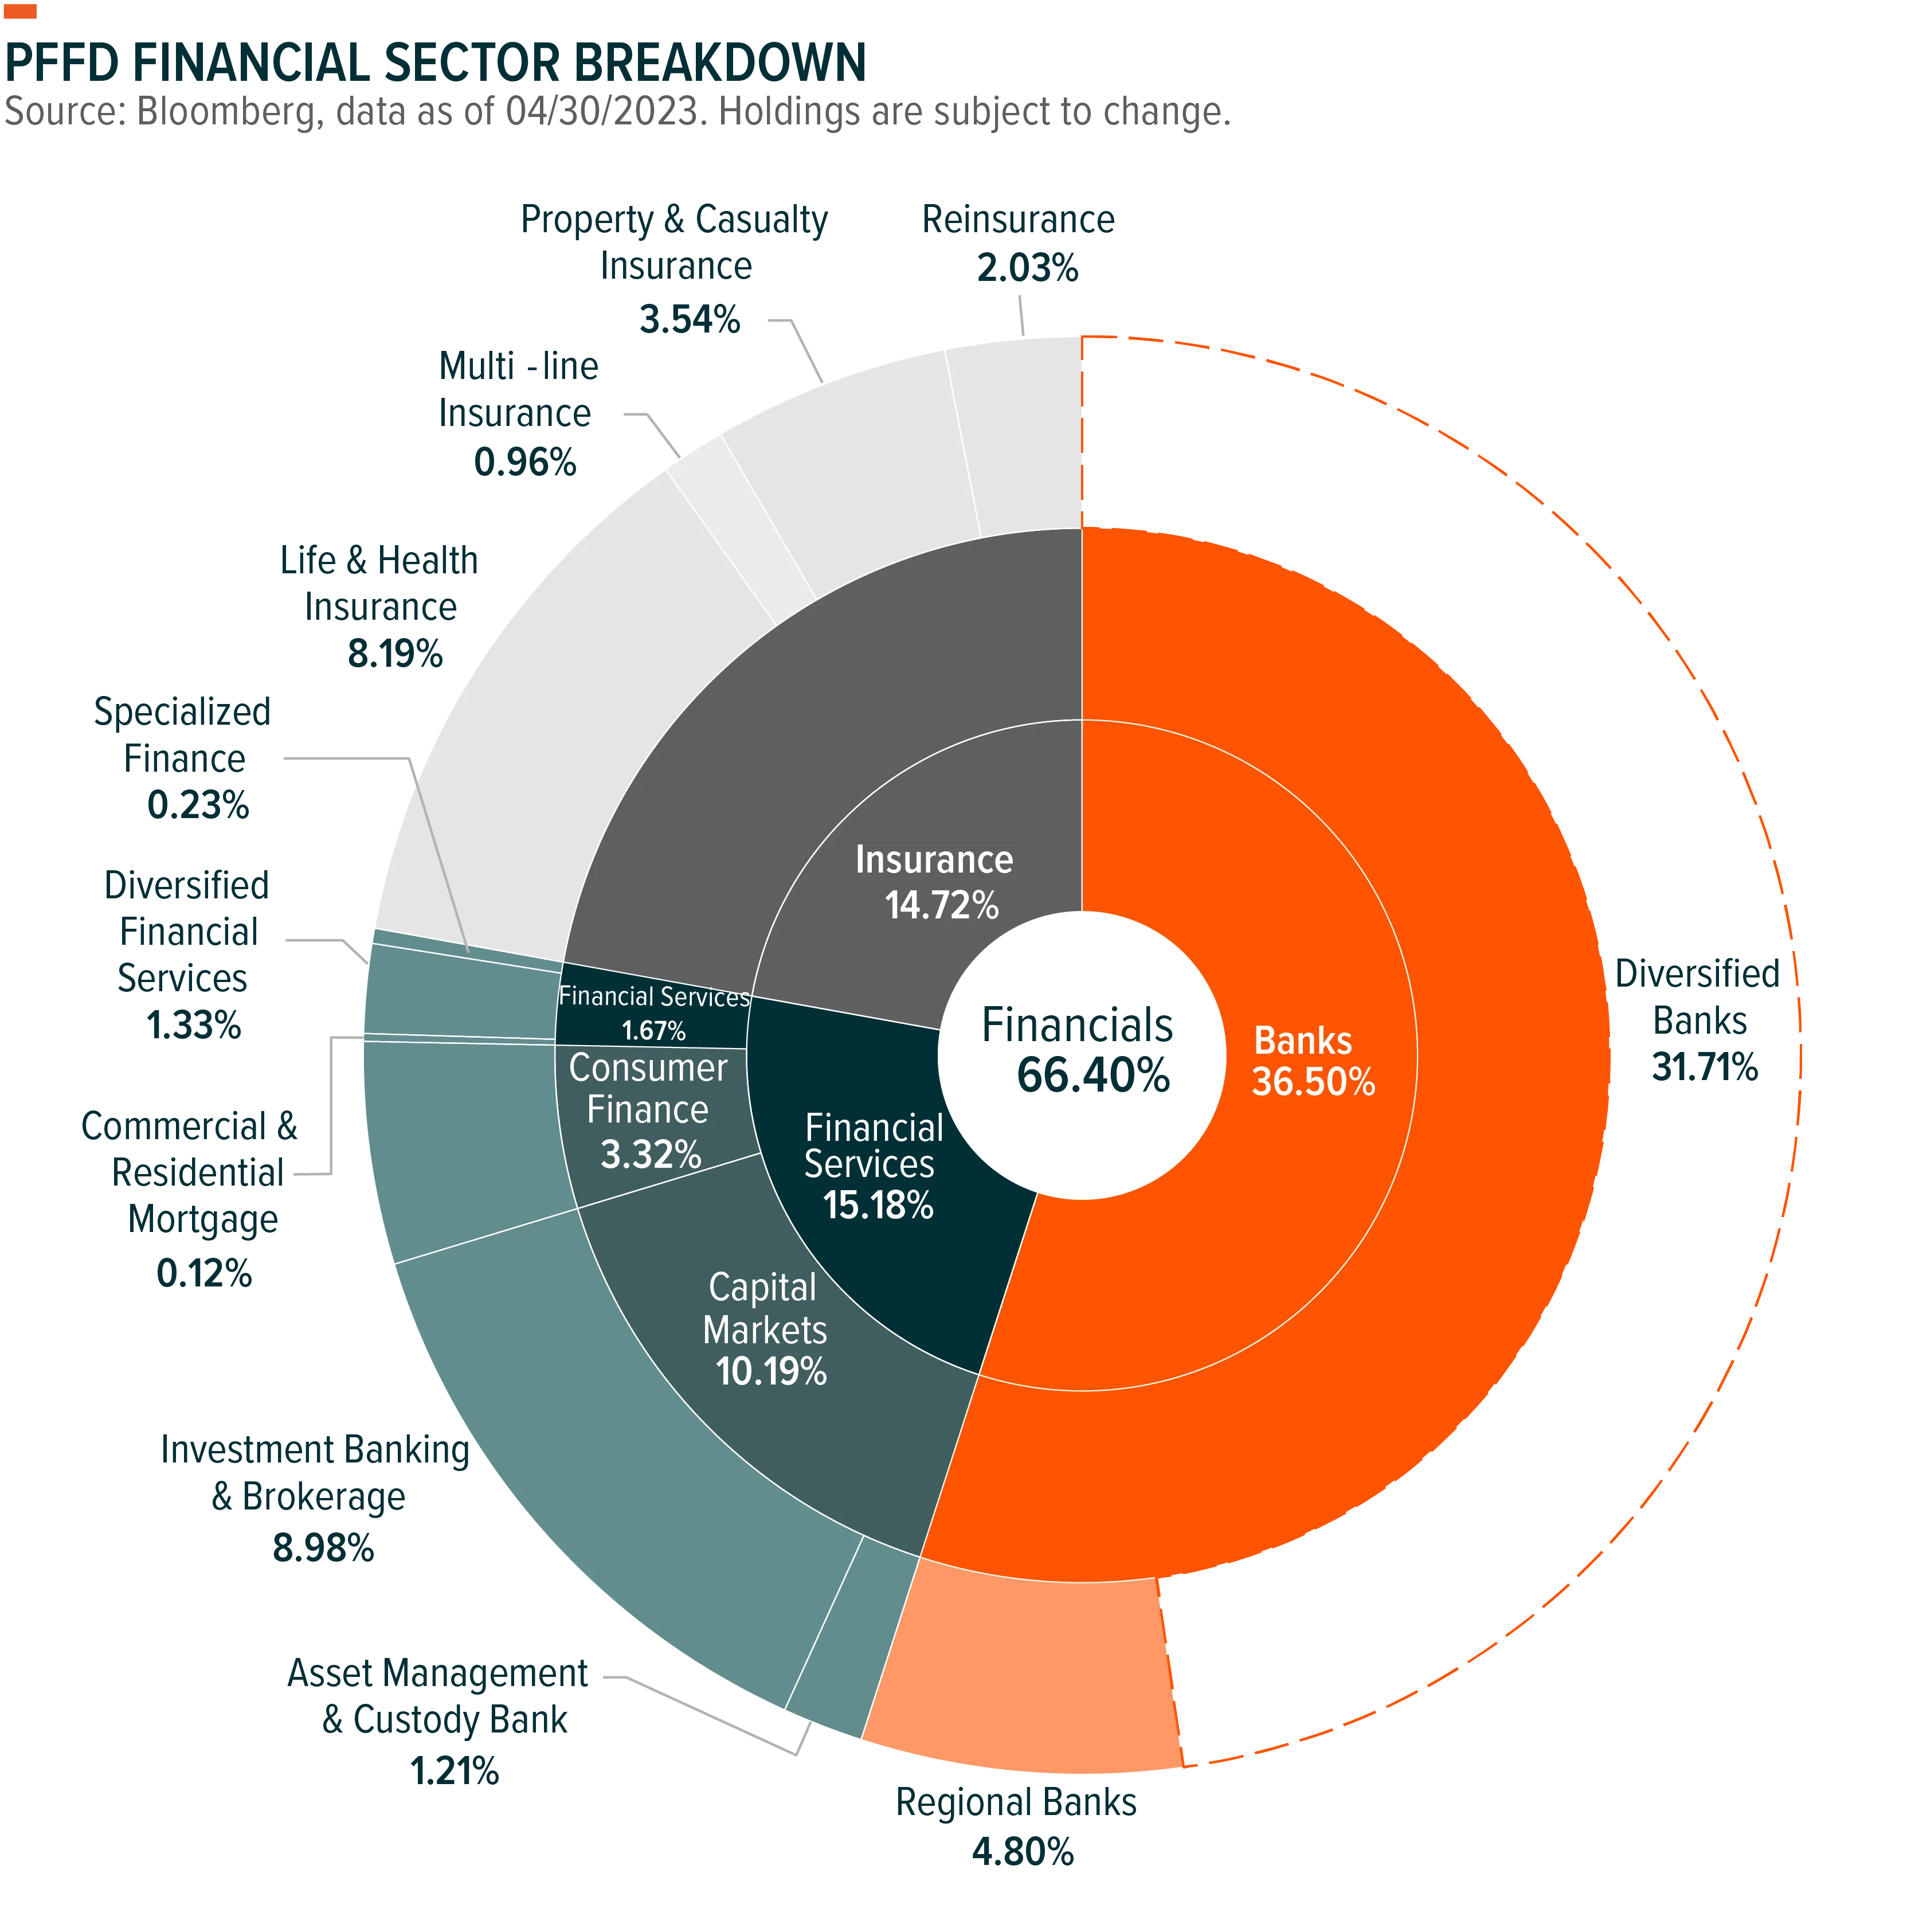
In addition to its allocation towards the major US G-SIBs, PFFD also holds well-capitalized banks, such as Morgan Stanley and Goldman Sachs. The strategy's allocation towards large-cap issuers extends beyond the banking sector, with PFFD holding a diverse range of preferred issuers, including AT&T for exposure to the telecommunications sector and Public Storage in the self-storage space.
Conclusion
Amidst an uncertain landscape for regional banks, large and diversified banks have been able to capitalize on the “flight to safety” mentality within the banking sector. These same banks, which are often the largest issuers of preferred securities, have maintained a higher weighting in PFFD, relative to regional banks, due to the underlying index’s market-cap weighted approach. We believe the fund’s exposure to these more diversified banks is rapidly transitioning from a headwind to a tailwind as the focus shifts from interest risk to credit risk. The passive nature of the strategy has also mitigated unsystematic risk by placing significant emphasis on the overall portfolio rather than the portfolio managers taking on overweight exposure towards individual issuer. In this uncertain future, we believe that preferred securities offer an alternative for income-seeking investors while potentially benefiting from a potential decrease in interest rates.
Related ETFs
PFFD – Global X U.S. Preferred ETF
PFFV – Global X Variable Rate Preferred ETF
SPFF – Global X SuperIncome® Preferred ETF
Click the fund name above to view current performance and holdings. Holdings are subject to change. Current and future holdings are subject to risk.