 Global X Research Team
Back in late-April, Congress struck a short-term budget deal, postponing the debate over whether to raise the debt ceiling for five months.1 Eyes now turn to September, when congressional leaders will be forced to revisit this issue alongside other legislative priorities. In addition to the complications posed by healthcare and tax reform, the next budget negotiation could also face opposition among House members seeking to tie a relaxing of the debt limit to off-setting spending reforms.2
In anticipation of a possible Fall debt-showdown, we looked at the performance of various asset classes for the one month period preceding the last two contentious debt ceiling negotiations in 2011 and 2013.
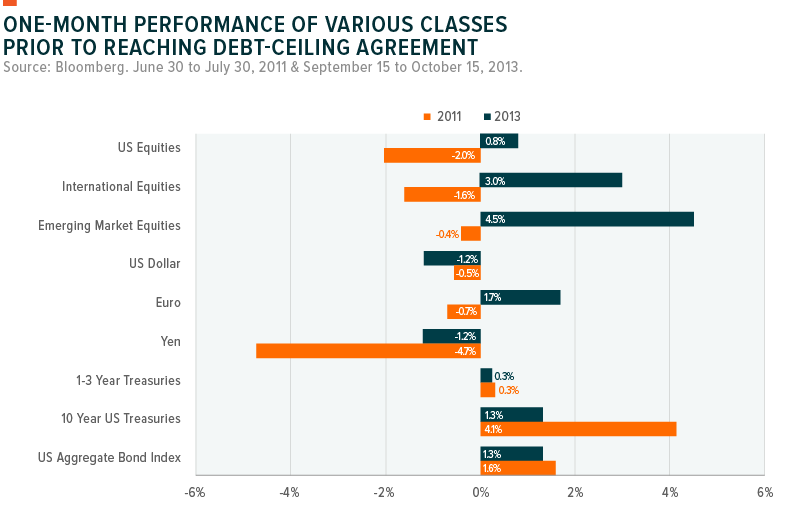
As depicted in the chart above, equity asset classes responded quite differently in 2011 and 2013. Stocks around the globe sold off in 2011 as the macro backdrop was quite negative. At the time, S&P announced it was considering a downgrade of the U.S.’s credit rating and Europe was in the midst of its own debt crisis due to the unsustainable debts of European periphery countries. By contrast, the U.S. and European economies were on the mend by 2013, and the S&P 500 went on to have its best performance in the last 20 years.
The bond and currency markets showed more consistent reactions in both debt ceiling crises. Treasury and corporate bonds with maturities longer than one year rallied as investors fled to lower risk asset classes and believed that longer term obligations would still be met. The dollar mildly declined in both instances. Not pictured in the chart above (due to scale) are shorter term treasuries, like the 3-month treasury bill which saw yields skyrocket up 800% in 2011 and 900% in 2013 as fears over missed repayments soared.3
While the Trump administration has consistently defied conventional wisdom, and the diverging examples of the last two debt ceiling standoffs suggest an uncertain path forward, the current fundamentals of the U.S. economy more closely resemble 2013 than 2011.