 Global X Research Team
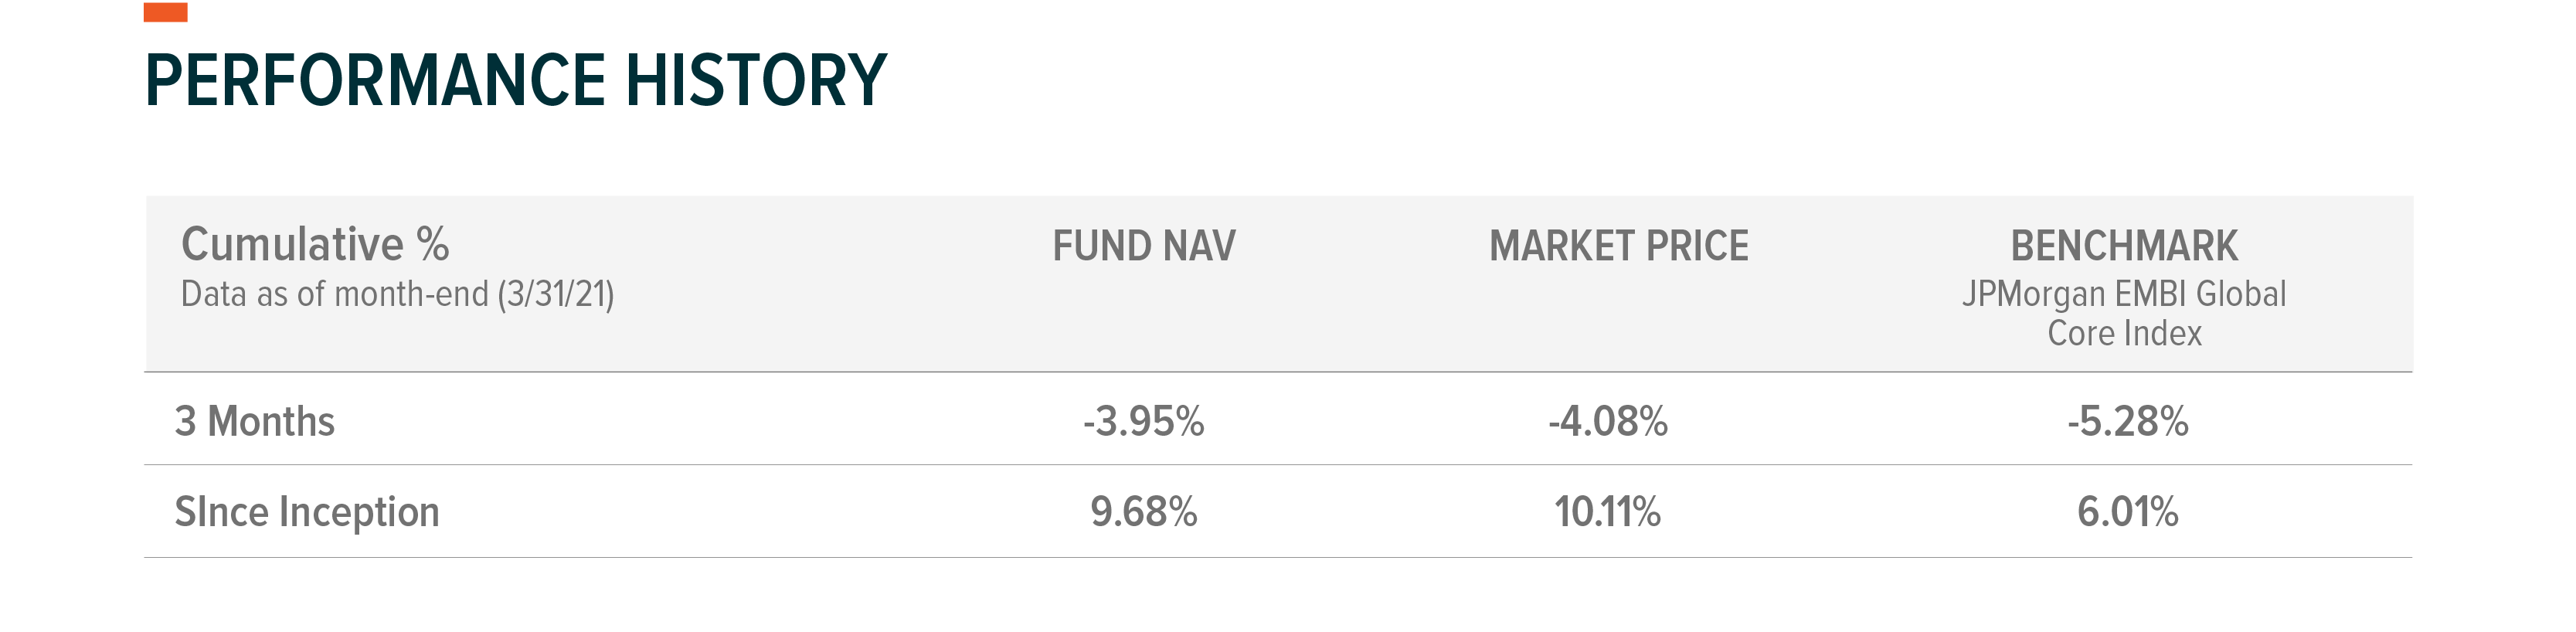
For the period December 31, 2020 to March 31, 2021, the Global X Emerging Markets Bond ETF (EMBD), sub-advised and actively managed by Mirae Asset Global Investments (USA) LLC, posted a loss of -3.95% (including dividends). This compares to a loss of -5.28% for the fund’s benchmark, the JP Morgan EMBI Global Core Index, over the same period. The benchmark index tracks liquid, US dollar emerging market (EM) fixed and floating-rate debt instruments issued by sovereign and quasi-sovereign entities.
The performance data quoted represents past performance and does not guarantee future results. Investment return and principal value of an investment will fluctuate so that an investor’s shares, when sold or redeemed, may be worth more or less than their original cost. Current performance may be higher or lower than the performance quoted. For performance data current to the most recent month end, please click here. Total Expense ratio: 0.39%.
Cumulative return is the aggregate amount that an investment has gained or lost over time. Annualized return is the average return gained or lost by an investment each year over a given time period.
General Market Review
Sentiment towards risk assets started 2021 on a positive note as new information about the efficacy of coronavirus vaccines revealed that several were successful in curbing the spread of COVID-19. This news further supported the market’s optimism towards continued global growth with the expectation of global coordinated fiscal expansionary policy underpinned by accommodative monetary policy.
The EM asset class, in particular, was one of the most favored in this context as it tends to be highly pro-cyclical and exhibits a higher beta to global growth. Beta is a quantitative measure of volatility, also known as systematic risk, of a security or securities versus the market as a whole. Furthermore, investors anticipated that the new Biden administration would make US foreign/trade policy more predictable, and a divided US Congress would likely block Biden’s more progressive fiscal policies, producing a goldilocks scenario and boost the investment case for EM assets. Another key tailwind for EM assets leading into 2021 was the expectation of a weaker US dollar on the back of the US’s massive fiscal deficit and the Fed’s accommodative monetary policy. These developments led investors to increase their allocations to EM assets, which showed strong fund inflows beginning late last year.
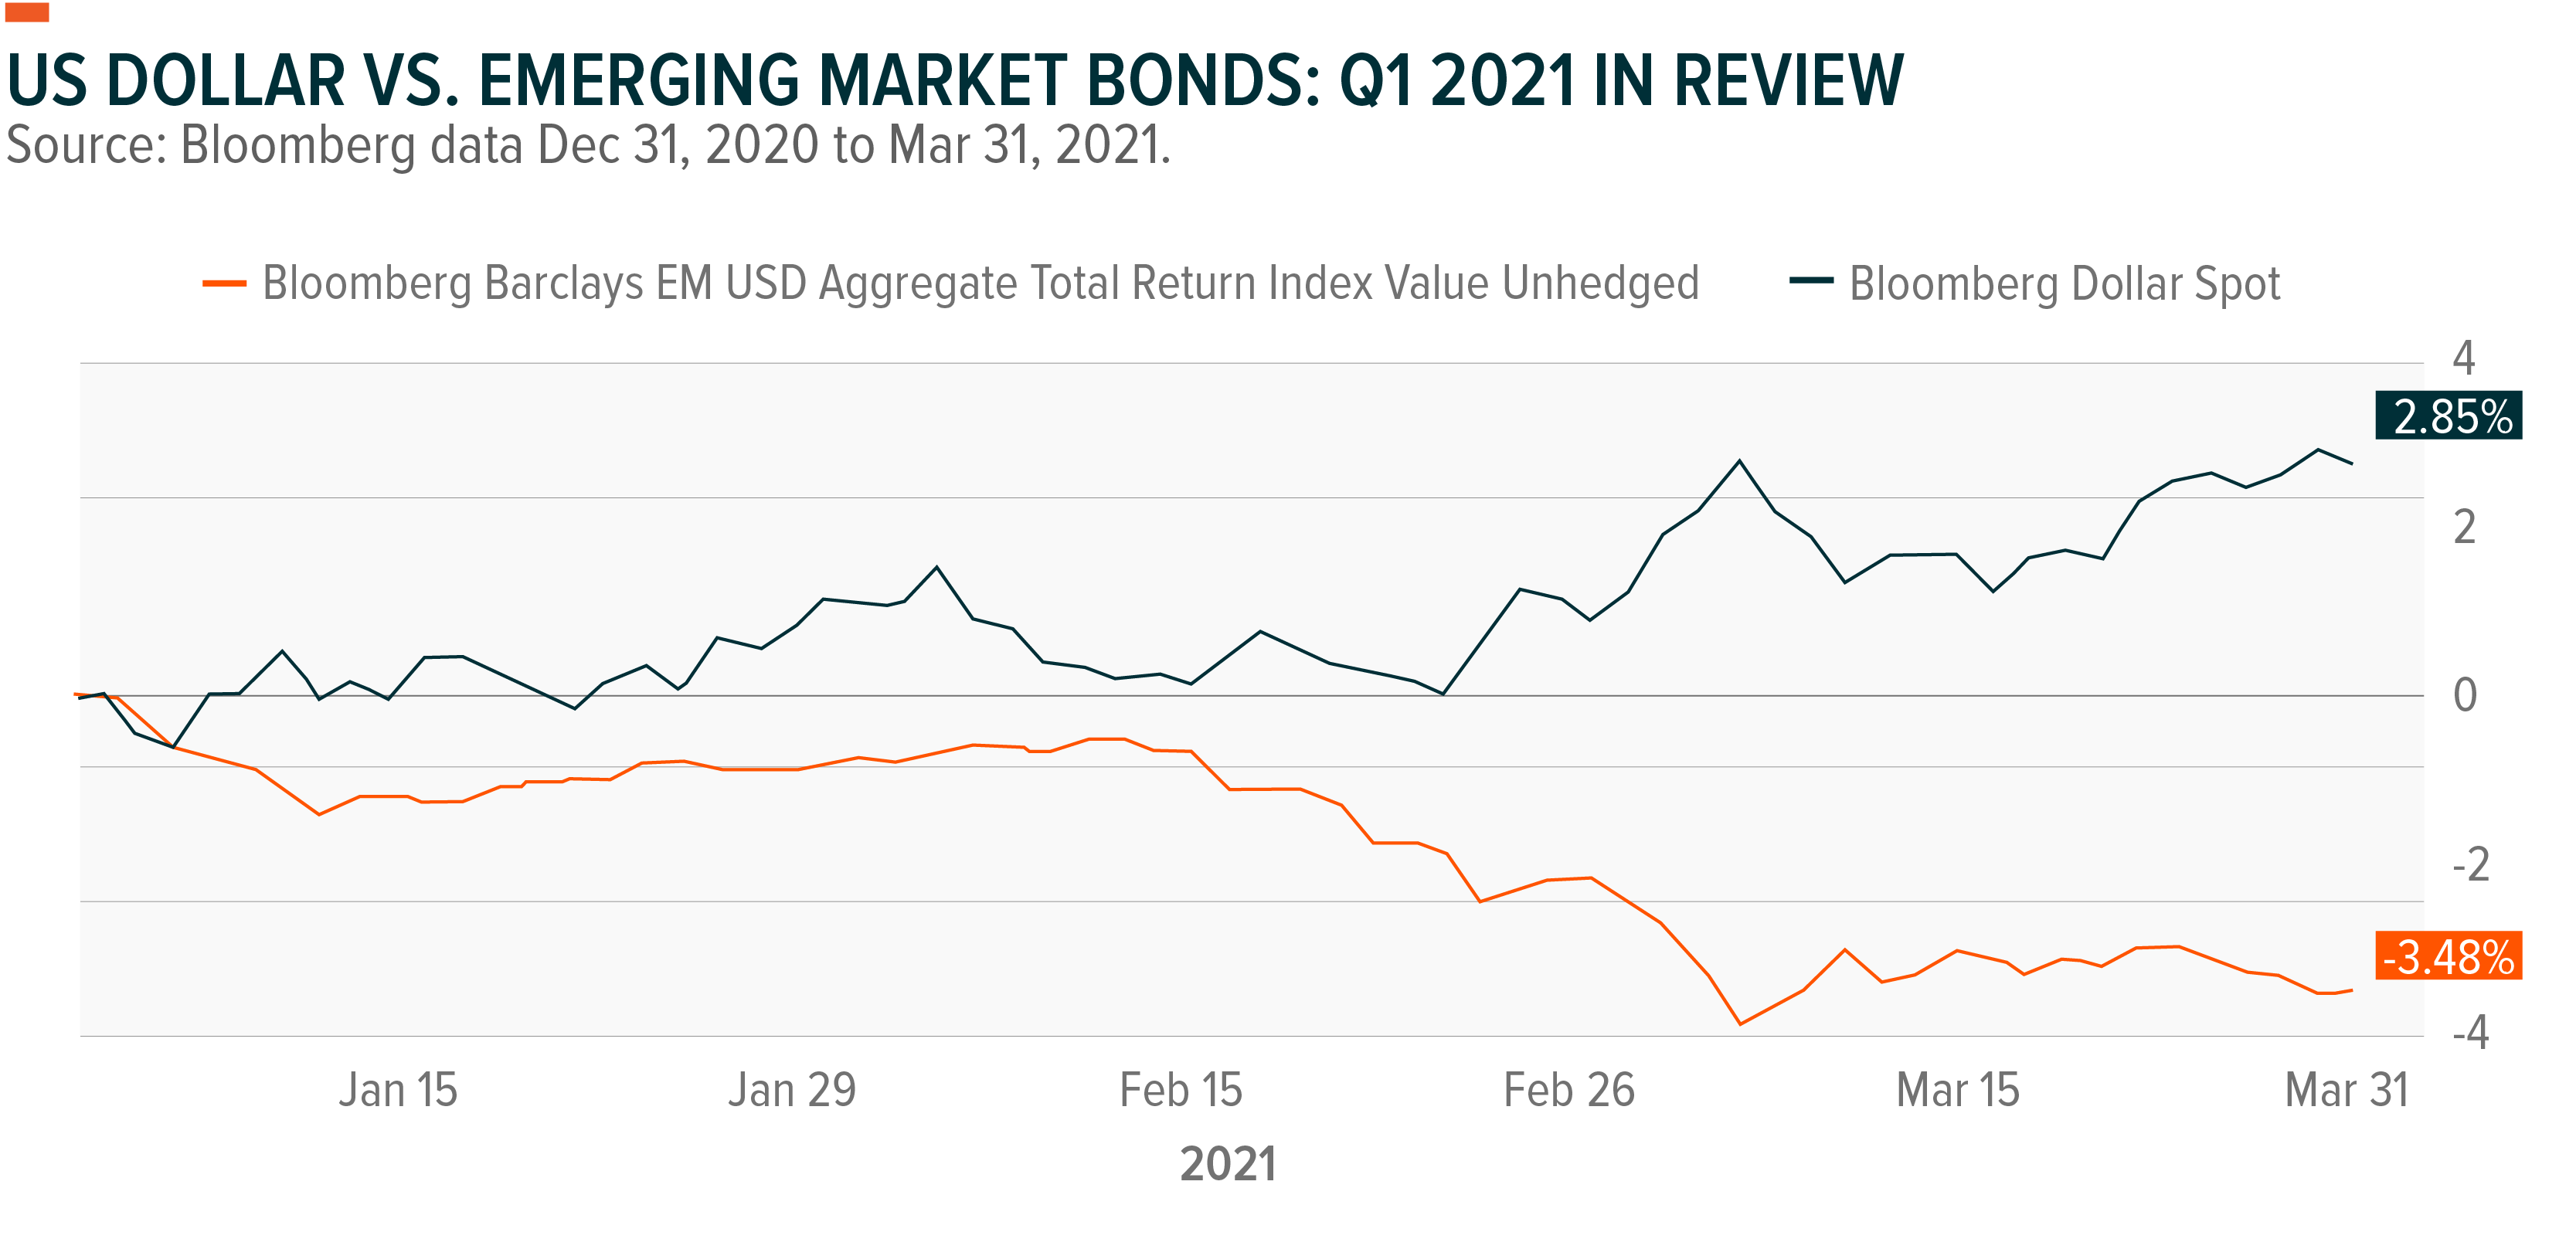
What could have been a goldilocks scenario for 2021 quickly evolved into an overheating scenario when the US Senate election in Georgia led Democrats to control the US Senate, forcing the market to price in more expansionary fiscal stimulus. When the Biden administration successfully pushed through its additional $1.9 trillion stimulus plan, the market had to quickly adjust to much stronger US growth prospects with higher US treasury rates from massive issuance.
The prospect of higher US rates with the reversal of the US dollar trend from weakening to strengthen also reversed the direction of fund flows in EM assets. What caught the market off-guard was that Biden, who was critical of Trump’s US isolationism, somewhat maintained the “America First” policy by keeping the vaccine export ban from US production facilities, which reduced the vaccine supply around the world. That created tighter access for EMs to the vaccines, further slowing the re-opening of their economies. This development widened the expected growth differential between the US and the rest of the world and increased the case for US outperformance.
Meanwhile, China began implementing macro policy measures while its economy continued to build momentum. Chinese leaders repeatedly warned the need to reign in the excess corporate debt growth and prevent real estate prices from rising, which had been a key driver of social unrest. In sum, EM assets faced a much more challenging environment than anticipated.
The performance data quoted represents past performance and does not guarantee future results.
During the period, the emerging sovereign debt market fell by -5.28% as the 10-year US treasury yield increased by 83 basis points to 1.74%, causing a significant loss on treasury returns and long duration assets (which are more sensitive to interest rates). The credit spread widened by 3 basis points to 354 basis points. The investment-grade sector within EM debt, down -5.88%, underperformed the high yield sector, down -4.50%, mainly due to the sector’s long-duration exposure. The Latin America region, which fell by -6.65%, underperformed the broader market due to the poor performance of Argentina and Ecuador as both countries lack the political will to follow through on IMF programs.
Within Latin America, investment-grade countries such as Peru, Uruguay, and Panama all performed poorly due to tight spreads and long duration exposure. During the first quarter, EM debt suffered from more idiosyncratic developments, which increased investor concern about government interference. Brazil’s president ousted the head of state-owned energy company Petrobras for raising local fuel prices, and the president of Turkey ousted the Central Bank governor for raising interest rates. Lower quality African issuers showed more mixed results as the market’s preference for high-yielding bonds provided strong support while those opportunistic issuers tapping the new issue market had to pay hefty new premiums to raise capital.
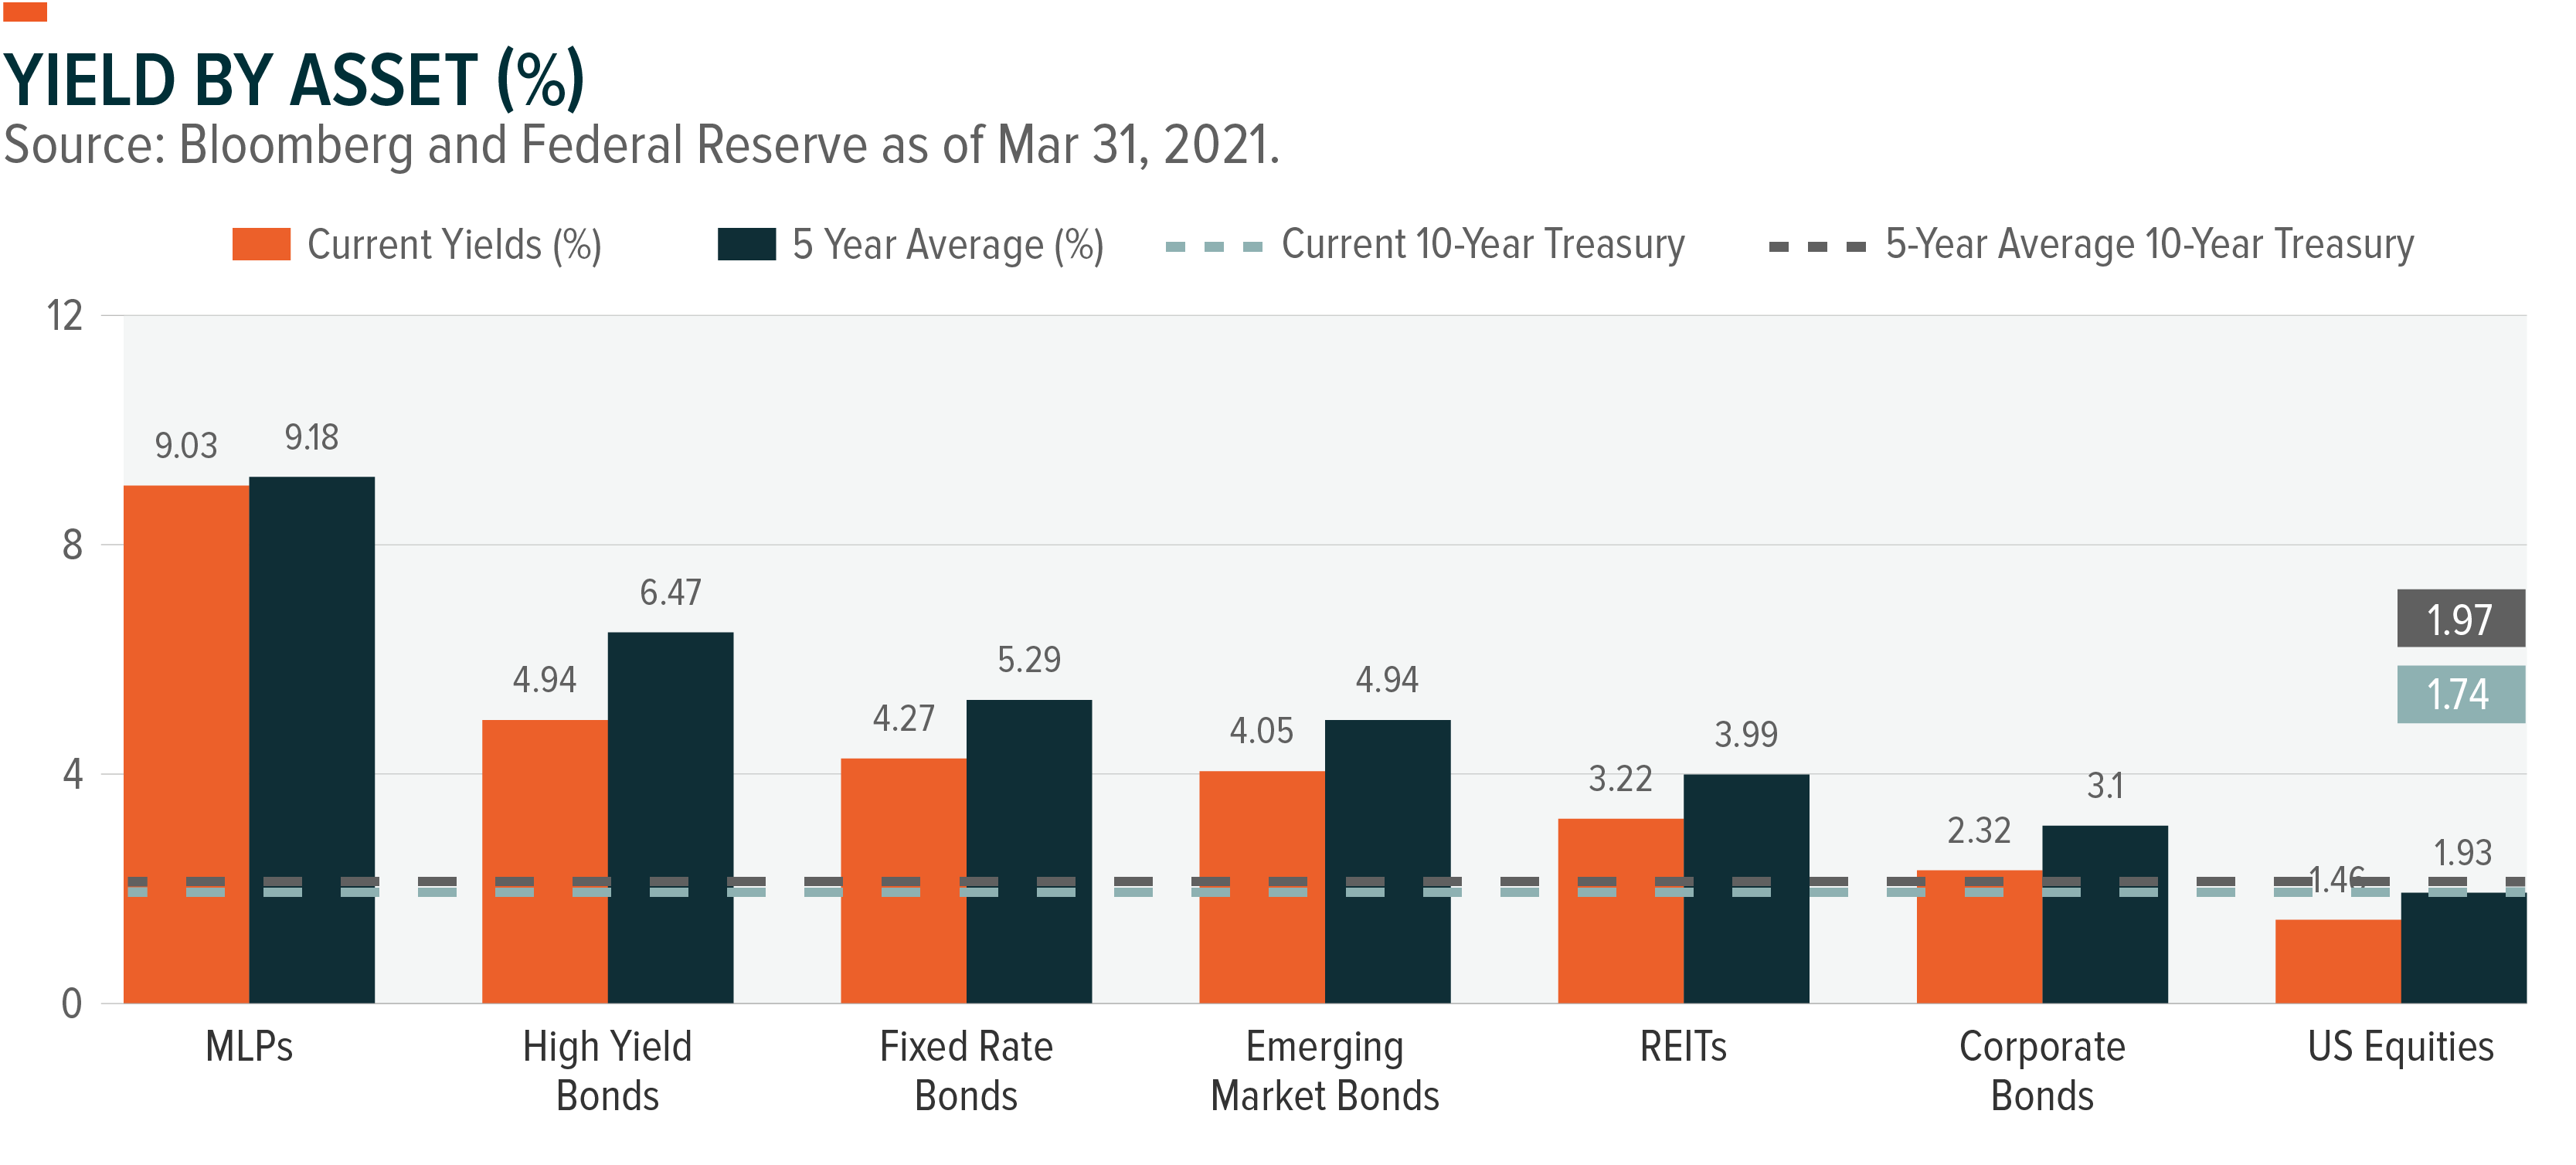
Note: Asset class representations are as follows, MLPs, S&P MLP Index; High Yield Bonds, Bloomberg Barclays US Corporate High Yield Total Return Index; Emerging Market (EM) Bonds, Bloomberg Barclays EM USD Aggregate Total Return Index; Corporate Bonds, Bloomberg Barclays US Corporate Total Return Index; REITs, FTSE NAREIT All Equity REITS Index; Equities, S&P 500 Index; and Fixed Rate Preferreds, ICE BofA Merrill Lynch Fixed Rate Preferred Securities Index. The performance data quoted represents past performance and does not guarantee future results.
EMBD Portfolio Attribution
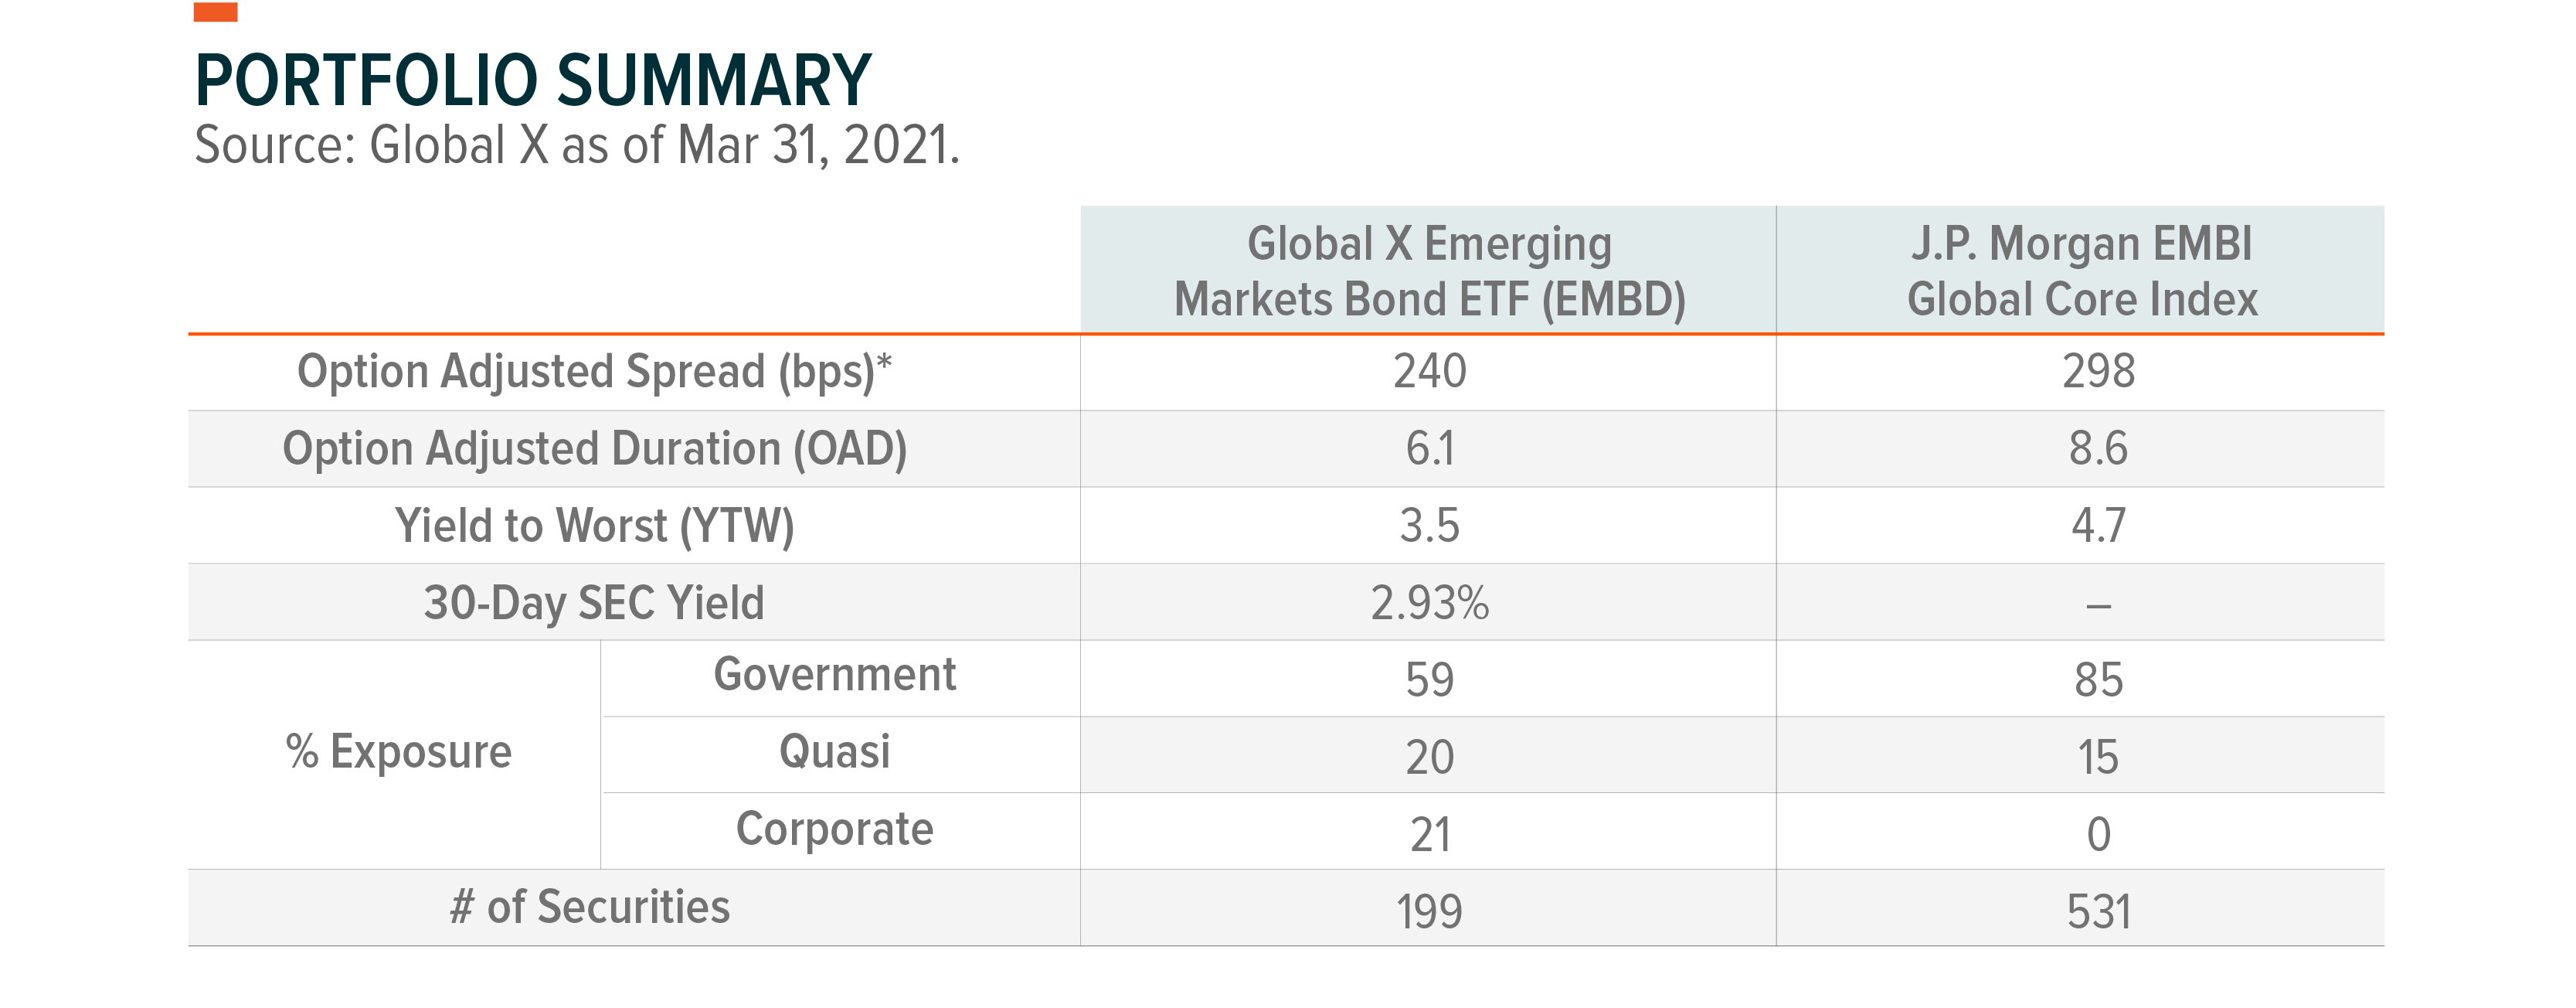
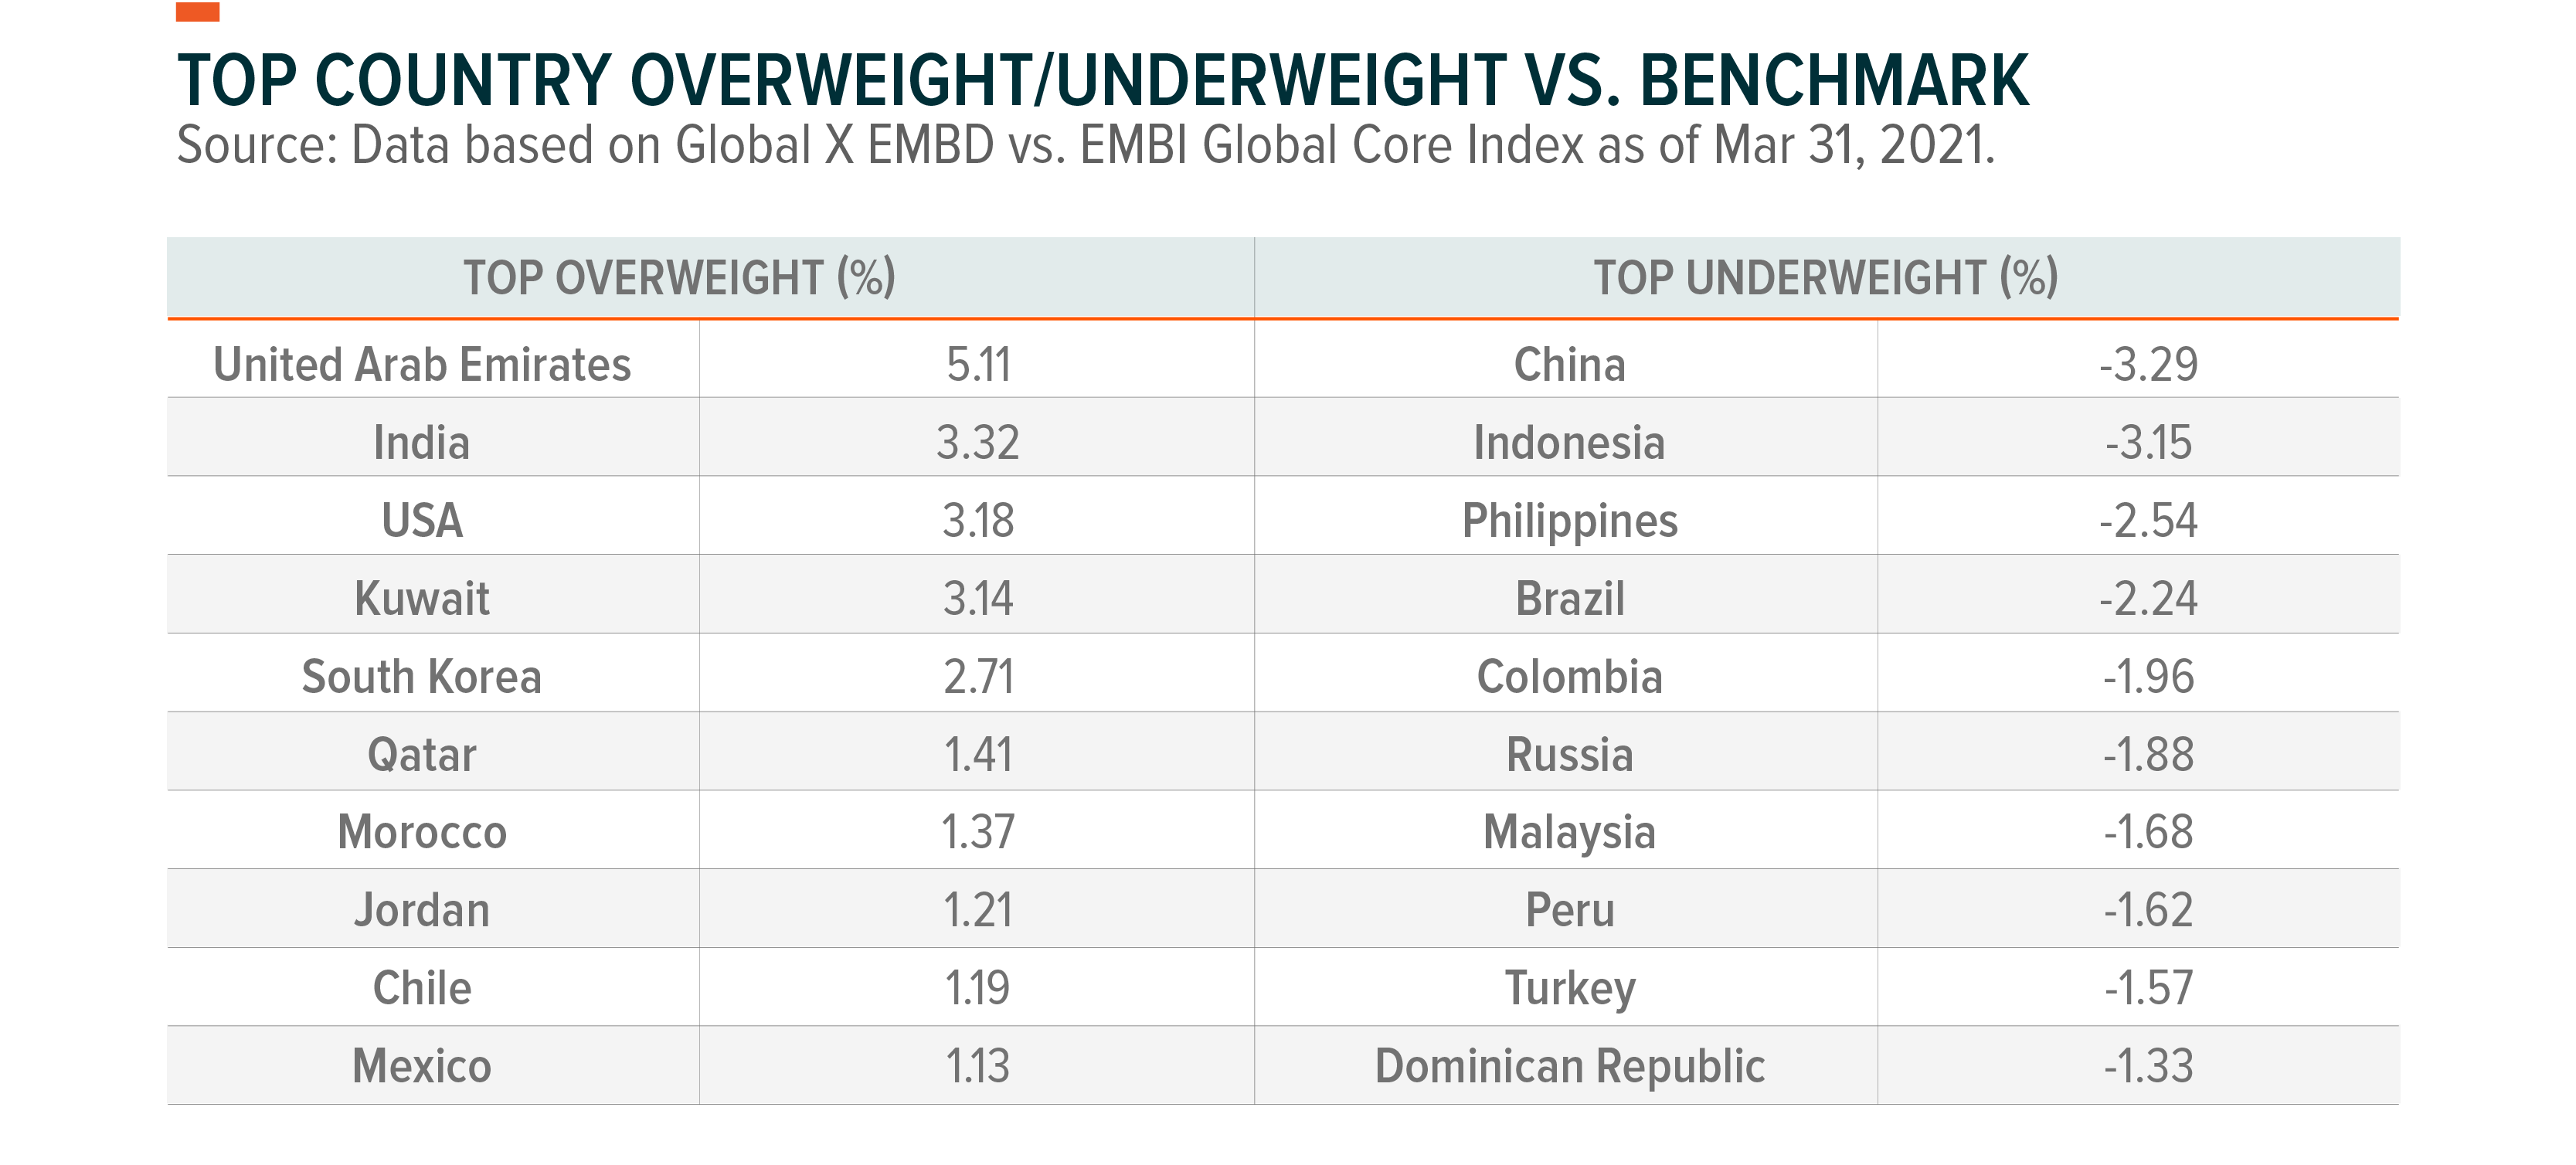
During Q1 2021, the Fund outperformed its benchmark by +133 basis points. EMBD’s lower duration relative to its benchmark was the main contributor to outperformance. As we entered 2021, EMBD reduced its exposure to investment-grade issuers such as Malaysia, the Philippines, Indonesia, and Uruguay as the prospects for higher core rates increased with economic normalization. EMBD portfolio managers’ preferences for higher-yielding assets in lower-quality segments positively contributed to performance.
As the global rates sell-off continued in anticipation of further US fiscal stimulus, the Fund took profits on corporate bond exposures which were slow to correct due to a lack of new issuances in the emerging market corporate bond sector. The Fund re-allocated the capital to A-rated floating-rate bank bonds in investment-grade countries such as South Korea, Qatar, United Arab Emirates, and the US.
The main detractor from performance was EMBD’s overweight in Morocco. Morocco was downgraded to junk status by Moody’s and S&P as the tourism-dependent country suffered a larger economic contraction due to the slow recovery of the European travel industry.
Outlook & Strategy
During the first quarter, we became more cautious on EM fixed income as US growth momentum continues to grow ahead of the rest of world with much stronger fiscal stimulus, a high vaccination rate, a gradual re-opening, and elevated savings rates, which could reverse capital flows back into the US market. This scenario could create a major headwind for EM assets if it fully materializes considering that EM central banks may feel pressured to compete with higher US treasury rates by offering higher real (inflation-adjusted) rates without economic fundamentals warranting such policy responses.
As evident in Brazil and Turkey, these policy responses could also stir up political and social reactions and increase market volatility for EM. Fortunately, these events appear fairly contained within these markets and likely do not have a contagion impact on accommodative monetary policy by other global central banks.
As US growth momentum approaches the Fed’s threshold for reining in quantitative easing (QE) policies and EMs struggle with vaccine supply shortages, the macro backdrop for EM assets could continue to be very challenging. However, vaccine supply should be more readily available for EMs starting in Q2, spurring developing economies to likely replicate the strong US growth trajectory over coming quarters.
Interestingly, the growth divergence between the US and the European Union (EU) has provided EMs with greater breathing room. The European Central Bank’s reluctance to let Eurozone government yields follow US treasury rates higher by increasing the PEPP purchase pace has caused European investors to search for yields in the EM fixed income market.
In terms of the fundamental outlook for EM, higher deficit and debt problems pose a challenging environment for some EM issuers. However, many EM countries maintain healthy current account positions. As was the case in Q4 of 2020, we believe the valuation for the investment-grade sector is slightly expensive with less room for credit spreads to absorb higher US treasury yields with the market anticipating higher US treasury issuances. Therefore, we still favor high-yielding assets over the investment-grade sector.
Our portfolio seeks to maintain an underweight to countries with elevated volatility risks which may only increase with stronger US economic data. Our portfolio favors high-yielding quasi-governmental issuers such as Mexico’s oil and gas producers and a government-owned airport operator in Panama. Likewise, EMBD continues to invest in Mexican industrials that may benefit from a strong US economic recovery. Our outlook anticipates that demand for carry assets will remain high given that we remain in a zero-rate environment thanks to major central banks maintaining their QE policies. Likewise, our outlook anticipates that market volatility will stay high, making an active strategy particularly relevant as more robust economic data may cause the market to be concerned about the Fed’s eventual QE tapering process.

Holdings subject to change. Current and future holdings subject to risk.
Definitions
S&P MLP Index provides investors with exposure to the leading partnerships that trade on the NYSE and NASDAQ. The index includes both master limited partnerships (MLPs) and publicly traded limited liability companies (LLCs), which have a similar legal structure to MLPs and share the same tax benefits.
Bloomberg Barclays US Corporate High Yield Total Return Index measures the USD-denominated, high yield, fixed-rate corporate bond market. Securities are classified as high yield if the middle rating of Moody’s, Fitch and S&P is Ba1/BB+/BB+ or below. Bonds from issuers with an emerging markets country of risk, based on the indices’ EM country definition, are excluded.
Bloomberg Barclays EM USD Aggregate Total Return Index is a flagship hard currency Emerging Markets debt benchmark that includes fixed and floating-rate USD dollar-denominated debt issued from sovereign, quasi-sovereign, and corporate EM issuers.
FTSE NAREIT All Equity REITS Index is a free float adjusted market capitalization weighted index that includes all tax qualified equity REITs listed in the NYSE, AMEX, and NASDAQ National Market.
The Bloomberg Barclays US Corporate Total Return Index measures the investment grade, fixed-rate, taxable corporate bond market. It includes USD denominated securities publicly issued by US and non-US industrial, utility and financial issuers.
S&P 500 Index tracks the performance of 500 leading U.S. stocks and captures approximately 80% coverage of available U.S. market capitalization. It is widely regarded as the best single gauge of large-cap U.S. equities.
BofA Merrill Lynch Fixed Rate Preferred Securities Index tracks the performance of fixed-rate U.S. dollar denominated preferred securities issued in the U.S. domestic market.
Bloomberg Dollar Spot Index tracks the performance of a basket of ten leading global currencies versus the U.S. Dollar. Each currency in the basket and their weight is determined annually based on their share of international trade and FX liquidity. The BBDXY Index data starts from Dec 31, 2004 with a base level of 1000.
Credit Rating Agencies noted are Fitch, Moody’s, and Standard & Poor’s. Ratings are measured on a scale that generally ranges from Aaa (highest) to D (lowest). If more than one of these rating agencies rated the security, then an average of the ratings was taken to decide the security’s rating.
Related ETFs
EMBD: The Global X Emerging Markets Bond ETF is an actively managed fund sub-advised by Mirae Asset Global Investments that seeks a high level of total return, consisting of both income and capital appreciation, by investing in emerging market debt.