 Morgane Delledonne
Monetary policy remained in the spotlight in September with the European Central Bank’s (ECB) unprecedented 75-basis point (bp) hike. Widely expected, the market had a muted reaction, apart from the euro getting back to parity with the U.S. dollar. The ECB’s hawkish shift is clearly an effort to prevent energy and commodities inflation from becoming embedded in domestic prices, even if it means dampening demand. Interestingly, the ECB signaled more hikes amid substantial upward revision of its real GDP projection for 2022.1 But markets seemed unclear on what the ECB meant when in the same statement the bank restated its data-dependent, meeting-by-meeting approach. The contrasting statements resulted in a neutral response from the market.
The ECB updated its economic projections from July with significant downward revisions for growth and upward revisions for inflation. The ECB now forecasts real GDP to grow 3.1% in 2022, 0.9% in 2023, and 1.9% in 2024, and inflation to average 8.1% in 2022 before gradually normalizing to 5.5% in 2023 and 2.3% in 2024. The most important takeaway was ECB President Christine Lagarde stressing that the inflation forecast for 2024 remains above the 2% target, which may lead to several large rate hikes.2 The silver lining is that these projections do not signal recession in the region, but rather a low-growth, high-inflation scenario, i.e., stagflation.
The Federal Reserve (Fed) remained aggressive with its third consecutive 75bp hike, and we expect the 75bp hikes to continue until core inflation, which excludes food and energy, starts abating. Fed Chair Jerome Powell said that he is willing to tolerate a recession if that is what it takes to regain control of inflation.3 Treasury Secretary Janet Yellen said that while the economy’s growth rate was slowing, the labor market remained “exceptionally strong” with almost two vacancies for every worker looking for a job.4 Her statement echoed the better-than-expected ISM manufacturing reading for August. Even if the Fed remains hawkish in the near term, we do not expect the cycle to continue beyond spring 2023.
The global economy is firmly in transition due to this challenging macroeconomic environment, the resultant policy responses, and the structural changes driven by the unfolding energy crisis. However, we see several reasons for optimism.
Investment strategies highlighted this month:
- Tech Rebound Possible with a More Stable U.S. Dollar – Further normalization of headline inflation and aggressive monetary tightening in other regions should keep the U.S. dollar relatively stable, which bodes well for technology companies and other growth-oriented names.
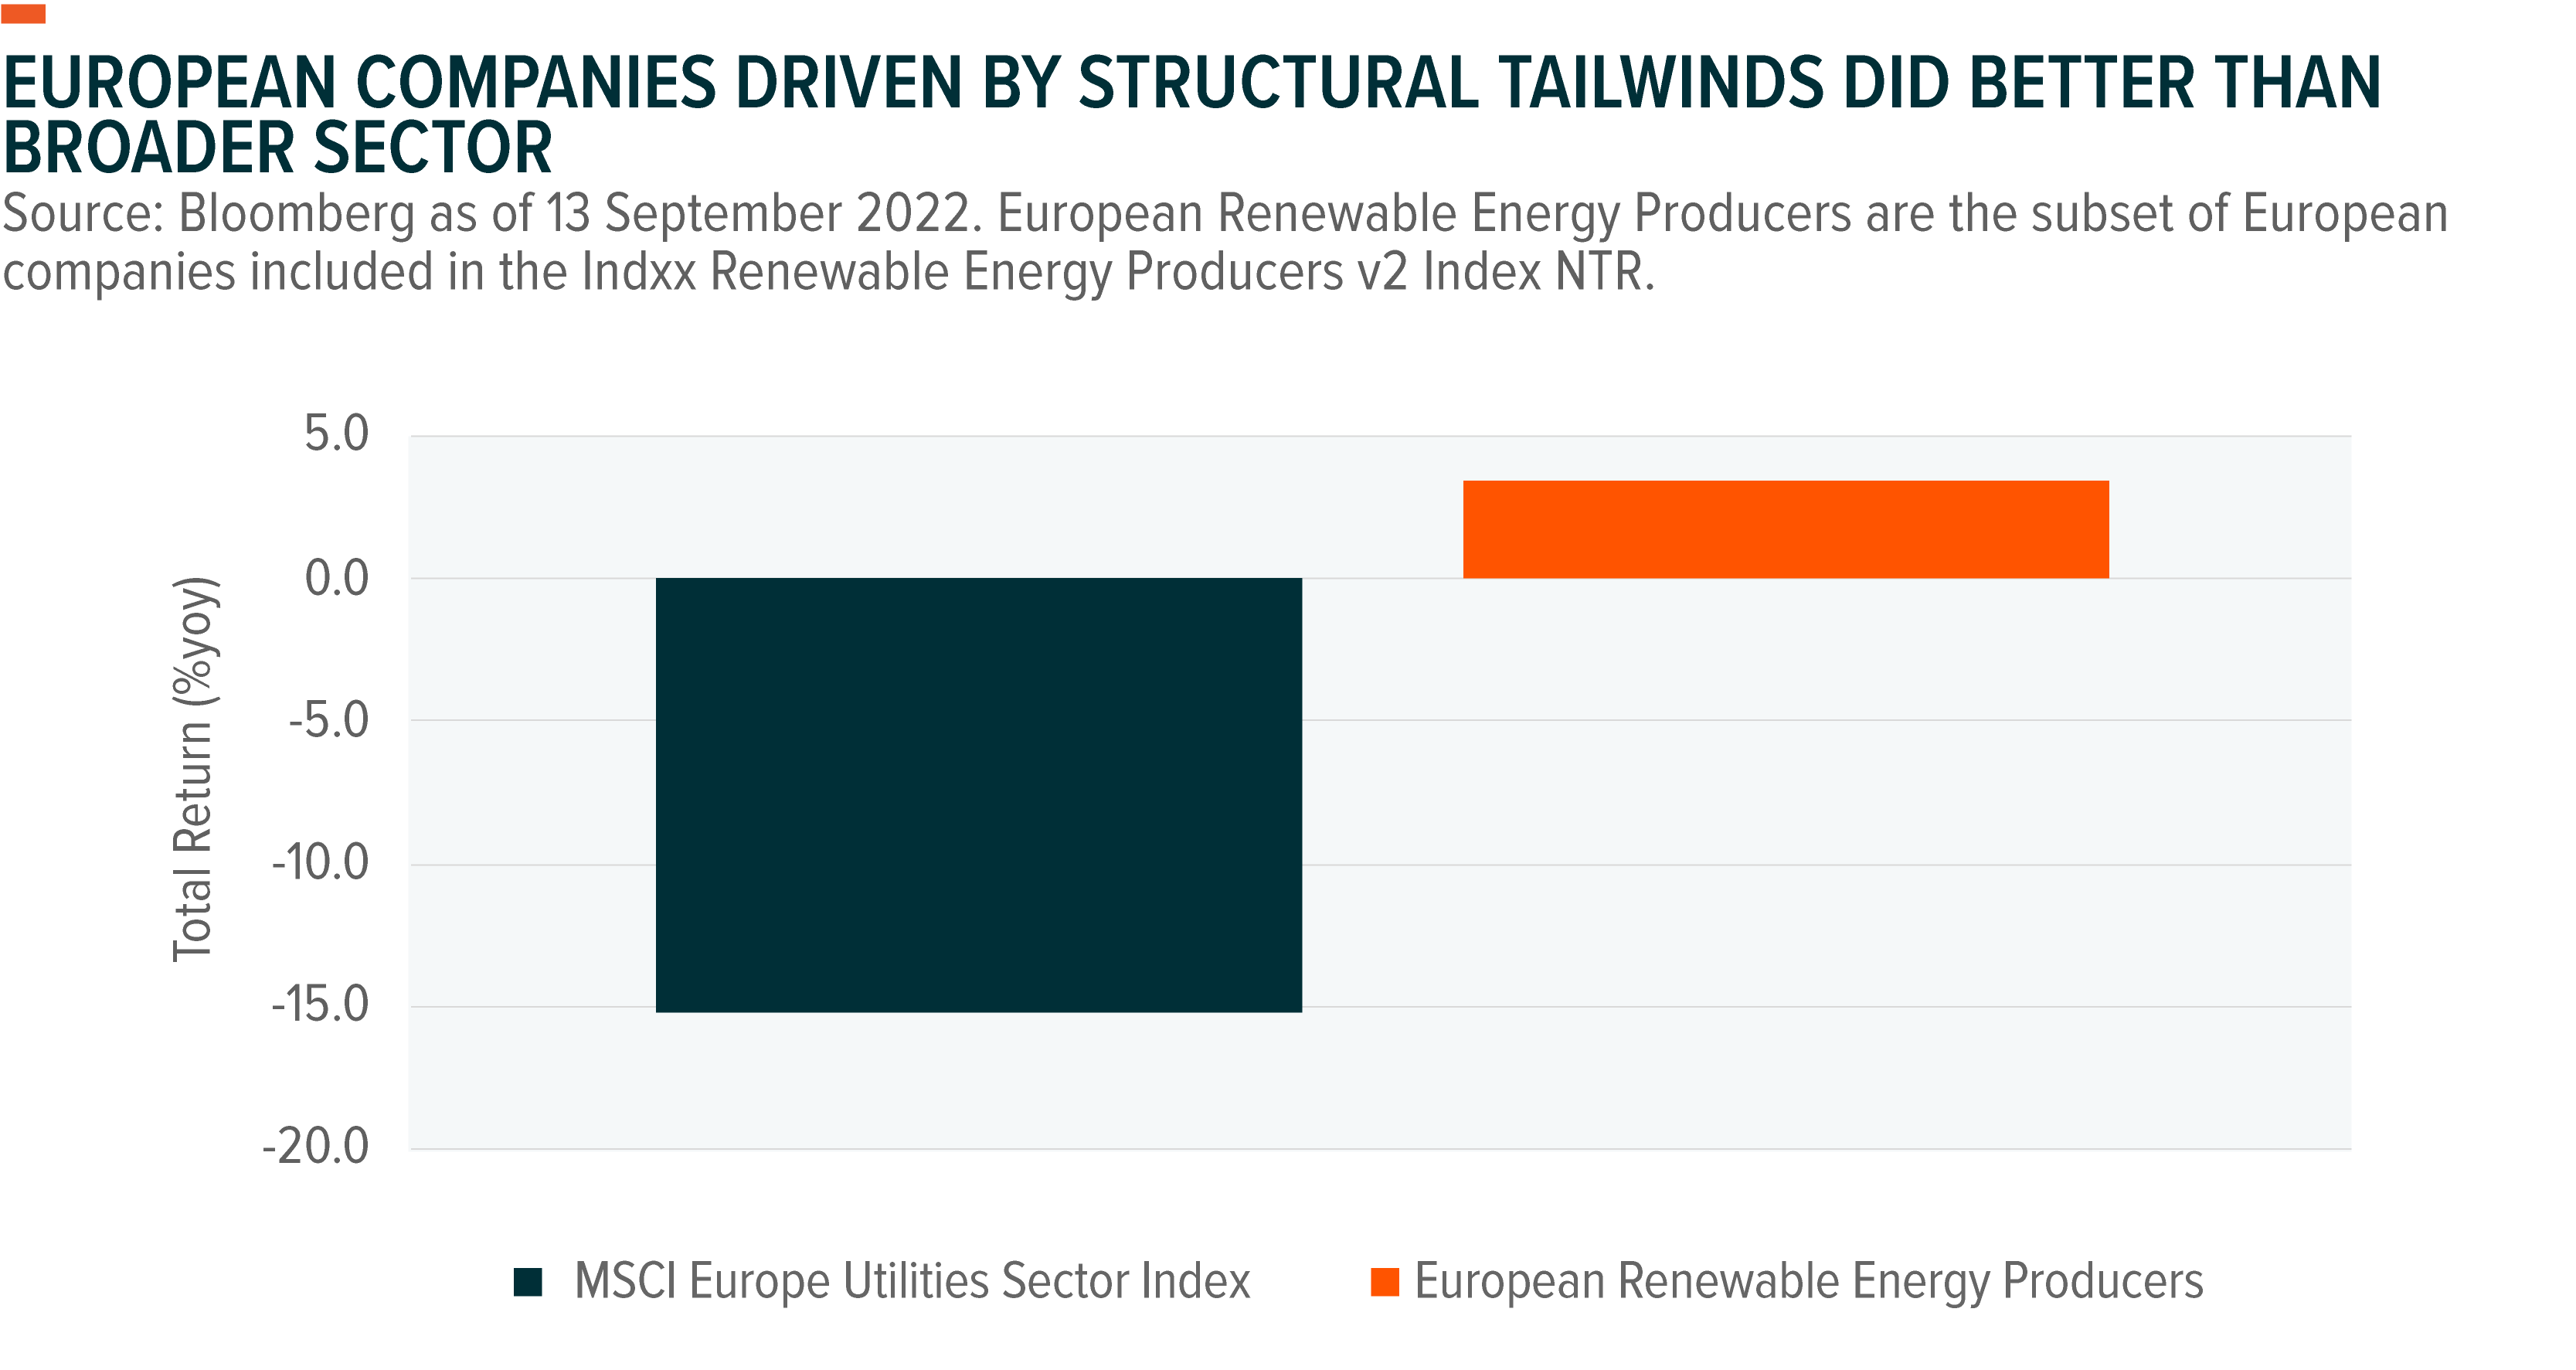
- European Firms Supported by Structural Drivers Outperforming – The global energy crisis will likely make climate change the most important mega theme of the decade, and we are starting to see it play out in performance.
- Silver Miners Present Opportunities – Attractive valuations for silver miners, extreme pessimism on silver futures, and a high gold-to-silver ratio point to a possible rebound.
Tech: A More Stable U.S. Dollar Can Help
Technology companies have been hit hard in 2022, and the short-term situation appears daunting. However, long-term digitalization trends continue to materialize into a major structural shift, and we can identify key macroeconomic reasons for investor sentiment towards growth strategies to turn more positive. First, headline inflation may have peaked in the U.S., and second, the U.S. dollar looks poised to stabilize amid slowing economic growth. A more stable dollar would be positive for the Technology sector given that many of its biggest names conduct large portions of their business overseas. Nvidia and Meta, for example, have lost half their value this year amid high inflation and rate hikes.5
The fed funds rate is at 3.25% and the ECB’s main refinancing operations (MRO) rate, which is the interest rate banks pay when they borrow money from the ECB for one week, is now at 1.25%. Current fed funds futures pricing suggests that the fed funds rate will increase by about 119bp by year-end, possibly with another 75bp hike in November, followed by a 50bp hike in December.6 In Europe, markets expect the ECB to hike by about 136bp by year-end, possibly with 75bp and 50bp hikes in October and December, respectively.7
Importantly, the Fed and the ECB are expected to increase rates by the same amount from October, and thus maintain the current rate differential, which should not drive further dollar appreciation. As of September 22, the DXY Index, which tracks the strength of the dollar versus major currencies, was over 16.7% higher this year, reaching its highest point since 2002.8 However, slowing economic growth and aggressive tightening from other major central banks are likely to increase downward pressures on the dollar.
For U.S. equities, and particularly tech, any change to the long-term fed funds rate estimate at the next Fed meetings will be scrutinized. A change would have a more material impact on earnings and the outlook for equities, due to a persistently higher financing and discount rate, than the Fed’s short-term hawkishness.
European Firms: Structural Drivers Are a Differentiator
In Europe, investor sentiment may have passed peak pessimism. Boosting confidence is that after Gazprom announced that it would permanently cut gas to Germany through the Nordstream pipeline, Russia doesn’t have much economic leverage left with its energy. Following an International Monetary Fund warning that Germany was at risk of losing 4.8% of economic output without natural gas from Russia, energy cooperation across Europe increased.9 France and Germany, for example, struck a deal to share energy resources.
Also, in a policy reversal, Germany moved to keep two nuclear plants available this winter as European leaders scrambled for emergency fixes to the deepening energy crisis. The move was another example of the strengthening investment case for nuclear energy, one of the main long-term alternatives to fossil fuels from a scalability standpoint. The Solactive Global Uranium & Nuclear Components Total Return v2 Index, which tracks uranium mining and companies producing of nuclear components, increased 8.8% as of September 21.10
The International Atomic Energy Agency (IAEA) predicts that nuclear power capacity for electricity generation grows 17% over the next decade.11 Over the next three years, uranium supply deficits should reach the US$4–16 million range annually.12 Also, demand for nuclear components should increase steadily with the rising number of nuclear reactors under construction. Globally, there are 437 active reactors, 59 reactors currently under construction, and an additional 89 reactors planned.13
Europe’s energy crisis is no longer a cyclical tailwind for these renewable and clean energy themes, but a structural change. The region is moving fast to an independent energy model that requires a mix of renewable sources and infrastructure to distribute energy efficiently across the member states, and firms are stepping up. Approximately 15% of capital expenditures by major energy companies are expected to support the green transition this year. By 2030, the percentage is expected to be over 50% according to Bloomberg analyst forecasts.14
The European renewable producers and cleantech companies that provide the technology to produce alternative sources of energy are likely to continue to see stronger demand from the region and the U.S. following the Inflation Reduction Act’s passage. Supported by structural drivers, the European tech, energy, and utilities companies that produce the products and services for the clean energy transition outperformed their peers this year as of 13 September 2022. In addition, we expect growth in the clean energy sector to have a snowball effect on investments in disruptive materials such as lithium, copper, cobalt, zinc and other rare earth materials, which are critical inputs to clean technologies.
Investors are increasingly on board as well. With US$1.3 billion year-to-date, climate change themes are dominating UCITS thematic inflows.15 The largest inflows among clean energy subthemes are to hydrogen. We expect themes like wind and solar to garner more and more interest in the coming months following the U.S.’ passage of the Inflation Reduction Act, which includes over US$120bn for wind and solar through tax credits.16 These renewables are the largest portion of spending from its unprecedented climate package. The Solar theme, captured by the Solactive Solar Index, is the best performing theme since Russia invaded Ukraine in February, rising 11.5% from February 17 to September 22.17
Silver Miners: Defensive Tilt Plus Structural Boost Is Attractive
Silver is used to make photovoltaic (PV) cells, so solar playing major roles in Europe’s clean energy transition and the Inflation Reduction Act create structural tailwinds. Gold and silver have faced headwinds since the beginning of the year, but the more stable U.S. dollar that we expect in the coming months should remove some of those headwinds. When the economy slows, silver tends to do well during the downturn or just after.
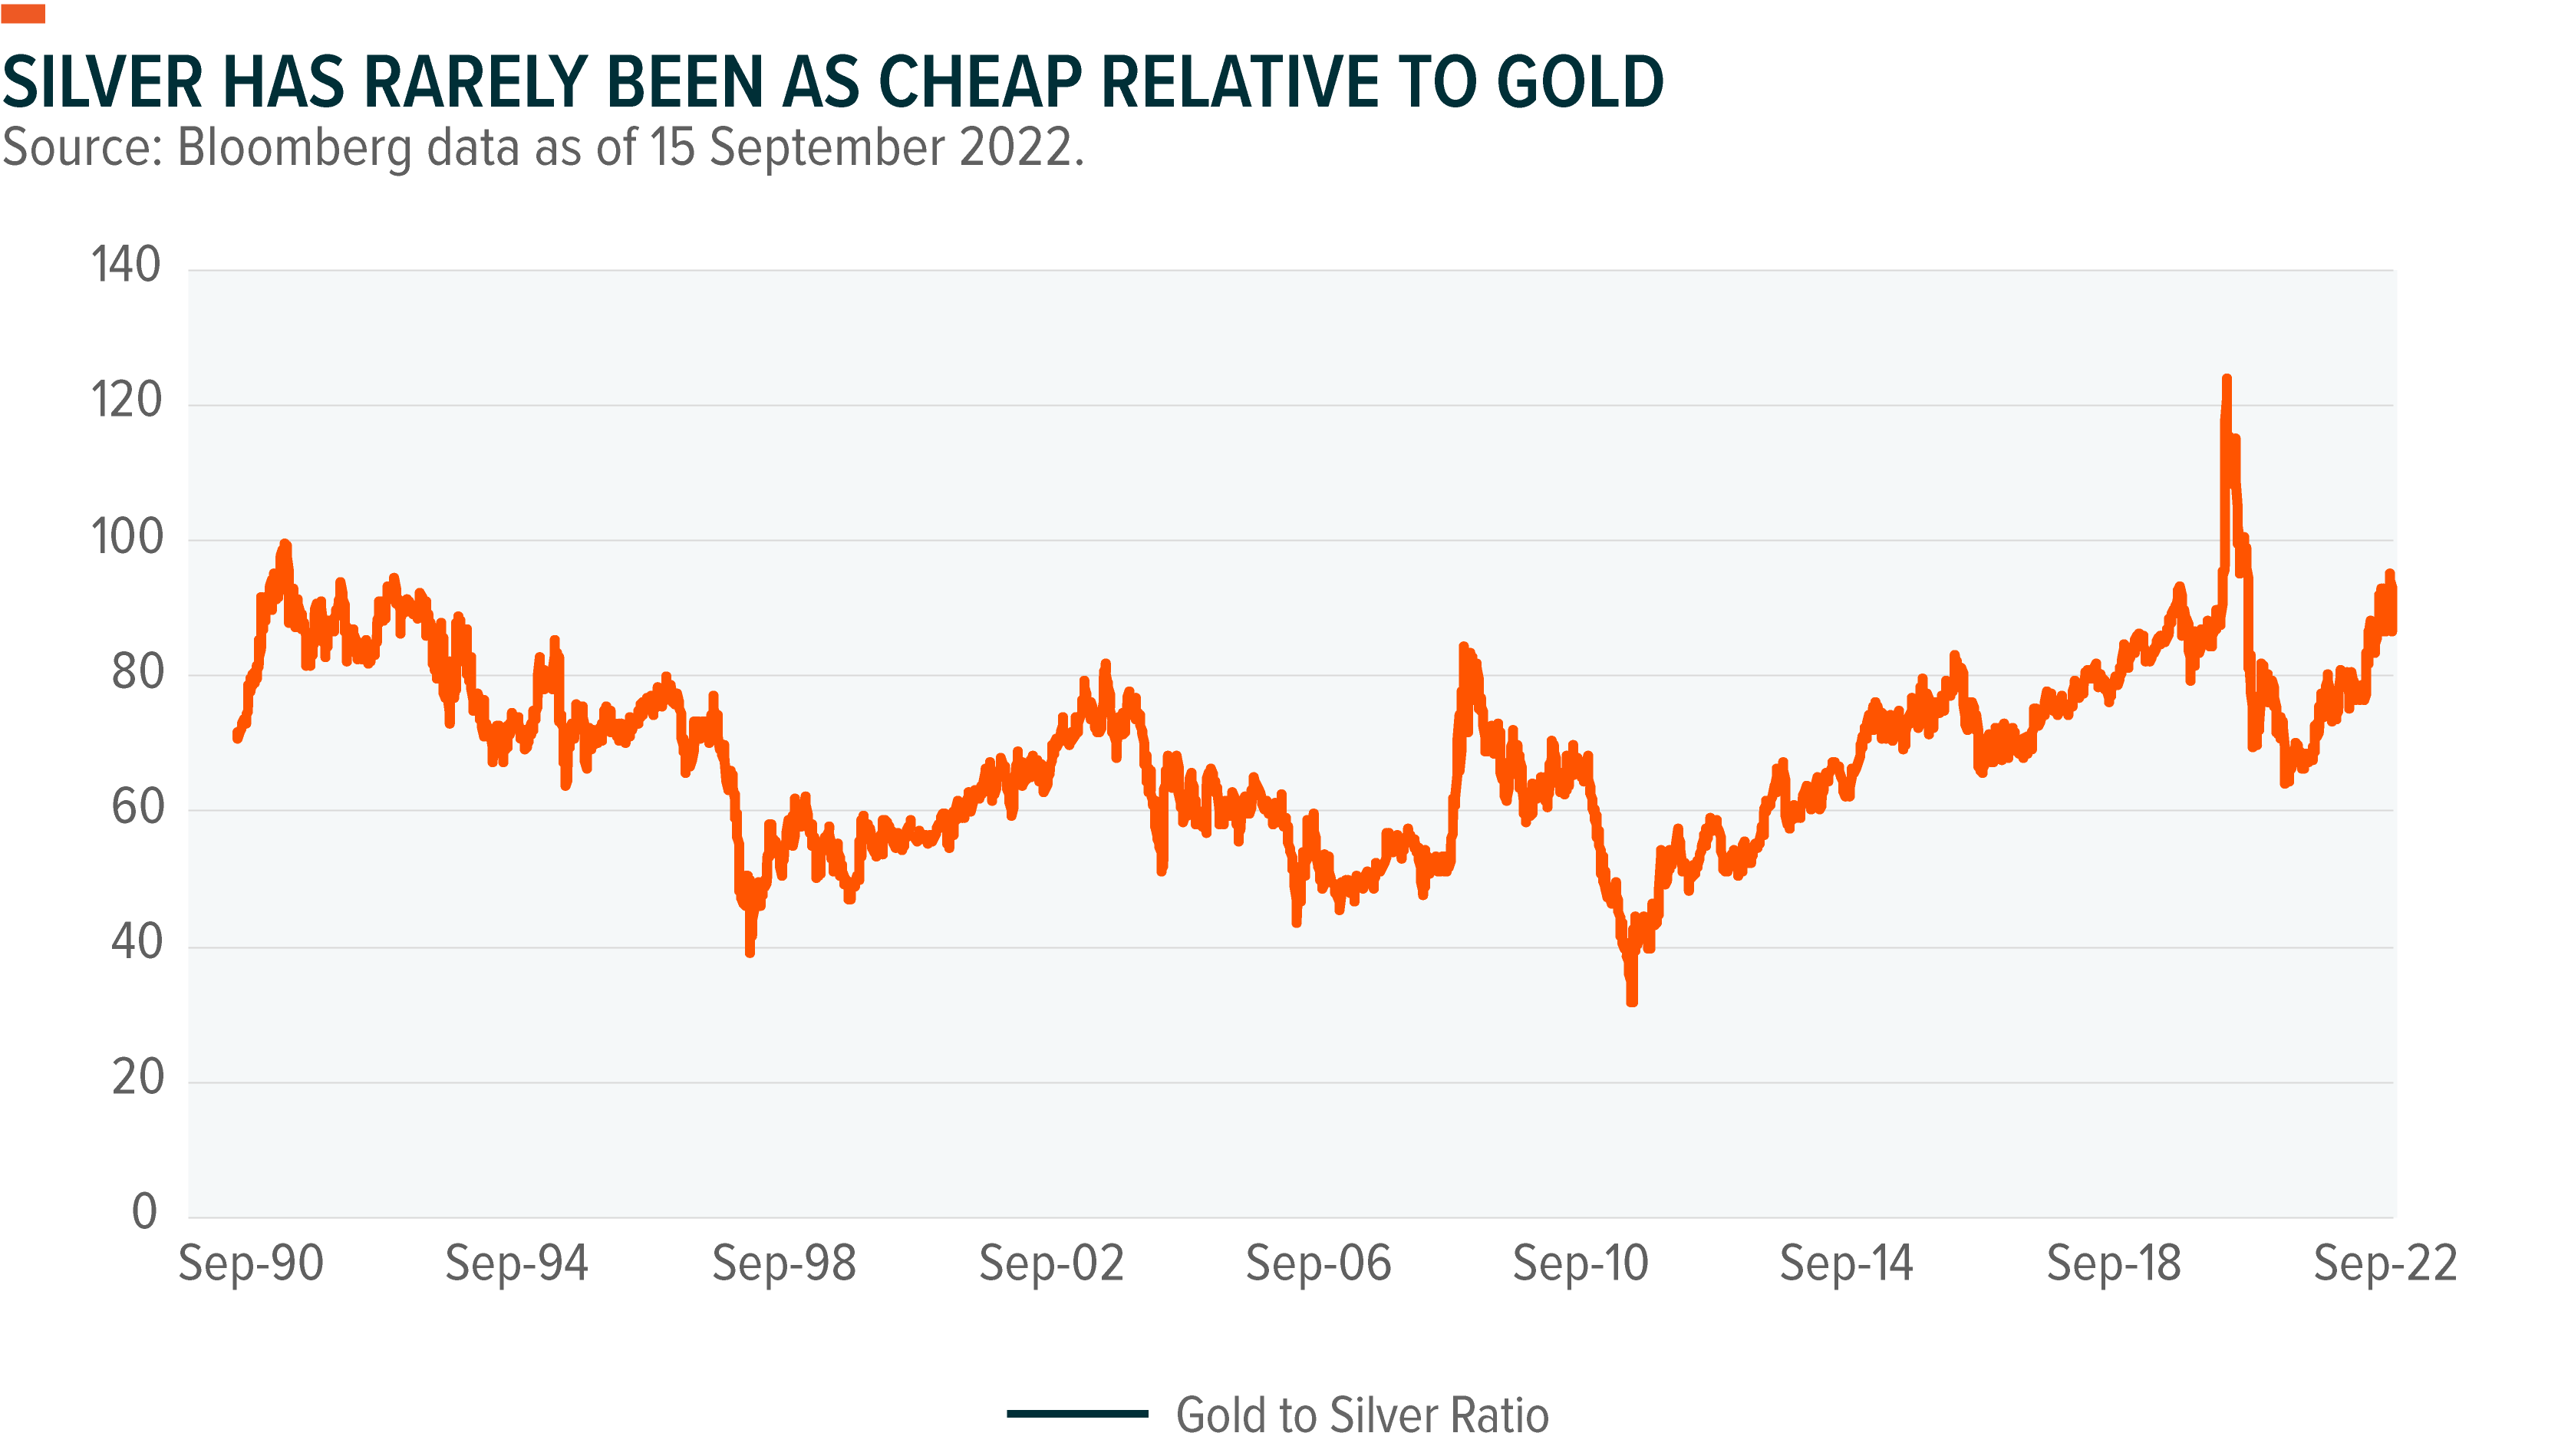
Currently, the gold-to-silver ratio lingers near 90, which means that it takes 90 ounces of silver to buy one ounce of gold, well above its long-term average of 68.18 The higher the ratio, the more undervalued silver is relative to gold. The ratio typically rises during precious metals bear markets and falls during bull markets because silver is more volatile than gold. Silver has rarely been as cheap compared to gold. Based on historical trends, should precious metals enter a bull market, this ratio could tighten significantly with silver prices rising more than gold.
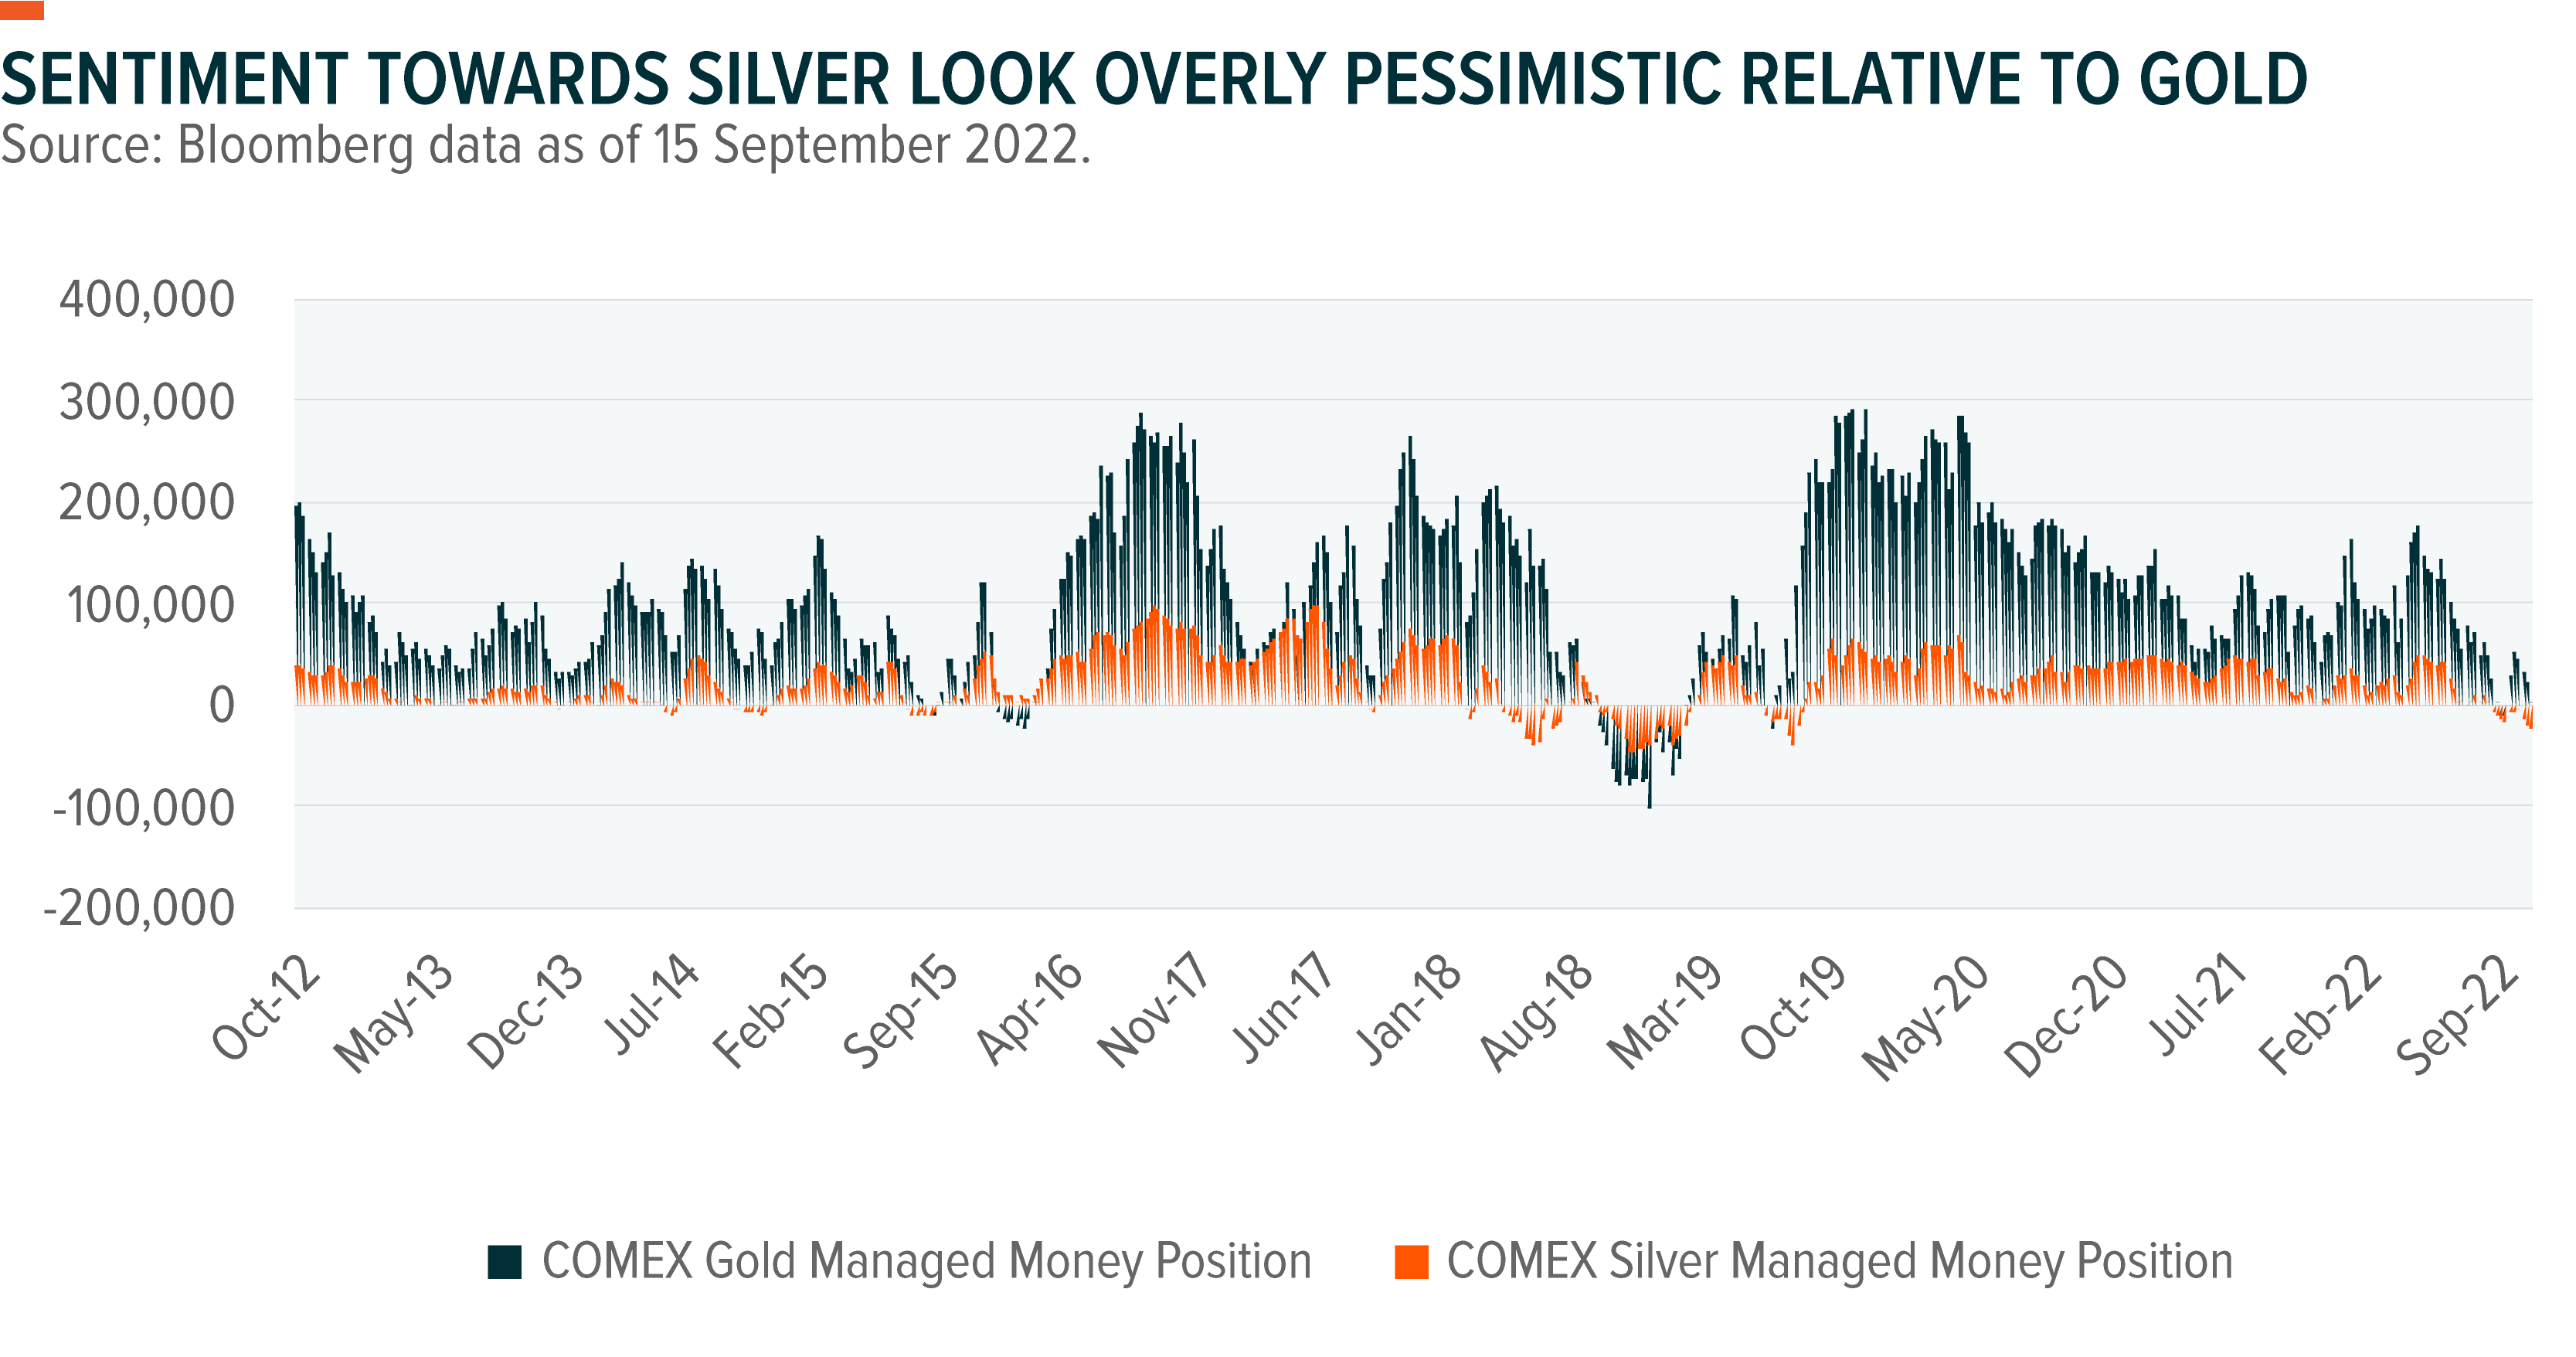
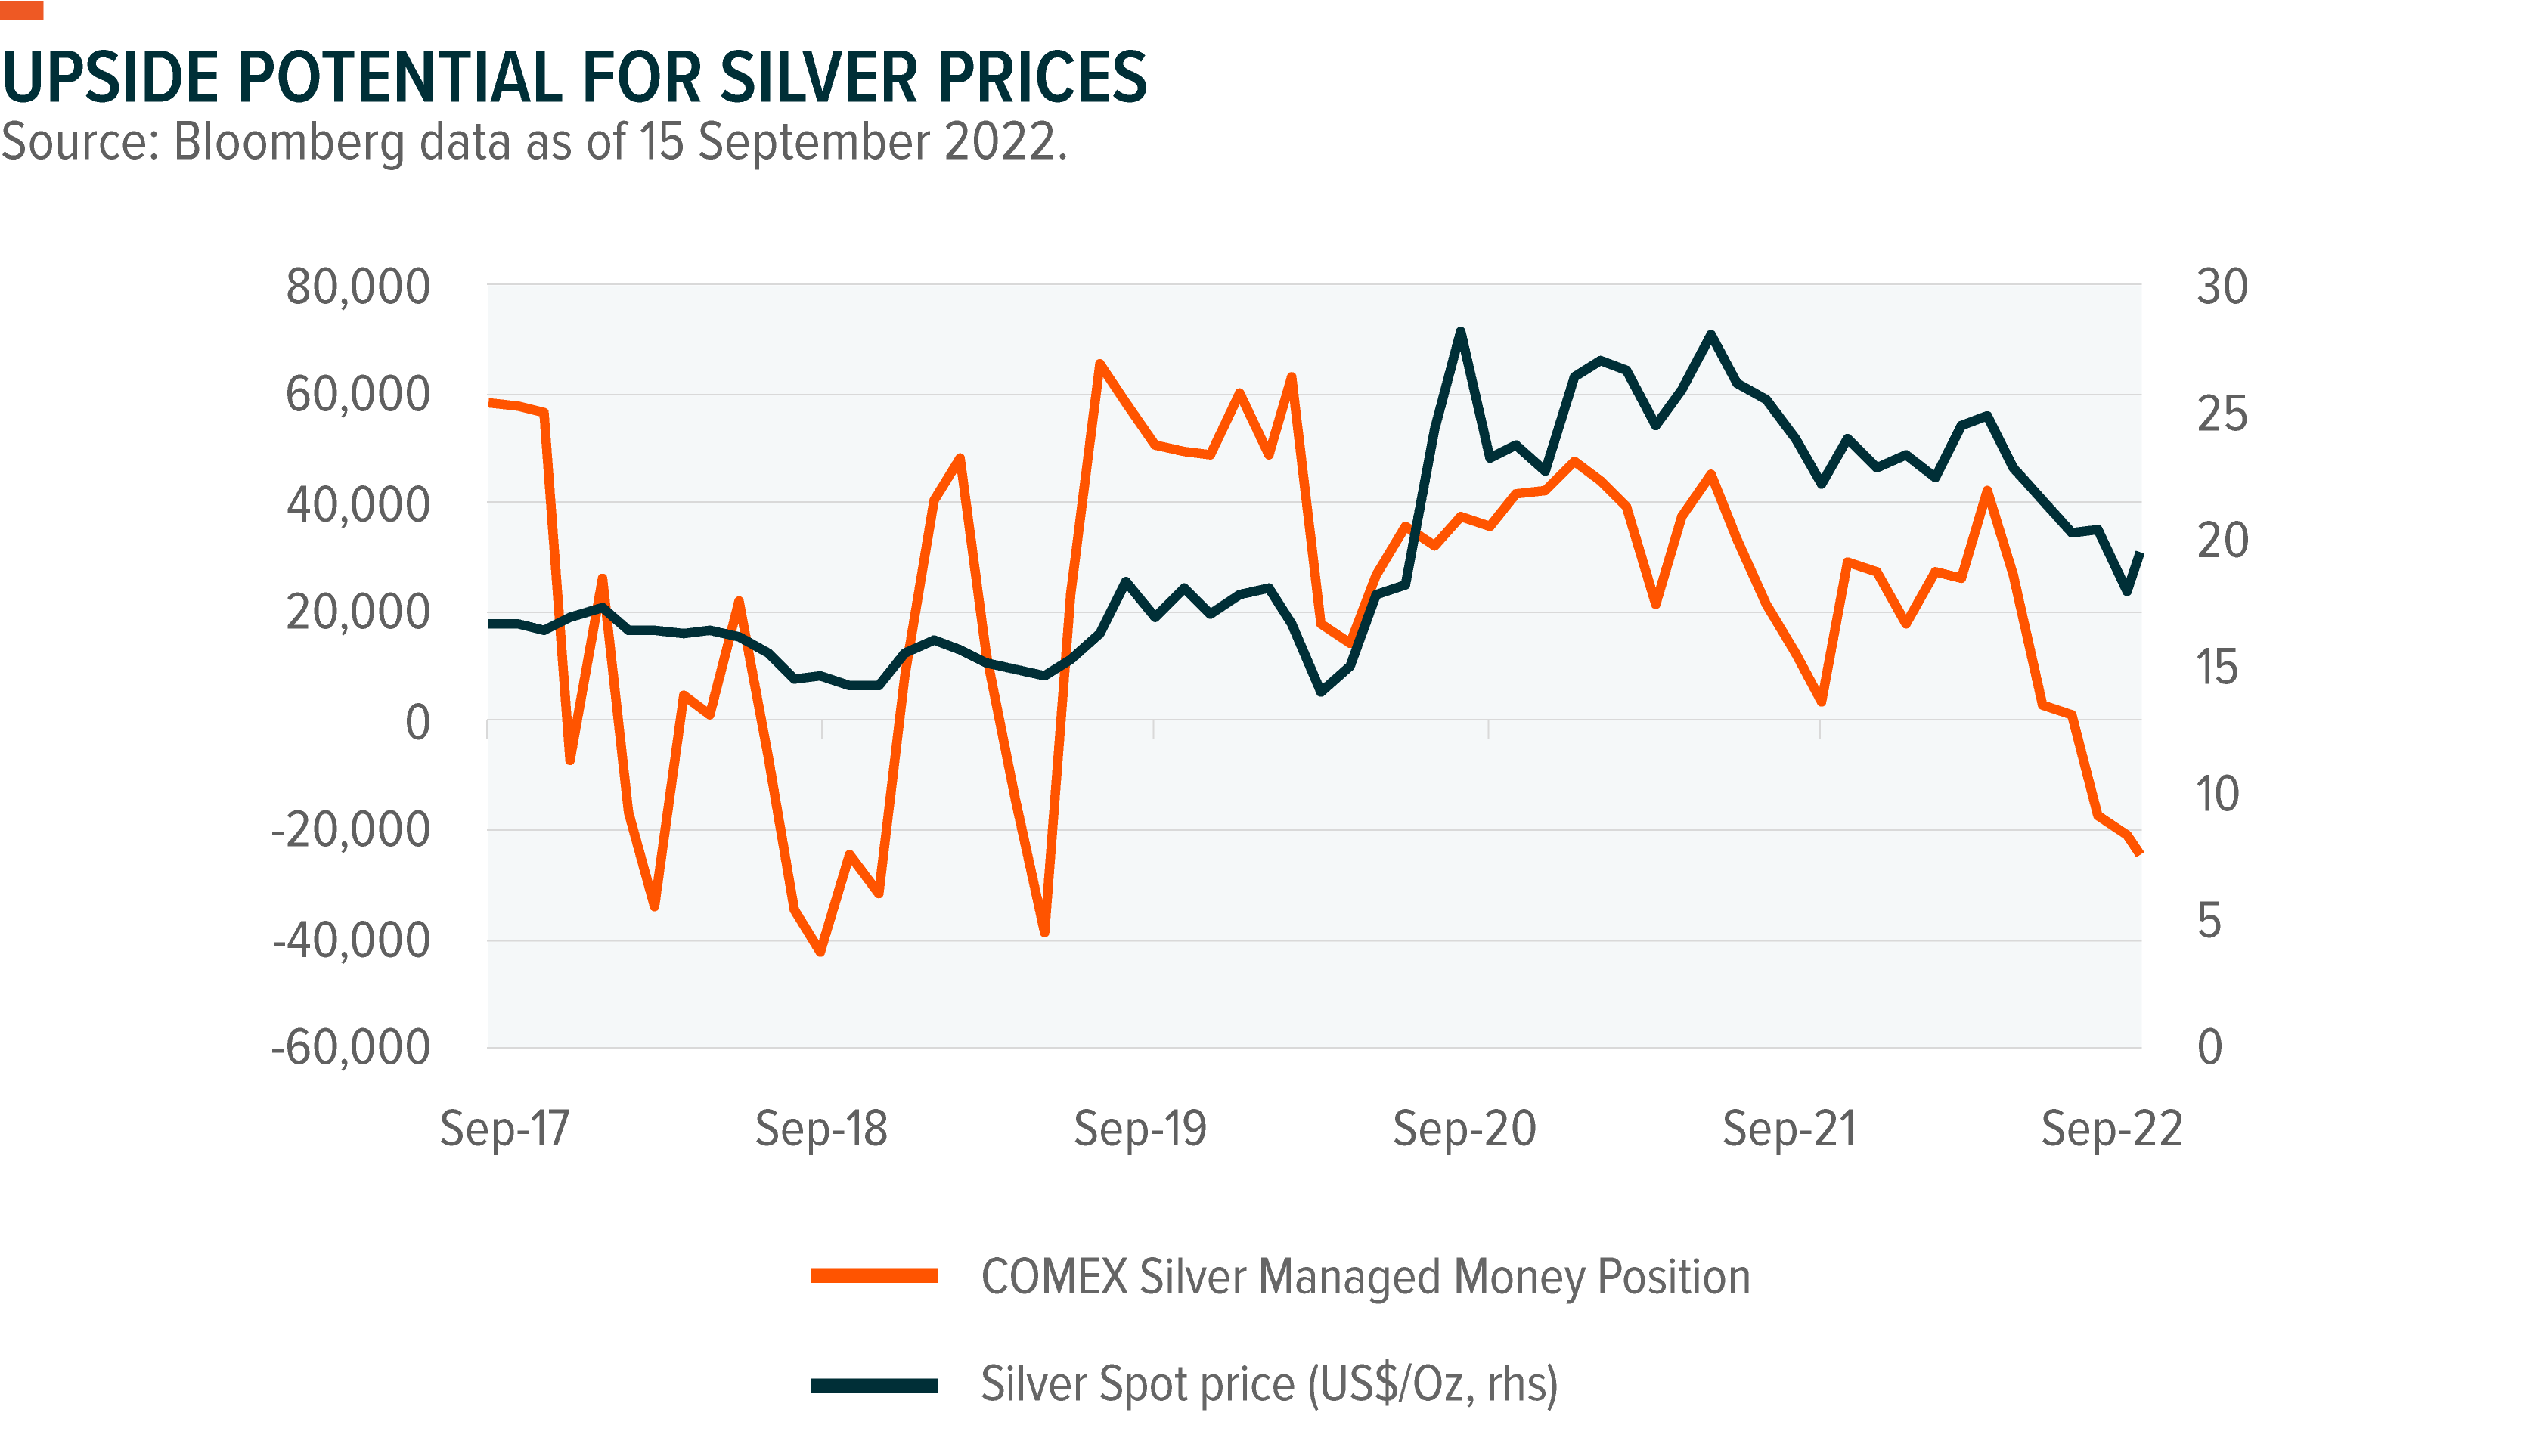
Over the last five years, when net speculative position went negative, silver prices rebounded 4% on average in the following 2–3 months.19
While silver prices are now at their five-year average, silver miners’ stock prices look undervalued. The average price-to-earnings ratio for silver miners is 17% lower than its five-year average of 30x versus 36x.20 Silver miners’ fundamentals are better than their stock prices suggest. Despite the large drop in silver prices and surging inflationary costs that made for a challenging Q2 2022, silver mining earnings remained relatively robust with sales growth of 6.3% year-over-year (yoy) and a profit margin of 5.7%.21
The revenue estimate for the companies in the Solactive Global Silver Miners Total Return v2 Index is down 3.7% yoy for 2022, but analysts predict a strong rebound in 2023 to 22.4% yoy.23 Currently, the aggregate rating of market sentiment for silver miners is 4.3, building up from its pre-pandemic level of 3.9.22 This rating ranges between 1 and 5, with 5 a bullish signal and 1 a bearish signal.
Silver mining stocks offer leverage because they tend to outperform the metal when prices rise and underperform when prices decline. The main trigger for a breakout to the upside would be a marked economic slowdown, a scenario that seems increasingly likely in the medium term.