 Rohan Reddy
After a brief period of stabilization during the summer, midstream performance turned negative as we entered the final quarter of the year. While some of the negative pressure can likely be attributed to shifts in asset allocation and tax loss harvesting, other factors have certainly been at play. In this quarter’s MLP insights, we’ll address some of the more pressing topics in the space, including:
- Weakening oil prices, supply concerns, & OPEC1
- Basin differentials & midstream correlations to oil prices
- An update on the MLP shift to the C-Corp structure and the existing landscape
Oil Prices & Supply
The most significant recent event in the energy space has been the swift selloff in oil. US prices peaked at $76 a barrel in early October before plummeting to $53 in a little over a month.2 The rapid selloff was a result of both weakening demand and increasing supply. Slowing global growth, particularly from China, the world’s largest oil importer, coupled with a stronger dollar, tapered demand expectations. But arguably more impactful were the increases in global oil output and a resulting domestic inventory buildup.
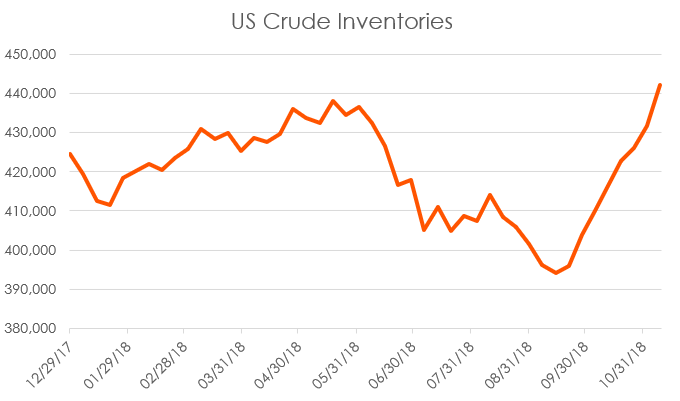
Source: Bloomberg. Data from 12/29/17 to 11/9/18. Data is in 1000’s of barrels.
As US oil production soared to record highs, OPEC also announced greater production figures driven by increases from Saudi Arabia, stability in Libya, and export waivers for Iran. Together, the US and OPEC flooded the market with oil that could not be absorbed by excess demand, causing prices to tumble.
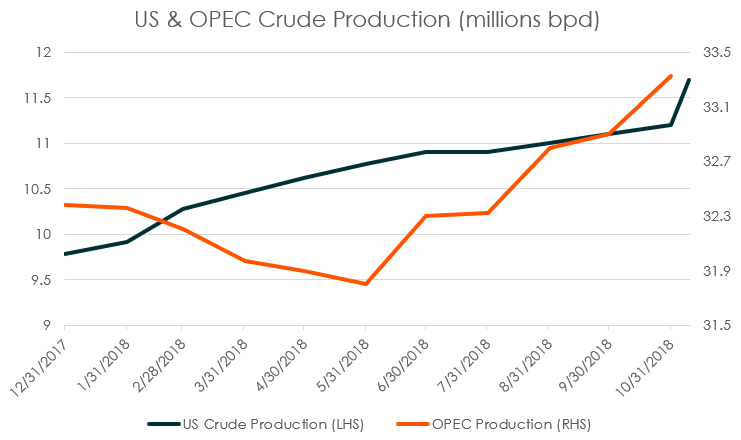
Source: Bloomberg. Data from 12/29/17 to 11/9/18 for US production. Data from 12/29/17 to 10/31/18 for OPEC data. Data in millions of barrels.
With US production expected to average over 12 million barrels a day in 2019, OPEC will face challenging decisions around output levels to keep prices high and not lose too much market share.3 OPEC’s next meeting in early December might be their most critical meeting since two years ago when they enacted production cuts for the first time in eight years. Saudi Arabia has already committed to cut 500,000 barrels in December, but additional cuts amounting to another million barrels per day will likely be needed to return stability to the oil markets.
On the flip side, while oil prices have been falling, natural gas prices have been a bright spot. Gas spot prices are up 42% in Q4, trading well over $4 per million British thermal units (MMBtu) in the back half of November due to low inventories and colder weather patterns raising demand for natural gas.4 Despite strong price appreciation, natural gas-related MLPs and C-corp equities have not benefitted from the rally with many demonstrating negative performance. Due to the seasonal aspect of natural gas demand and its volatile trading nature, it’s possible the market does not see a sustained period of higher natural gas prices and therefore is not ascribing significantly more value to natural-gas related infrastructure.
Basin Differentials & Midstream Correlations with Oil
An area of frustration this year has been the perception that midstream equities appear to be negatively impacted by falling oil prices, but not benefitting from positive moves. We believe this could be driven by near-term pipeline capacity constraints. As we discussed last quarter, pipelines across the US are full. While rising oil prices should cause production to increase, most pipelines cannot take on additional barrels. The market may perceive this as creating a revenue ceiling for midstream firms without the addition of new projects. Yet these firms still maintain downside exposure should crude prices fall below breakeven levels that cause producers to scale back their output. This has led to unusual trading activities on midstream names; more of the downside to oil markets is being captured by midstream firms and less of the upside. This hasn’t been limited to just MLP names either; C-Corps have been hurt by this trend as well.
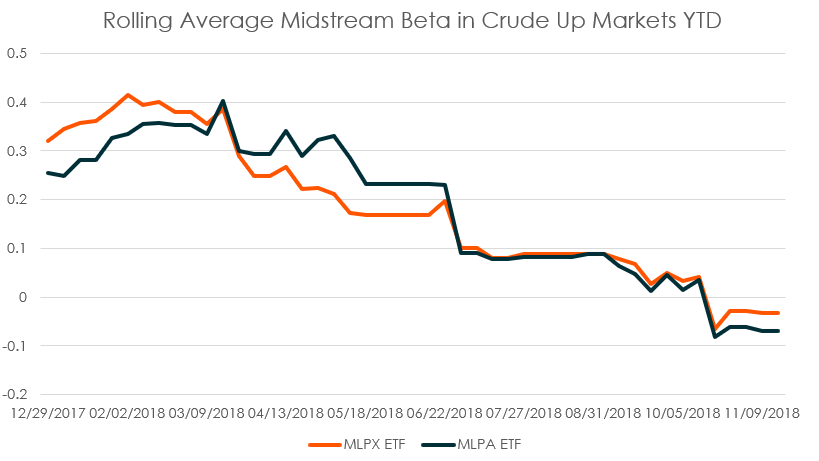
Source: Bloomberg. Data from 12/29/17 to 11/16/18. Beta measured weekly. Beta measured by Global X MLP & Energy Infrastructure ETF (MLPX) and Global X MLP ETF (MLPA) against the WTI Cushing Oil prices. MLPX ETF includes broad midstream asset class, including C-Corps, General Partners, & MLPs. MLPA ETF only includes midstream structured MLPs. Beta is calculated using average 12-month weekly betas during crude oil bull market periods.
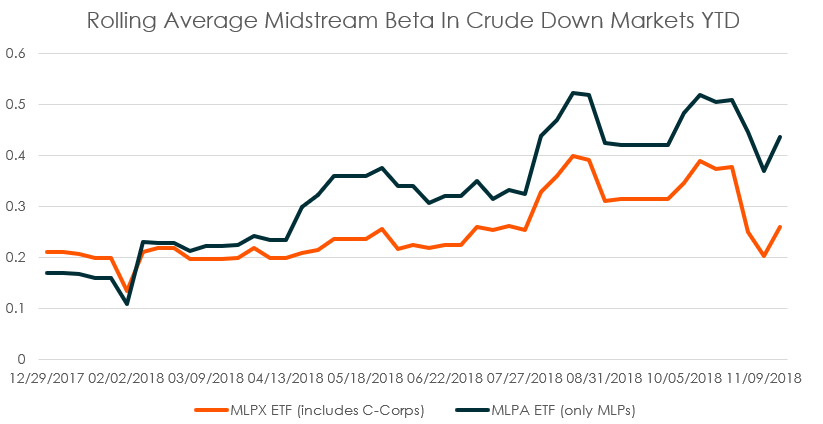
Source: Bloomberg. Data from 12/29/17 to 11/16/18. Beta measured weekly. Beta measured by Global X MLP & Energy Infrastructure ETF (MLPX) and Global X MLP ETF (MLPA) against the WTI Cushing Oil prices. MLPX ETF includes broad midstream asset class, including C-Corps, General Partners, & MLPs. MLPA ETF only includes midstream structured MLPs. Beta is calculated using average 12-month weekly betas during crude oil bear market periods.
Compounding the issue is that capacity-constrained basins are seeing their price differentials widen as they struggle to transport oil out of their region. The problems are not limited just to the fast growing Permian; differentials are also widening considerably in the Bakken region. Energy Transfer executive Tom Long highlighted this dynamic when he commented on the company’s decision to raise capacity on their Dakota Access pipeline system from 525k bpd to 570k bpd, “recent differentials and continued basin growth highlights the need for additional takeaway capacity out of the basin.”
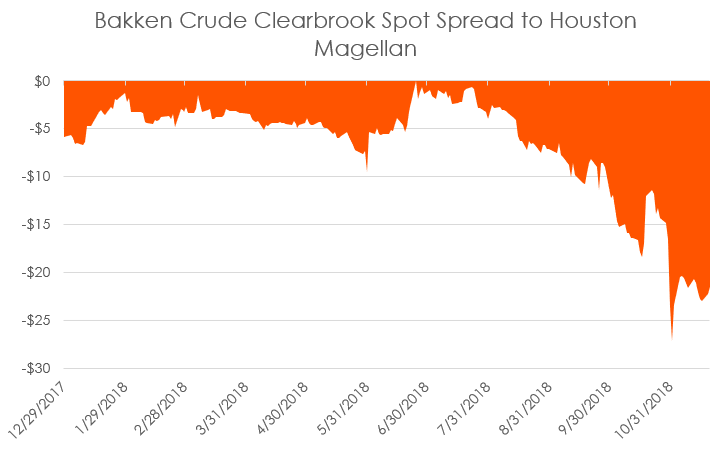
Source: Bloomberg. Data from 12/29/17 to 11/20/18.
Some drillers are turning to alternatives to pipelines, such as truck and rail, to move additional output rather than being forced to sell at a substantial discount. However, even truck and rail capacity is in many cases tapped out. Another option for producers is to scale back their production in the near-term, waiting for capacity to open with new pipeline projects coming online and differentials to narrow. Yet record high oil production figures suggest this is not meaningfully happening.
So, how do these issues with limited upside for midstream firms and price differentials for drillers get fixed? Simply put, more pipeline capacity is needed. Permian differentials began to tighten considerably beginning in September when Plains All American decided to bring their Sunrise expansion pipeline into service in Q4, which was earlier than expected. The expansion is expected to add an additional 500k bpd in capacity and became operational in early November. More projects like this could help even out oil prices across basins and open up new revenue growth opportunities for midstream entities, thereby allowing the industry to participate in further output growth.
MLPs Continue to Shift to the C-Corp Structure
The trend of MLPs converting to the C-Corp structure continued through Q4. Notable transactions in the second half of 2018 include the roll-ups that affected Antero Midstream, Enlink Midstream, Dominion Energy Midstream, & Valero Energy Partners. The shift to the C-Corp structure is now moving the breakdown of the energy infrastructure universe closer to even split between C-Corps and MLPs.
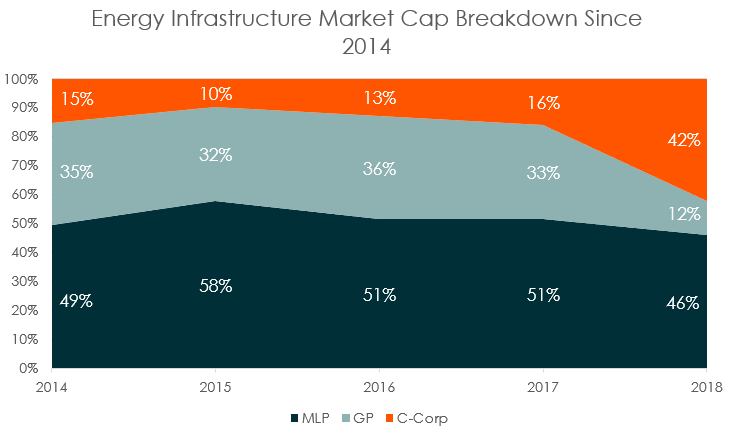
Source: Global X Research based on Bloomberg data. Data between 2014 to 2017 is as of year-end. Data for 2018 is as of 11/19/18. Data for public US exchange listed companies domiciled in the US & Canada. Data assumes all announced transactions close.
A common question around these conversions is whether entities that converted to a C-corp performed better than MLPs. To analyze this, we examined two time frames, the midstream bull market earlier in the year after bottoming out post-Federal Energy Regulatory Commission (FERC) ruling and then the period of broad negative midstream performance beginning in mid-Q3, when midstream equities experienced a downturn.
The answer is not quite as clear-cut as investors may hope. During the bull market period, MLPs outperformed those MLPs that converted to C-corps. But some of those companies have significant natural gas exposure and their performance was likely affected by the negative sentiment around the FERC ruling.
During the bear market period a handful of the newly formed C-corps outperformed the broad MLP index, although with negative returns. These outperformers were also those with significant natural gas pipeline exposure, which unlike oil, experienced a price increase during the bear market. It is in our opinion that underlying commodity exposure can therefore be a larger driving force in the performance of newly formed C-Corps than their restructuring.
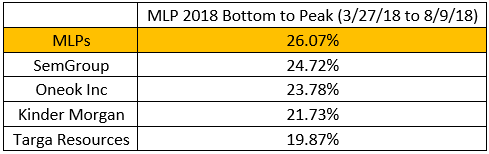
Source: Bloomberg. Data from 3/27/18 to 8/9/18. MLPs measured by Solactive MLP Infrastructure Index. Data period measured MLP trough to peak during this period. C-corps listed are companies that had already closed C-corp transactions prior to 3/27/18.
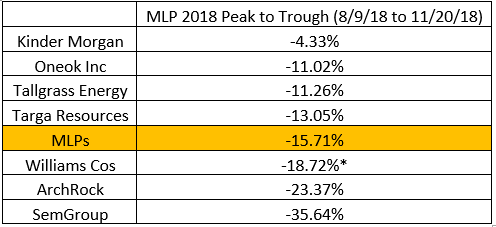
*Data from 8/13/18 to 11/20/18 due to Williams transaction close on 8/13/18.
Source: Bloomberg. MLPs measured by Solactive MLP Infrastructure Index. Data period measured MLP peak to trough. C-corps listed are companies that had closed C-corp transactions prior to 8/9/18, Williams Cos closed their transaction on 8/13/18. Performance data for Williams Cos is from 8/13/18 to 11/20/18.
Conclusion
The midstream space has suffered from potentially softer growth expectations due to pipeline constraints, but we also believe investor sentiment has weakened due to falling oil prices and tax loss harvesting within the broader energy sector. Energy has been the worst performing sector in the S&P 500 in 2018, and end of year portfolio adjustments has likely weighed on midstream stocks. Despite these pressures, we believe the underlying fundamentals and valuations of MLPs remain compelling, but most important will be a stabilizing macro picture for oil coupled with additional pipeline capacity coming online to unlock additional upside potential for the space.
Related ETFs
MLPA: The Global X MLP ETF invests in some of the largest, most liquid midstream Master Limited Partnerships (MLPs).
MLPX: The Global X MLP & Energy Infrastructure ETF is a tax-efficient vehicle for gaining access to MLPs and similar entities, such as the General Partners of MLPs and energy infrastructure corporations.
Please click the fund names above for current fund holdings. Holdings are subject to change.