Articles

MLP Monthly Report: May 2021

May 17, 2021

The May MLP Monthly Report can be found here offering insights on MLP industry news, the asset class’s performance, yields, valuations, and fundamental drivers.

The latest quarterly MLP Insights piece providing analysis into the midstream space can be found here as well.

Summary

News:

1) Oil majors are raising dividends and share buybacks as there is growing confidence in the economic recovery from the quick vaccine rollouts and increased travel demand. BP (BP) is planning to buy back $500 million of shares in the second quarter, Chevron Corp (CVX) is raising its quarterly dividend by nearly 4%, and Royal Dutch Shell (RDS) and Marathon Oil Corp (MRO) are raising their dividends by 4% and 33% respectively.

2) International Energy Agency (IEA) raised its world oil demand estimate by 5.7 million barrels a day for 2021 which is 230,000 b/d more than previously forecasted, as vaccine rollouts are gathering pace and the global economy appears to be on a better footing. Still, IEA also expressed concerns about rising cases in Europe, Brazil, and the U.S., which might affect the progress.

3) CenterPoint Energy, Inc. (CNP) and OGE Energy Corp (OGE), the two largest unitholders of Enable Midstream Partners, LP (ENBL) with a stake of approximately 79%, have consented to the merger between Energy Transfer LP (ET) and ENBL. ENBL is requesting remaining common unitholders to approve the merger and the transaction is expected to close by mid-2021.

Sources: Reuters, CNBC, Financial Times, Enable Midstream Partners, LP

Performance: Midstream MLPs, as measured by the Solactive MLP Infrastructure Index, increased 7.10% last month. The index has increased by 45.19% since last April. (Source: Bloomberg)

Yield: The current yield on MLPs stands at 8.52%. MLP yields remained higher than the broad market benchmarks for High Yield Bonds (4.79%), Fixed Rate Preferreds (4.22%), Emerging Market Bonds (3.94%), and Investment Grade Bonds (2.22%).1 MLP yield spreads versus 10-year Treasuries currently stand at 6.75%, higher than the long-term average of 5.72%.2 (Sources: Bloomberg and Fed Reserve)

Valuations: The Enterprise Value to EBITDA ratio (EV-to-EBITDA), which seeks to provide more color on the valuations of MLPs, increased by 2.26% last month. Since April 2020, the EV-to-EBITDA ratio is up by approximately 9.28%. (Source: Bloomberg)

Crude Production: The Baker Hughes Rig Count increased to 440 rigs, increasing by 23 rigs from last month’s count of 417 rigs. US production of crude oil decreased to 10.900 mb/d in the last week of April compared to March levels of 11.100 mb/d. (Source: Baker Hughes & EIA)


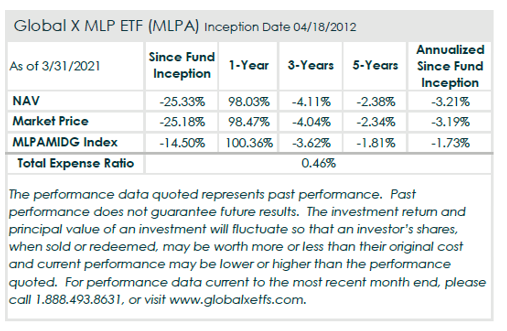
For performance data current to the most recent month- and quarter-end, please click here

As of 4/30/2021, Enable Midstream Partners, LP (ENBL) was a holding in the Global X MLP & Energy Infrastructure ETF (MLPX) with a 0.26% weighting. Energy Transfer LP (ET) was a holding in the Global X MLPA ETF (MLPA) with a 9.61% weighting and MLPX ETF with a 5.03% weighting.

MLPX ETF and MLPA ETF do not have any holding in BP (BP), Chevron Corp (CVX), Royal Dutch Shell (RDS), Marathon Oil Corp (MRO), CenterPoint Energy, Inc. (CNP) and OGE Energy Corp (OGE).

Category: Reports

Topics: Income, MLPs

Investing involves risk, including possible loss of principal. In addition to the normal risks associated with investing, international investments may involve risk of capital loss from unfavorable fluctuation in currency values, from differences in generally accepted accounting principles or from economic or political instability in other nations. Investments in securities of MLPs involve risk that differ from investments in common stock including risks related to limited control and limited rights to vote on matters affecting the MLP. MLP common units and other equity securities can be affected by macro economic and other factors affecting the stock market in general, expectations of interest rates, investor sentiment towards MLPs or the energy sector, changes in a particular issuer’s financial condition, or unfavorable or unanticipated poor performance of a particular issuer (in the case of MLPs, generally measured in terms of distributable cash flow). The Fund invests in the energy industry, which entails significant risk and volatility. In addition, the Fund is non-diversified which represents a heightened risk to investors. Furthermore, the Fund invests in small and mid-capitalization companies, which pose greater risks than large companies. MLPA has a different and more complex tax structure than traditional ETFs and investors should consider carefully the significant tax implications of an investment in the Fund. The Funds are non-diversified. Current and future holdings are subject to risk.

MLPA is taxed as a regular corporation for federal income tax purposes, which differs from most investment companies. Due to its investment in MLPs, the fund will be obligated to pay applicable federal and state corporate income taxes on its taxable income as opposed to most other investment companies. The fund expects that a portion of the distributions it receives from MLPs may be treated as tax-deferred return of capital. The amount of taxes currently paid by the fund will vary depending on the amount of income and gains derived from MLP interests and such taxes will reduce an investor’s return from an investment in the fund. The fund will accrue deferred income taxes for any future tax liability associated certain MLP interests. Upon the sale of an MLP security, the fund may be liable for previously deferred taxes which may increase expenses and lower the fund’s NAV. The potential tax benefits from investing in MLPs depend on them being treated as partnerships for federal income tax purposes. If the MLP is deemed to be a corporation then its income would be subject to federal taxation at the entity level, reducing the amount of cash available for distribution to the fund which could result in a reduction of the fund’s value. The index however is calculated without any deductions for taxes. As a result, the Fund’s after tax performance could differ significantly from the index even if the pretax performance of the Fund and the performance of the index are closely correlated.

Bonds and bond funds will decrease in value as interest rates rise. High yield bonds involve greater risks of default or downgrade and are more volatile than investment grade securities, due to the speculative nature of their investments. In addition to the normal risks associated with investing, real estate and REIT investments are subject to changes in economic conditions, credit risk and interest rate fluctuations. Emerging markets involve heightened risks related to the same factors as well as increased volatility and lower trading volume. Preferred stock is subject to many of the risks associated with debt securities, including interest rate risk. In addition, preferred stock may not pay a dividend, an issuer may suspend payment of dividends on preferred stock at any time, and in certain situations an issuer may call or redeem its preferred stock or convert it to common stock.

U.S. Treasury securities are considered to be of high credit quality and are backed by the full faith and credit of the U.S. government. U.S. Treasury securities, if held to maturity, guarantee a return of principal while no other securities mentioned in this material offer such a guarantee.

Carefully consider the fund’s investment objectives, risk factors, charges, and expenses before investing. This and additional information can be found in the fund’s full or summary prospectus, which may be obtained by calling (1.888.493.8631), or by visiting globalxetfs.com. Read the prospectus carefully before investing.

Shares of ETFs are bought and sold at market price (not NAV) and are not individually redeemed from the Fund. Brokerage commissions will reduce returns. Beginning October 15, 2020, market price returns are based on the official closing price of an ETF share or, if the official closing price isn’t available, the midpoint between the national best bid and national best offer (“NBBO”) as of the time the ETF calculates current NAV per share. Prior to October 15, 2020, market price returns were based on the midpoint between the Bid and Ask price. NAVs are calculated using prices as of 4:00 PM Eastern Time. The returns shown do not represent the returns you would receive if you traded shares at other times. Indices are unmanaged and do not include the effect of fees, expenses or sales charges. One cannot invest directly in an index. Index data source: Solactive AG.

This information is not intended to be individual or personalized investment or tax advice. Please consult a financial advisor or tax professional for more information regarding your tax situation.

Global X Management Company, LLC serves as an advisor to the Global X Funds. The Funds are distributed by SEI Investments Distribution Co. (SIDCO, 1 Freedom Valley Drive, Oaks, PA, 19456), which is not affiliated with Global X Management Company LLC or Mirae Asset Global Investments. Solactive Indexes have been licensed by Solactive AG for use by Global X Management Company, LLC. Global X Funds are not sponsored, endorsed, issued, sold, or promoted by Solactive AG nor does this company make any representations regarding the advisability of investing in the Global X Funds.