 Pedro Palandrani
On January 13th, we introduced the Global X Adaptive U.S. Risk Management ETF (ONOF) on NYSE. ONOF seeks to provide a risk management solution by employing four technical indicators to dictate whether the Fund is participating in the U.S. equity markets or in a defensive stance in short term treasuries.
In this post, we interviewed Patrick Bobbins, Director of Investments & Research at Adaptive Wealth Strategies, about the Adaptive Wealth Strategies U.S. Risk Management Index (AWSRSK), which ONOF tracks.
What is the U.S. Risk Management Index’s strategy and how does it work?
The core goal of the strategy is focused on risk management, while a secondary goal is to remain invested in equities as much as possible. The strategy is designed to maintain exposure to the equity markets when the trending environment is positive, and then move to a risk off position when that trend reverses. Determination of the trending environment utilizes four different indicators. Our concept employs a moving average, drawdown, moving average convergence divergence (MACD), and volatility as indicators to move between equity and fixed income (“risk-off”) exposure. The end goals of the strategy are to remain invested in equities as much as possible, achieve a low tracking-error, have minimal internal expenses, provide significant risk mitigation, while still producing alpha generation.
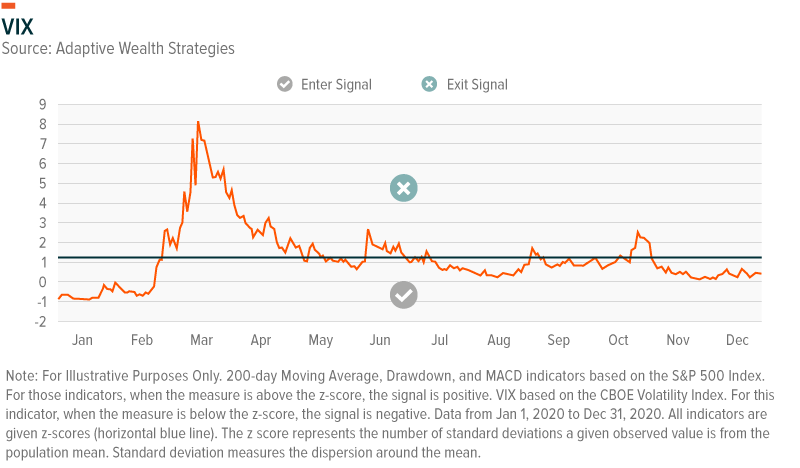
What are the four signals that determine whether the strategy holds equities or not?
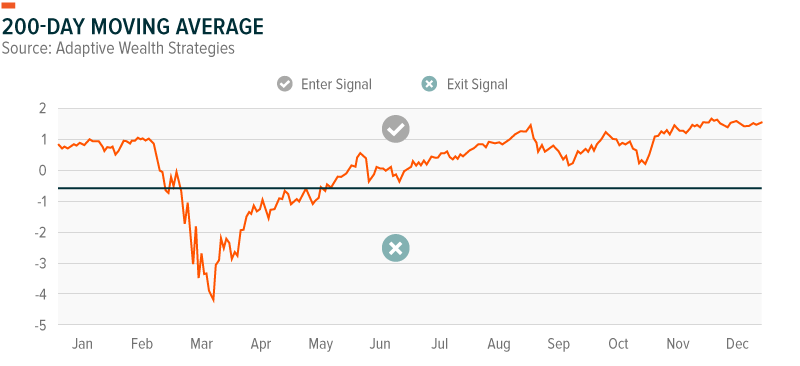
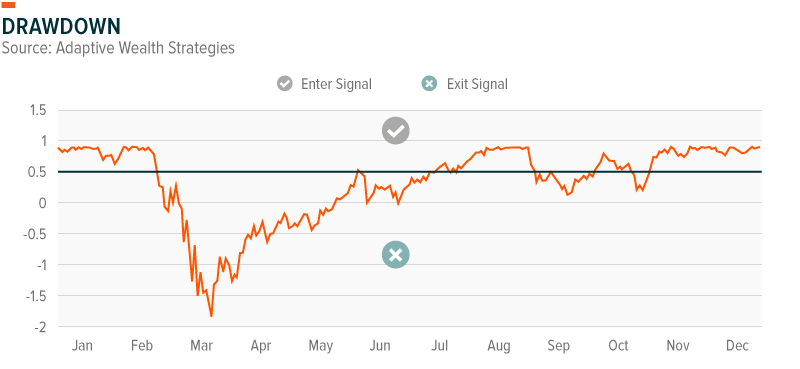
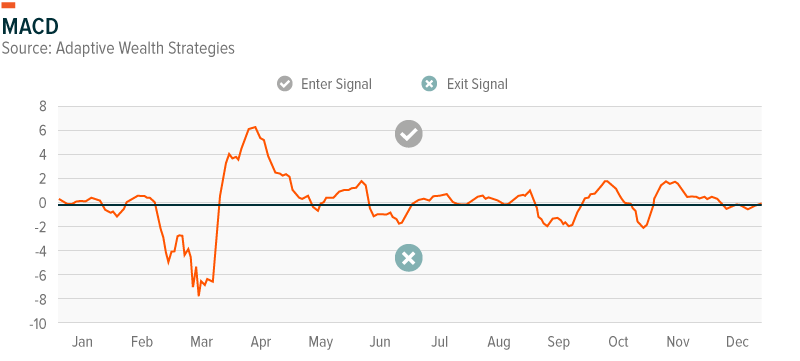
The strategy uses four indicators, incorporating two somewhat shorter-term and two somewhat longer-term indicators. The two short-term indicators are MACD and Volatility. The two longer-term indicators are the 200-day moving average and drawdown.
Longer Term Indicators:
- The 200-day average is designed to detect longer-term trends in the market and used to provide stability, as this trend doesn’t change significantly from day to day.
- Drawdown has its roots in the behavioral side of investing. We measure the absolute drawdown from the prior high-point in the market as an indicator. This indicator potentially indicates the market is headed toward a longer-term trend downward.
Shorter Term Indicators:
- MACD is designed to capture short-turning points in the market both up and down. The MACD can be one of the first technical indicators to signal a risk-off environment. MACD is a momentum indicator, reflecting the spread between the 12-period exponential moving average (EMA) and the 26-period EMA. A positive spread between the two EMAs indicates upward momentum, while a negative spread indicates downward momentum.
- Volatility is also short-term in nature and can signal heightened uncertainty in the markets which tends to favor a risk off approach.
Why utilize four signals instead of just one or two?
One of the alternative goals in the strategy is to avoid a whipsaw effect caused by false-signals as much as possible. As with any trend-following models, the potential to exit and enter the markets at the wrong time certainly exists. The strategy relies on a confirmation of signals instead of relying on just one indicator. We feel this has two main positives compared to strategies which rely on just one indicator. The first positive is the potential ability to exit the equity market earlier in a risk-off environment. The second positive is the potential ability to remain invested more of the time. As the strategy relies on a confirmation of three out of the four indicators to exit the equity markets, there is a higher hurdle to be reached to make a risk-off decision. It will also be quicker to react to a positive changing environment as two of the exit indicators turn back to positive.
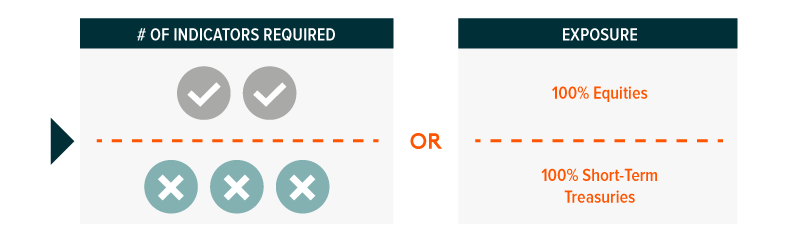
Three out of Four to Exit, Two out of Four to Enter
Which market environments do you expect this strategy to work well in?
We believe this strategy should work well in three environments and potentially struggle in one.
- Let’s start with where it could struggle. A prolonged sideways market with multiple small moves up and down paired with high levels of volatility. The strategy is likely to be in a risk-off mode during much of that time and has the potential to re-enter at an inopportune time as the market struggles to find direction. Calendar years 2011 and 2015 would be good examples of where we think this strategy may not perform well.
- Where we believe this strategy could thrive is in a prolonged drawdown that lasts several years, such as the 2000-2003 and 2007-2009-time frames. These markets were plagued with a slow, steady grind lower, spurts of high volatility, and brief relief rallies. Given the combination of indicators, the strategy is likely to shine in periods of prolonged drawdowns. The indicators that are likely to signal an exit in this environment would be drawdown and 200-day average, paired with at times either volatility or MACD.
- The other market environment that we expect this strategy to do well in is quicker, more violent drops in the market, such as early 2020. The short-term indicators of MACD and Volatility are expected to potentially quickly identifying the changing environment, then once a limit on the drawdown is triggered, the strategy will look to exit the market. This short-term market drop has the potential to take place when the market is trading far above a long-term trend indicator such as the 200-day average. This is one of the reasons why a confirmation of signals is important compared to relying on simply one long-term indicator.
- The final environment this has the potential to do well in is a long-term upward trending market, as well as early stages of a bull market, immediately proceeding a large drop. Keep in mind the strategy also has a few re-entry signals designed to re-engage the portfolio after certain extreme drops, heightened spikes of volatility, or quick trend changes occur. These extreme re-entry signals have the potential to re-engage the portfolio quicker after a deep market drop compared to simply relying on the market to recover up to a long-term 200-day moving average.
How does the strategy fit in a portfolio?
This strategy could fit well into the part of the portfolio where the manager would ordinarily look to trim equity exposure during risk-off environments. As this strategy is housed inside an ETF, the tax implications of selling equities to move to treasuries are potentially reduced. This helps the manger both reduce risk and potentially limit taxable gains. This is a great complement to broad core allocations, as this will act as a risk reduction tool inside the portfolio.
Definitions:
- Volatility: Volatility, defined as the standard deviation of returns, measures the dispersion of strategy returns around their mean.
- Correlation: Statistic that measures the degree to which two securities move in relation to each other.
- Alpha: Excess return versus a traditional benchmark index.
- Drawdown: Measures the decline from a historical peak and it’s usually referred to in percentage figures.
- 200-day Moving Average: Moving Average forms a trend-following indicator by smoothing the price data. It is calculated by adding up the closing prices for each of the last 200 days and then dividing by 200.
- Moving Average Convergence Divergence: is a momentum indicator which tracks trend and shows the relationship between two exponential moving averages (EMA) of a security’s price. The MACD line reflects the spread between the 12-period EMA and the 26-period EMA.
- VIX: The VIX Index is a financial benchmark designed to be an up-to-the-minute market estimate of expected volatility of the S&P 500 Index, and is calculated by using the midpoint of real-time S&P 500® Index (SPX) option bid/ask quotes. More specifically, the VIX Index is intended to provide an instantaneous measure of how much the market thinks the S&P 500 Index will fluctuate in the 30 days from the time of each tick of the VIX Index.
- Exponential Moving Average (EMA): The Exponential Moving Average (EMA) is a type of moving average that places a greater weight and significance on the most recent data points, in order to reduce the lag of the Simple Moving Average (SMA). This acts as a smoothing function, removing short-term fluctuations to better view the prevailing trend.
Related ETFs
ONOF: The Global X Adaptive U.S. Risk Management ETF (ONOF) seeks to provide a risk management solution by employing four technical indicators to dictate whether the Fund is participating in the U.S. equity markets or in a defensive stance in short term treasuries.
Click the fund name above to view the fund’s current holdings. Holdings subject to change. Current and future holdings subject to risk.