 Michelle Cluver
Market sentiment seems to turn at warp speed these days. Hopes can be dashed as quickly as they come, with the market responding to the ultra-short news cycle. The result is an ever-present sense of uneasiness in the market. Oddly, Wall Street’s “fear gauge” remains low. The Chicago Board Options Exchange Volatility Index, commonly referred to as the VIX, reflects the market’s estimate of future volatility. Currently, the low levels of the VIX Index create a disconnect between volatility expectations and the market reality, leaving investors scratching their heads and closely monitoring their portfolios.
Tracking volatility
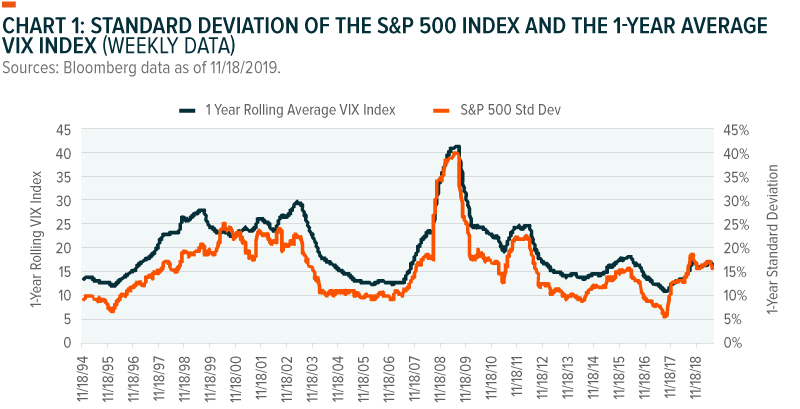
Using the last 24 months as something of a case study, we can see a trend beginning to emerge that breaks from historical patterns. This is the trend of standard deviation providing a higher reading on volatility relative to the VIX Index.
Standard deviation is a backward-looking metric that assesses the dispersion of return relative to its average return over a specified period. The VIX Index provides a market expectation of 30-day forward looking volatility. To make these two metrics more comparable, we looked at a 1 year rolling average of the VIX Index. Chart 1 reflects that the VIX Index has historically provided higher readings for volatility relative to the standard deviation of the S&P 500 Index. However, since the beginning of 2018, this has no longer been the case. During this period, the heightened volatility has reflected more in the standard deviation than the VIX Index.
The trend of standard deviation rising to the same level or slightly higher than the volatility reading provided by the VIX Index has typically only been seen during periods of extreme market turbulence such as the Global Financial Crisis or the Dot Com Crisis. This analysis will look into the factors driving this disconnect and how to position portfolios accordingly.
More Detailed Glance at the VIX Index
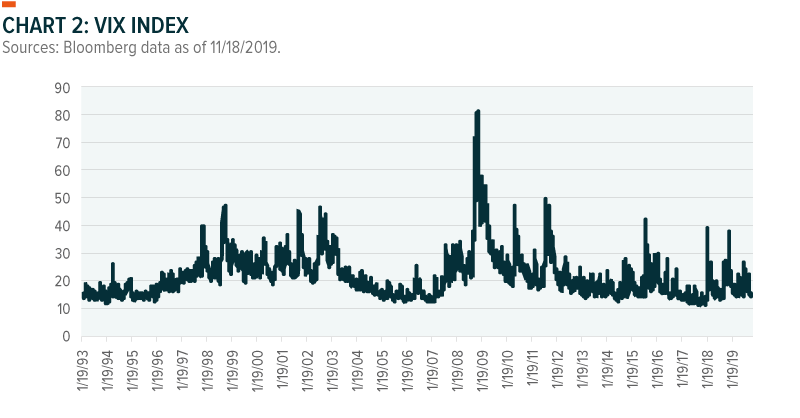
While the VIX Index has spiked above 35 twice since the start of 2018, it keeps returning to very low levels. This is what is driving the 1-year average VIX reading to appear less responsive to the current uncertainty than the standard deviation.
Currently the VIX Index is below 13. This is close to its all-time low of 9.14 that it reached in 4Q 2017. For perspective, the Global Financial Crisis brought the index as high as 80.8. Even relative to its long-term average of 19.0 and its two-year average of 15.8, the current reading around 13 seems low.
Market gaps have been larger and more frequent
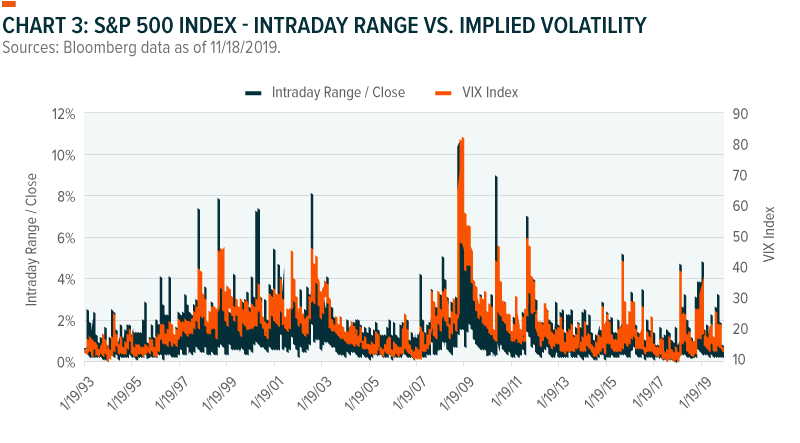
Stock moves feel large these days. But when analyzing the intraday range of the S&P 500 Index over the last year, we find that U.S. equities almost mirror the VIX’s path. This may give the impression that the VIX accurately depicts the volatility in the market. But if we consider the frequency and scale of market gaps, a different picture emerges.
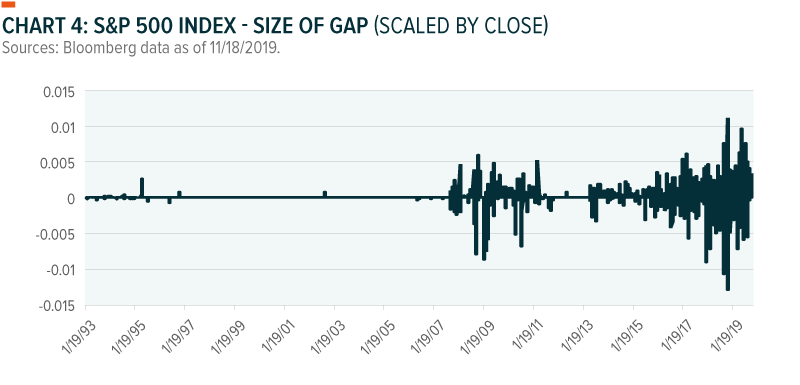
When we saw the broad market open outside of the previous day’s range at increased frequency and size, we decided to investigate further. We scaled chart 4 by the closing level to better indicate the magnitude of the gaps over time. One possible explanation for the growing frequency of gaps is that the market is becoming more correlated in the way that it reacts to information. During the last 2 years, information pertaining to the trade dispute has resulted in the market reacting in a more synchronized manner. Updates on the trade dispute has frequently occurred overnight which could be the cause of large market gaps that we are currently witnessing. These market gaps could be the culprit in making the market feel more volatile than what a traditional volatility gauge like the VIX indicates.
For perspective, there were very few gaps between 2000 and the 2008–09 Global Financial Crisis. During this crisis, there were a significant number of market gaps. However, the density and scale of market gaps during the Financial Crisis does not even come close to what is currently being recorded.
Of the 220 trading days thus far in 2019, 99 had market gaps. This seems like an extremely high number at a time when the VIX remains reasonably close to its lows.
Correlation, volatility and higher portfolio risk
Portfolio volatility can be reduced by constructing a diversified portfolio of securities and asset classes with low correlation to each other. However, assuming lower correlation between securities than what is actually the case can result in a portfolio taking on more risk than anticipated.
As mentioned earlier, the VIX Index is forward-looking while standard deviation is a backward-looking metric. In line with this, VIX uses the implied correlations between stocks within the S&P 500 Index while the standard deviation uses the realized correlations between those stocks. Currently we are seeing a disconnect in the correlations used within these two volatility approaches. The standard deviation reading is using a higher correlation and thus is reflecting a higher level of volatility in the market.
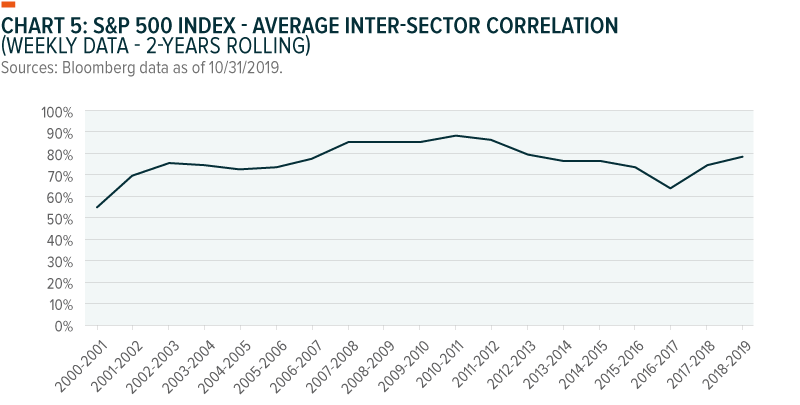
As reflected in chart 5, the average correlation between the GICS sectors within the S&P 500 Index is rising. In our view, this could be related to how the market is responding to information in unison. This is captured within the realized correlations utilized within standard deviation; however, the implied correlations used within the VIX Index reflect that correlations will reduce.
Portfolio Management Application
Until there is clarity on path towards a resolution of the US-China trade dispute, the market is likely to reflect a higher level of correlation than what is currently being reflected within the VIX Index. In line with this, we believe that standard deviation is currently providing a better reflection of the volatility of the S&P 500 Index. Within this type of environment, it is essential to think carefully about the correlation assumptions made within one’s portfolio construction. Now could provide a good opportunity to increase portfolio diversification in order to counteract the elevated correlations discussed above.
After taking into consideration the volatility assumptions for this market environment, always be mindful of your investment time horizon when making investment decisions. The noise of the market will always exist, focus on the long-term and invest accordingly.
Conclusion
The VIX Index remains an important metric to assess market volatility, but not the only metric. In our view, investors need to understand how and why the market reacts the way it does. Two factors—algorithmic trading and technology facilitating access to information—likely have a big say in the market moving in a more synchronized fashion – driving up realized correlations. The trick for investors is to learn how to filter all of these moves in an environment where sentiment and trends shift at an alarmingly fast rate.