Improved market breadth was a key component of our positioning outlook for 2025. Just seven names accounted for 58% and 54% of the market’s 2023 and 2024 return, respectively, while these same names drove most of the of the S&P 500s Q1 2025 decline (chart below). The market volatility at the beginning of 2025 sets up for a new market regime, one that is potentially more favorable for equity income investments.
Focusing on the equity income space, this is a diverse area that provides both income and the possibility for capital growth. These investments can include quality companies with growing dividends, higher-risk high-yield companies, preferred stocks that blend equity and fixed income features, and derivative strategies like covered calls. Equity income can also complement fixed income strategies, potentially enhancing diversification and total return. This whitepaper details yield-focused equity solutions and their potential portfolio applications for investors.
Key Takeaways
- Improving market breadth is potentially beneficial for high yielding market areas. Equity income solutions can provide dual benefits of income generation and potential capital appreciation.
- Stagflation risks have increased, highlighting the importance of careful portfolio positioning. There’s a wide range of equity income solutions that investors can use to create balanced portfolios that are suitable for multiple market environments.
- Equity income can be combined with fixed income to create a diversified yield focused strategy that can also benefit from capital appreciation without adding undue risk.
A New Market Regime
2025 started with a rotation away from the key areas that were central to the concentrated market rally of the last two years. While AI, Mag 7, and the tech sector led markets higher in the last few years, the current rotation makes way for strength in areas that provide better yield opportunities. As market breadth improved YTD, equal weight index has outpaced market cap weighted S&P 500 Index and value has outpaced growth (as of 3/31/2025). Additionally, market breadth has expanded on a global scale, with the U.S. market no longer being perceived as the only opportunity for growth.

Yield in a Promising yet Fragile Macro Environment
The recent market pivot is supportive for a wide range of equity income products. But equity income is a broad area, with products suited to different economic growth environments. The economy is currently at a crossroads, uncertainty has weighed on activity, but is this temporary or something more concerning? Thus far, survey data is weak, while hard economic data has continued to reflect resilience.
Stagflation concerns are rising. The Atlanta Fed’s GDPNow provides a concerning early reading on Q1 economic growth.1 However, this number will continue adjusting as more data becomes available. Similarly, the Fed’s updated economic projections reflected a substantial downward revision to 2025 economic growth expectations, from 2.1% in December to 1.7% in March.2
Slowing economic growth is balanced against inflation risks and the implications for policy rate expectations. The Fed has increased their near-term inflation expectations due to tariffs but believes that medium- and long-term inflation expectations remain well anchored. At this stage, there is minimal risk of a wage-price spiral. As such, this step up in inflation expectations may be short-lived. From an asset class perspective, equities are more sensitive to economic growth while fixed income markets are sensitive to inflation expectations. Elevated inflation expectations may limit the support the Fed can provide should the economy slide into recession.

The scenario table below outlines the typical relationship between asset classes and economic variables. The Fed’s dot plot reflects a median expectation of two rate cuts in 2025 while markets are pricing in closer to three cuts.3 We’re currently near peak uncertainty. As more data on the impact of tariffs become available, market expectations are likely to adjust. Continued economic resilience and higher than expected inflation may keep interest rates higher for longer. Conversely, we’ve already seen the Fed slow their quantitative tightening, and their framing of tariff inflation as transitory leaves the door open to reduce policy rates should the hard data confirm that economic growth has slowed meaningfully. At this stage the most likely scenario is slow real economic growth and a slow decline in policy yields that maintains real yields at a restrictive level. Here is a summary of positioning implications based on the current economic environment.
- Slowing economic growth warrants defensive exposure with a greater focus on quality.
- Current profitability and consistent dividend distributions to shareholders are critical.
- Longer duration assets become attractive as yields decline from peak levels.

Equity Income Building Blocks
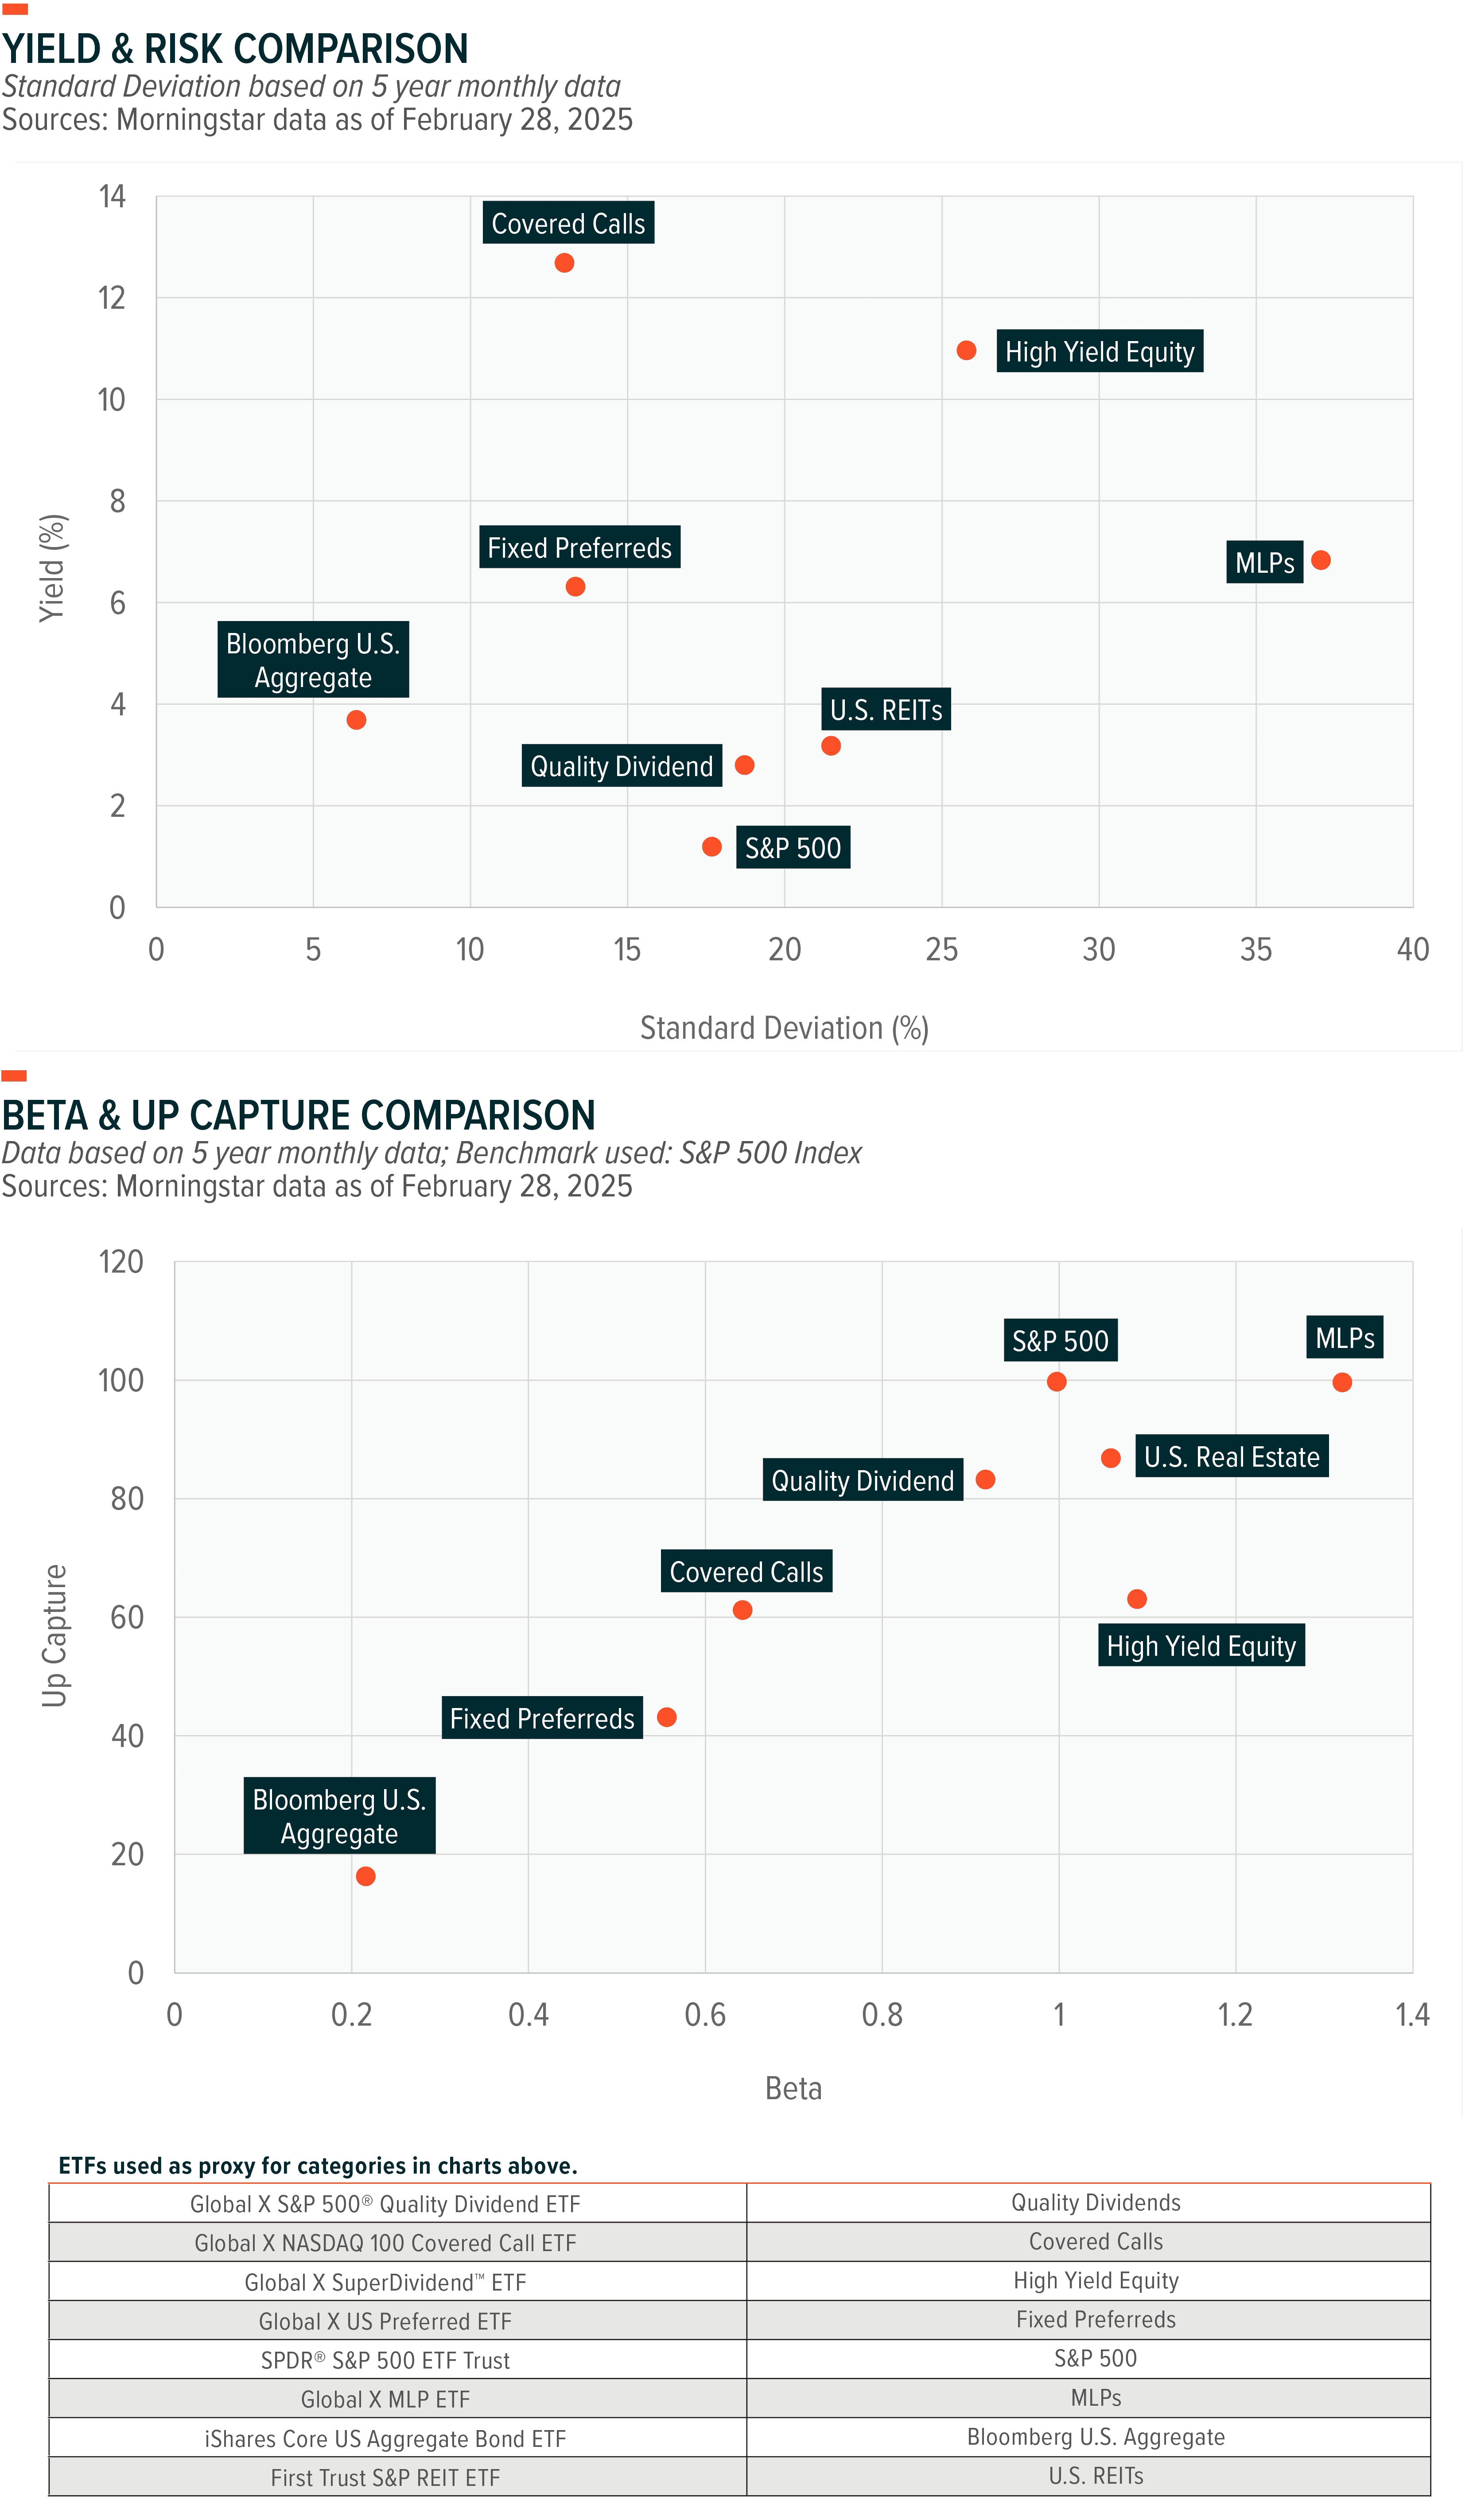
Equity income offers many solutions that can generate yield while providing upside potential in the current environment. Equity income can be obtained from common equity, preferred equity, or by using derivatives. The below risk and reward charts illustrate the tradeoff between yield, standard deviation, beta, and upside capture. For long term investors in search of yield, these are essential areas to balance within a portfolio.
Covered Calls Offer Differentiated Yield
Covered calls perform best when markets are rangebound, receiving premium income and potentially small improvements in the underlying equities while not having the underlying called. In a rising market, covered calls typically underperform the overall market because the underlying security is called away, affecting the capital gain return, not the income return. In a declining market, covered calls provide a small buffer of protection because of their premium income.
This return profile is reflected in the reasonably subdued beta and up capture ratio reflected on the chart above. While covered calls provide a good level of income that compensates for market volatility, within a portfolio this exposure should be complimented by areas that provided better up capture in a rising market.
Preferred Equity Offers Risk Mitigation with High Yield
Preferred are above common equity and below bondholders in the capital structure. We favor preferred equities due to their position in the capital structure and low beta. Within a portfolio that includes common equities, their lower sensitivity to equity markets aids in reducing portfolio volatility. The dividend on fixed rate preferreds remains stable relative to a reference rate, which can be beneficial in a falling rate environment. Additionally, the yield from preferred stocks can be treated as qualified dividend income instead of ordinary income, resulting in favorable tax treatment. It is important to remember that variable and fixed-rate preferreds have duration risk due to their perpetual nature.
The preferred equity market may face periods of heightened volatility during episodes of banking stress. As securities that are included in regulatory capital, banks are one of the largest issuers of preferreds. During normal market conditions, this is a boost for preferred credit quality. However, it also means that preferreds are impacted by the overall health of the financial system.
Common Equity Yield Strategies
Common equity can be used to augment a portfolio’s yield, target specific exposures, improve diversification, or add quality. The level of yield and volatility varies greatly across these different use cases.
Quality Dividends
We view the quality dividends segment as a core strategic holding because of its focus on profitable growth and quality value. Historically, companies with strong free cash flow and healthy balance sheets fare best among value factors during market downturns. BofA Securities research shows the risk of deep value strategies becomes increasingly pronounced during late-cycle and recession periods, while the quality factor can provide a timely hedge. This benefit played out during the March 2025 market pullback. Quality stocks typically provide a lower payout ratio relative to high yielding equities, but they focus on consistent dividends and dividend growth despite the economic environment. Therefore, quality stocks’ lower yield is less sensitive to economic changes.4 The current economic uncertainty prioritizes quality exposure.
High Dividend Yield, MLPs and REITs
Master Limited Partnerships (MLPs), which cover exploration, storage, and distribution of crude oil and natural gas, are compensated on volume growth, so profits tend to rise alongside higher demand. Strong volume growth is typically associated with higher energy prices. U.S. domestic oil production remained robust throughout 2024, averaging approximately 13.2 million barrels per day (bpd), a 2% increase from 2023.5 This growth underscores the country’s competitive edge in global energy markets and reflects its ongoing commitment to maintaining energy independence and dominance. Additionally, U.S. natural gas production experienced steady expansion, driven by its continued dominance as a key energy source and strong overseas demand supporting North America's LNG export market. The rapid growth of artificial intelligence (AI)-driven data centers has significantly increased electricity consumption, with natural gas serving as a primary energy source due to its reliability and cost-efficiency.6 At the same time, global demand for liquefied natural gas (LNG) continues to rise, with projections indicating a nearly 50% increase by 2040.7 The growing international appetite for LNG has positioned the United States as a key exporter, with the country expected to account for approximately 75% of LNG final investment decisions (FIDs) for 2025 and 2026, potentially doubling its market share by 2030.8
Real Estate Investment Trusts (REITs) are companies that own or finance real estate across different property types. Like MLPs, REITs must distribute about 90% of their income in the form of dividends to keep their preferred tax status. Therefore, REITs tend to pay a higher-than-average yield. REITs cover a wide scope of property types, which could help investors maintain their real estate exposure through different phases of the business cycle. For example, residential REITs benefit in areas and times of population growth and strong housing fundamentals. Healthcare REITs benefit from an aging population. Mortgage REITs hold mortgages and mortgage-backed securities (MBS) on their balance sheets, profiting from the spread between income earned and the interest paid on assets. Lastly, office REITs tend to benefit when employment rises, although headwinds remain in this space with the post-Covid hybrid work environment.
MLPs and REITs provide targeted exposure in a specific sector, but a very high yield can also be achieved using products that diversify across sectors and potentially also geographies. Typically, these diversified exceptionally high yielding equities may provide small cap and deep value focused exposure. These are areas that can be highly cyclical, typically performing well during the expansion phase of the business cycle, but due to quality considerations they typically struggle during challenging economic periods.
The chart below shows MLP and REIT yields versus 10-year Treasury and S&P 500 yields.

Equity Income Opportunities in a Portfolio Context
When combining equity income products within a portfolio, it’s important to consider exposure diversification while also diversifying the portfolio’s sources of income. During this process it’s essential to implement a structure that can provide a sustainable yield through different market environments. When strategically blended, these equity income elements can create a robust portfolio capable of navigating the ebb and flow of market dynamics.
As discussed in the building blocks section, covered calls and preferreds are great ways to diversify a portfolio’s sources of yield while also reducing market sensitivity due to their low beta. However, while providing an excellent source of income, these areas are best paired with portfolio segments that offer good upside capture.
Depending on the portfolio’s yield target, quality dividends can provide a solid foundation with a decent upside capture ratio. This can be complemented by including select higher yielding common equity exposures based on the economic and market environment. Cyclical exposures typically outperform during the expansion phase of the business cycle. The current economic uncertainty can be a challenging economic backdrop for certain very high yielding strategies.
Equity Income Portfolios as a Satellite Exposure
Equity income portfolios can be thought of as well diversified stand-alone portfolios, or as a high yielding component of a broader portfolio strategy. This context will determine the importance of equity exposure diversification while also impacting how to think about pairing equity income with fixed income.
As illustrated on the correlation table, combining equity income solutions with each other can provide diversification benefits and support returns through various market cycles. When combining equity income products, investors should be conscious of how certain parts of the equity income market perform under various macro dynamics. This way they can scale each segment up and down as necessary. Additionally, this table reflects the correlation between different equity income areas relative to broad beta U.S. equities.
With policy yields at 4.25 – 4.5%9, the Fed has a reasonable amount of fire power to deploy should the U.S. economy slow dramatically. However, until inflation risks abate, the level of support provided by the Fed is likely to be more muted. As such, this is a mixed environment for both equities and fixed income, but combining these asset classes can help provide diversification benefits and increase return potential. This is especially true within the current drawn-out rate cutting cycle, where economic resilience could support equity returns.
As reflected on the correlation table, several areas, including covered calls, FTSE High Dividend Yield, and MLP indices have almost no correlation with the Bloomberg U.S. Aggregate Index. Zero correlation between two assets indicates that there is no linear relationship between their returns. For investors looking for yield but needing to balance capital preservation and capital growth requirements, there’s potentially a wide range of exciting opportunities.

Holistic Approach for Higher Yields & Total Return
Finding yield through equity income is important, but selectivity is vital given the current economic climate. Exposure to quality stocks can provide resilient yield. Covered calls can offer attractive income but performs best in a rangebound market environment. And preferred stocks can provide a reasonable income and low beta.
Each of these areas generally focus on either yield or return potential. Combining equity income solutions can improve a portfolio’s exposure diversification while also diversifying its sources of yield. This can create a portfolio that provides a solid yield while also focusing on total returns. Equity income portfolios must be flexible enough to capture upside while maintaining a decent yield throughout the business cycle.