 David Beniaminov
 Michelle Cluver
Growthier segments of the market came under pressure as investors began prioritizing shorter duration, current profitability, and dividend income. About 75% of the Russell 1000, the 1000 largest U.S. companies by market capitalization, have negative year to date returns1 and about two-thirds are trading below their 200-day moving average.2 While some valuation declines are justified, others could be solid entry points into oversold opportunities. This month we searched for such opportunities by looking at growth companies that exhibit current positive and forecasted higher profitability.
Style Breakdown
First, let’s define the growth spectrum that companies can fall into when investing in this style of equities.
- Aggressive Growth – These companies are generally not currently profitable. They have a high cash burn rate and reinvest heavily in their business. They are typically newer companies, and their valuations are based on positive future cash flow expectations discounted back to today.
- High Growth – These companies are close to or are newly profitable. They continue burning through cash and reinvest heavily into their business. The major difference between these companies and Aggressive Growth is that they have a product on the market generating a reliable revenue stream.
- Profitable Growth – These are companies that have shown consistent positive earnings. They have a product that has become a staple of everyday life and have plans to continue innovating into the future. These companies balance the line between Growth and Core but skew towards growth.
Finding Profitable Growth
Vetting Valuations
We reviewed the investment universe across the Russell 1000 Index. The Russell 1000 makes up about 93% of the total U.S. market cap. This index can be broken down between the Russell 1000 Growth and Russell 1000 Value. We compared the weights of the Russell 1000 Growth Index to the Russell 1000 Value Index. If the constituent had a higher allocation in the growth index, then it was characterized as growth, if it was less, then it was value. Overall, there were 318 companies characterized as growth, constituting 49.9% of the Russell 1000 Index.
Then, constituents were grouped by sector with a focus on profitability. Profitability was split into two camps – profitable and not profitable. We took this further by looking at the estimated forward net income for each company.3 If net income was higher than the latest net income, the company was categorized as improving, if it was below the latest net income then company was classified as deteriorating. As reflected in the chart below, this established the spectrum from not profitable and deteriorating to profitable and improving.
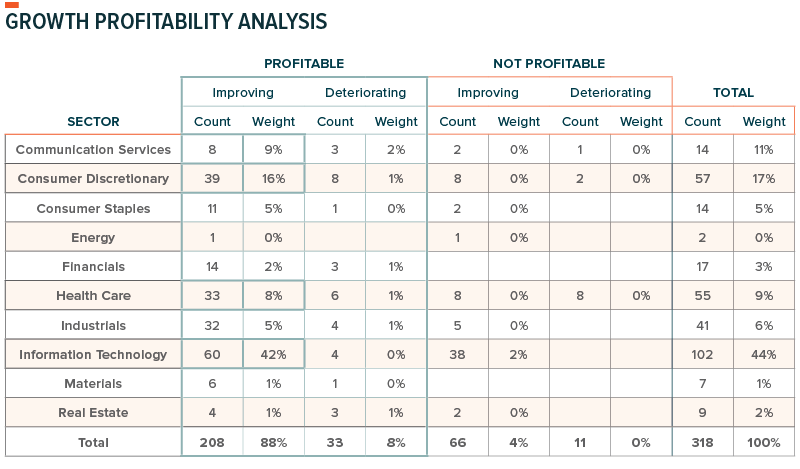
By market cap, the majority of growth focused constituents are profitable. Out of 318 growth focused companies, 208 companies, representing 88% of the weight of growth focused companies, were both profitable and improving, while a further 8% were profitable and deteriorating. The sectors that showed the greatest number of profitable and improving companies were Information Technology, Consumer Discretionary, Communication Services and Health Care, in that order.
One layer deeper, from an industry perspective, the industries that contributed the most to the positive and improving segment were:
- Information Technology: 22 out of 50 constituents from the Software industry contributed 15%.
- Information Technology: 2 out of 3 constituents from the Technology Hardware industry contributed 12%.
- Communication Services: 4 out of 7 constituents from the Interactive Media & Services industry contributed 8%.
- Consumer Discretionary: 2 out of 4 constituents from the Internet & Direct Marketing industry contributed 6.5%.
Because some companies are more exposed to supply chain issues or are more sensitive to inflation, we also analyzed most recent profit margins and compared them to the three-year average. Either companies were operating with negative or positive margins, and either those margins were deteriorating or improving. This created an additional four camps, negative margins and deteriorating, negative margins and improving, positive margins and deteriorating and positive margins and improving. The same sectors, ranked in the same order, had the greatest weights of companies that have both positive and improving margins. From an industry standpoint, Software, Technology Hardware, and Interactive Media all remained on top with the inclusion of Semiconductors & Semi Equipment.
Finally, we ranked performance from best to worst for the Russell 1000 into quartiles. Out of the 147 growth companies that are both profitable and improving, as well as have positive expanding margins, only 19 of them are in the first quartile for performance. 23 are in the second quartile, 56 are in the third quartile, and 49 are in the fourth quartile. If equity valuations are based off future earnings, then current valuations, combined with forward expectations don’t seem aligned. This may create entry points into what could be oversold opportunities.
Opportunities Remain in More Selective Market
In conclusion, even though the current market environment seems to favor more value focused, dividend paying companies, there are still opportunities available for investors to identify profitable growth companies. Selectivity is key, because while certain sectors may show profitability, if one takes a deeper dive on an industry level, certain industries in that sector are likely driving profitability while others are detracting from it.
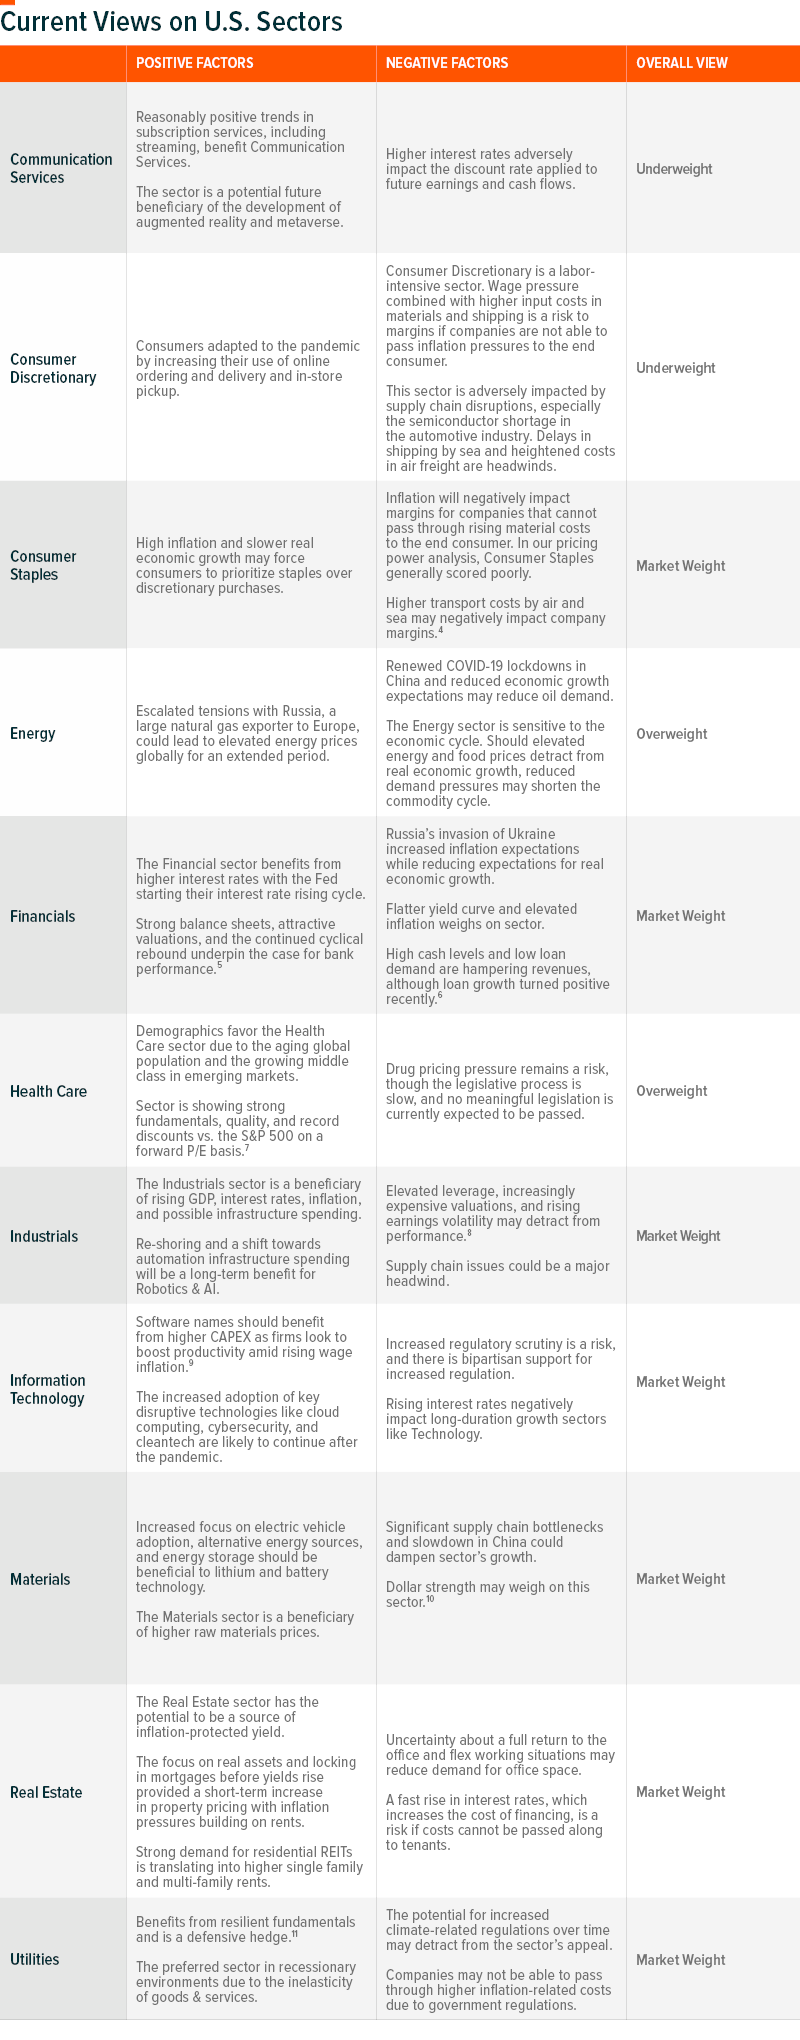
Analyzing margin expansion may help identify industries that are more affected by supply chain issues and inflation pressures. This helps establish broader views on different sectors and segments of the market. Please see below for our current sector views.