 Michelle Cluver
It seems like nothing can move the market in any meaningful direction these days. Most Wall Street pundits underestimated the strength of the market in 2019, and so far 2020 looks similarly resilient. But we find it fascinating that volatility remains so low, even with real concerns evident around the world.
A closer look shows the recent complacency set in with the increased probability of the Phase One trade deal, starting in mid-October of last year. The deal signed in mid-January has helped to calm trade risk as it pertains to China. But Europe is now at risk of being drawn into a trade war with the U.S., so it’s not like trade concerns are off the table. Perhaps any one of a number of latent geopolitical risks affects investor sentiment in 2020. Or maybe the growing coronavirus outbreak ends up roiling markets. The U.S. recently confirmed its first case following the outbreak in Wuhan, China in December.
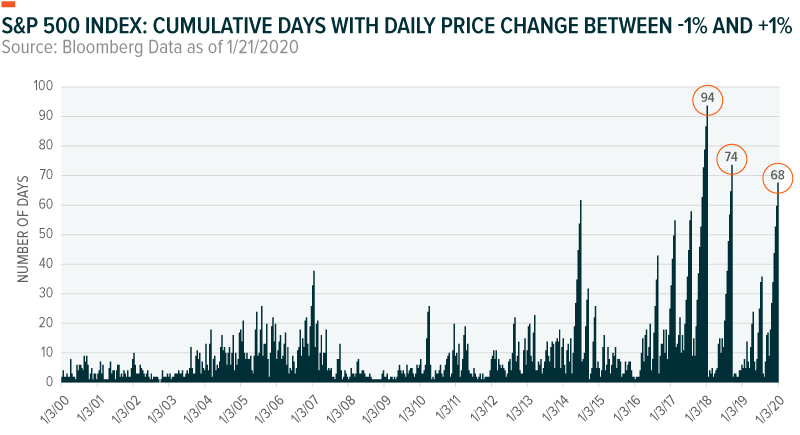
For now, the chart below provides some interesting perspective on this rangebound market. It shows the number of consecutive days the price movement on the S&P 500 Index has been less than 1% in either direction since 2000. At 68 days as of the January 21 close, the market is on its third longest rangebound stretch in the last two decades.
We believe that the tremendous amount of cash on the sidelines is one of the factors keeping the market quiet and elevated, along with central bank stimulus, low unemployment and a strong consumer. We see a consistent pattern: whenever the market has dipped over the past few months, money markets flush with cash step in and deploy some of that capital. And by the end of that day’s trading, the market likely trims its loss.
Some call this the most hated bull market in history, complaining that there is no other place to deploy cash. We believe valuations are a concern for investors, but if consumers continue to spend, the math is simple: companies earn more and stock prices still have reason to rise.