Skip to Main Content
Subscribe to Newsletters
Global X Logo
Search
Content loaded

Explore

Our ETFs

Investment Insights

Thought LeadershipProduct ResearchCharting DisruptionMidyear Outlook 2026

Investor Resources

EducationHow to InvestTax Resources

About Us

About Global XNewsroomCareersContact Us

Follow Us

social media icon for LinkedInLinkedInSocial media icon for X (twitter)XSocial media icon for FacebookFacebookSocial media icon for InstagramInstagramSocial media icon for Youtube

Copyright © 2026 Global X. All rights reserved.

Privacy PolicyAccessibility Statement
YouTube

Subscribe to our newsletter

Get the latest news and updates from our team.

Subscribe

SEI Investments Distribution Co. (1 Freedom Valley Drive, Oaks, PA, 19456) is the distributor for the Global X Funds.

Check the background of SIDCO and Global X's Registered Representatives on FINRA's BrokerCheck.

Content
Thought LeadershipThematic GrowthEquity

Through the Systematic Lens: Thematic Equity: Factor Landscape (October 2026)

x
B
Benjamin LavineSenior Investment Strategist
Oct 29, 2026·12 min read

“The trend is your friend, until it bends,” Ed Seykota (1995)

"Opportunity always knocks at the least opportune moment." — Murphy's Law

This is our continuing series where we apply a systematic/factor-based lens to the thematic investment landscape, focusing on fund exposures to common risk factors such as growth, value, momentum, quality, and volatility. Rather than judging a theme on narrative or recent performance alone, this systematic lens helps identify where investor sentiment may be building or recovering and the underlying risks expected to contribute to future volatility. Below, we review the broader factor backdrop across U.S. equities, then turn to this month’s Top Trending Themes (by Bloomberg Momentum factor), highlighting the Global X Genomics and Biotechnology ETF (GNOM), and the Most Out-of-Favor themes, highlighting the Global X U.S. Natural Gas ETF (LNGX).

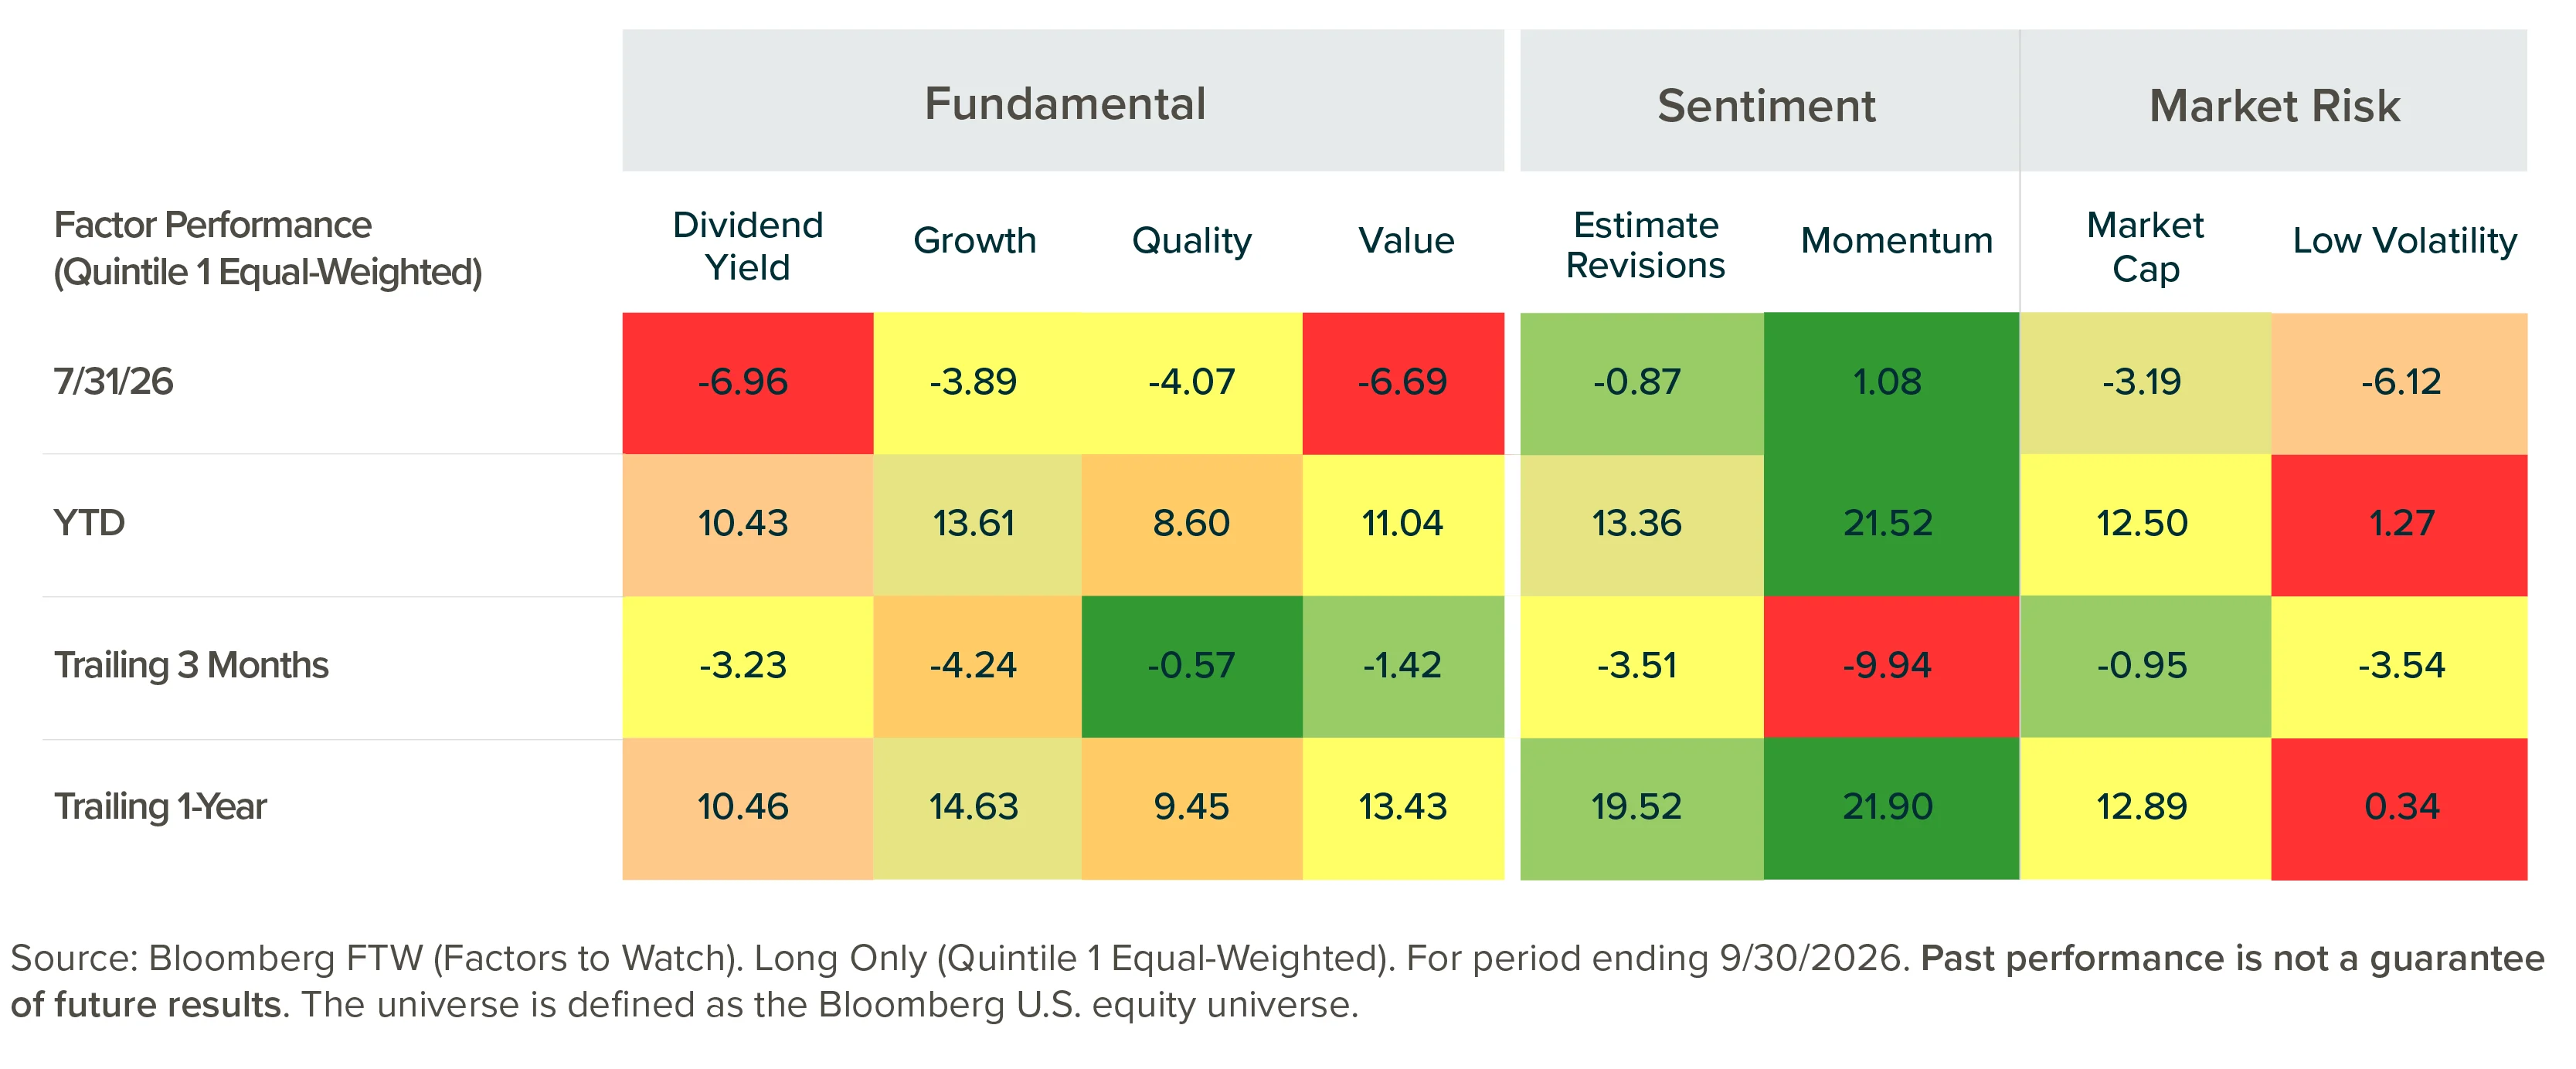
For the month ending 9/30/2026, sentiment-based factors (Momentum, Estimate Revisions style factors) led Bloomberg U.S. equity universe factor performance, snapping back from underperformance over the prior two months. Fundamental factors (Dividend Yield, Growth, Quality, and Value) meaningfully underperformed as did Low Volatility, which significantly lagged the other factors on a trailing 1-year basis ending 9/30/2026. U.S. stocks experienced acute narrow breadth (% of stocks or factors outperforming the broader market) as the median stock in the S&P 500 Index fell 6% while the overall index only dropped 0.45% for the month ending 9/30/2026. The S&P Information Technology and Communication Services sectors were the only two major sectors to outperform in September, returning 4.5% and 4.3%, respectively, while all the other major sectors were negative for the month.

Trailing three-month performance reflects this environment of factor churn, witnessed by this year’s fluctuation of the Momentum factor from factor leader to factor laggard, as Momentum had previously experienced a sharp unwind between late June through late August. Yet, despite this sharp underperformance in early part of the third quarter, Momentum continued to lead all major factors year-to-date (YTD) through 9/30/2026. Overall market leadership remained concentrated in equity themes linked to advancements in Artificial Intelligence (AI) design and delivery, which may also influence how Momentum as a factor performs over the intermediate term.1

We continue to believe the fundamental backdrop for pro-cyclical leadership remains intact (see the Global X 2026 Mid-Year Outlook). As much as we are encouraged by the recovery in Momentum, we are mindful of the lack of factor breadth, particularly among fundamental-based factors where both growth and value performed poorly in September. If the narrowness in equity leadership persists, then further market advances may be built on a shrinking foundation. This could leave the broader market vulnerable to a major pullback, especially if the upcoming earnings season fails to meet expectations.

Note: all factors referenced in this article are defined by Bloomberg unless stated otherwise.
Through the Systematic Lens: Thematic Equity:  Factor Landscape (October 2026) Table 1

Key Takeaways

  • Following September’s recovery, Momentum continued to dominate U.S. equity factor leadership, as overall market leadership has grown increasingly concentrated in AI-technology focused companies. One may consider taking at least a neutral stance on Momentum, with an eye toward oversold themes whose growth fundamentals remain intact.

  • AI-adjacent computing, metals producers, genomics, and energy producers/distributors comprise our Top Trending Themes; we highlight the Global X Genomics & Biotechnology ETF (GNOM).

  • Genomics, food technology, energy producers, and dividend/cash-flow factors remain our most Out-of-Favor Themes (those that have lagged the broader market over the past four to five years) with genomics and conventional energy producers showing signs of recovery based on recent Momentum; we highlight the Global X US Natural Gas ETF (LNGX).
Through the Systematic Lens: Thematic Equity: Factor Landscape (October 2026) Chart 2

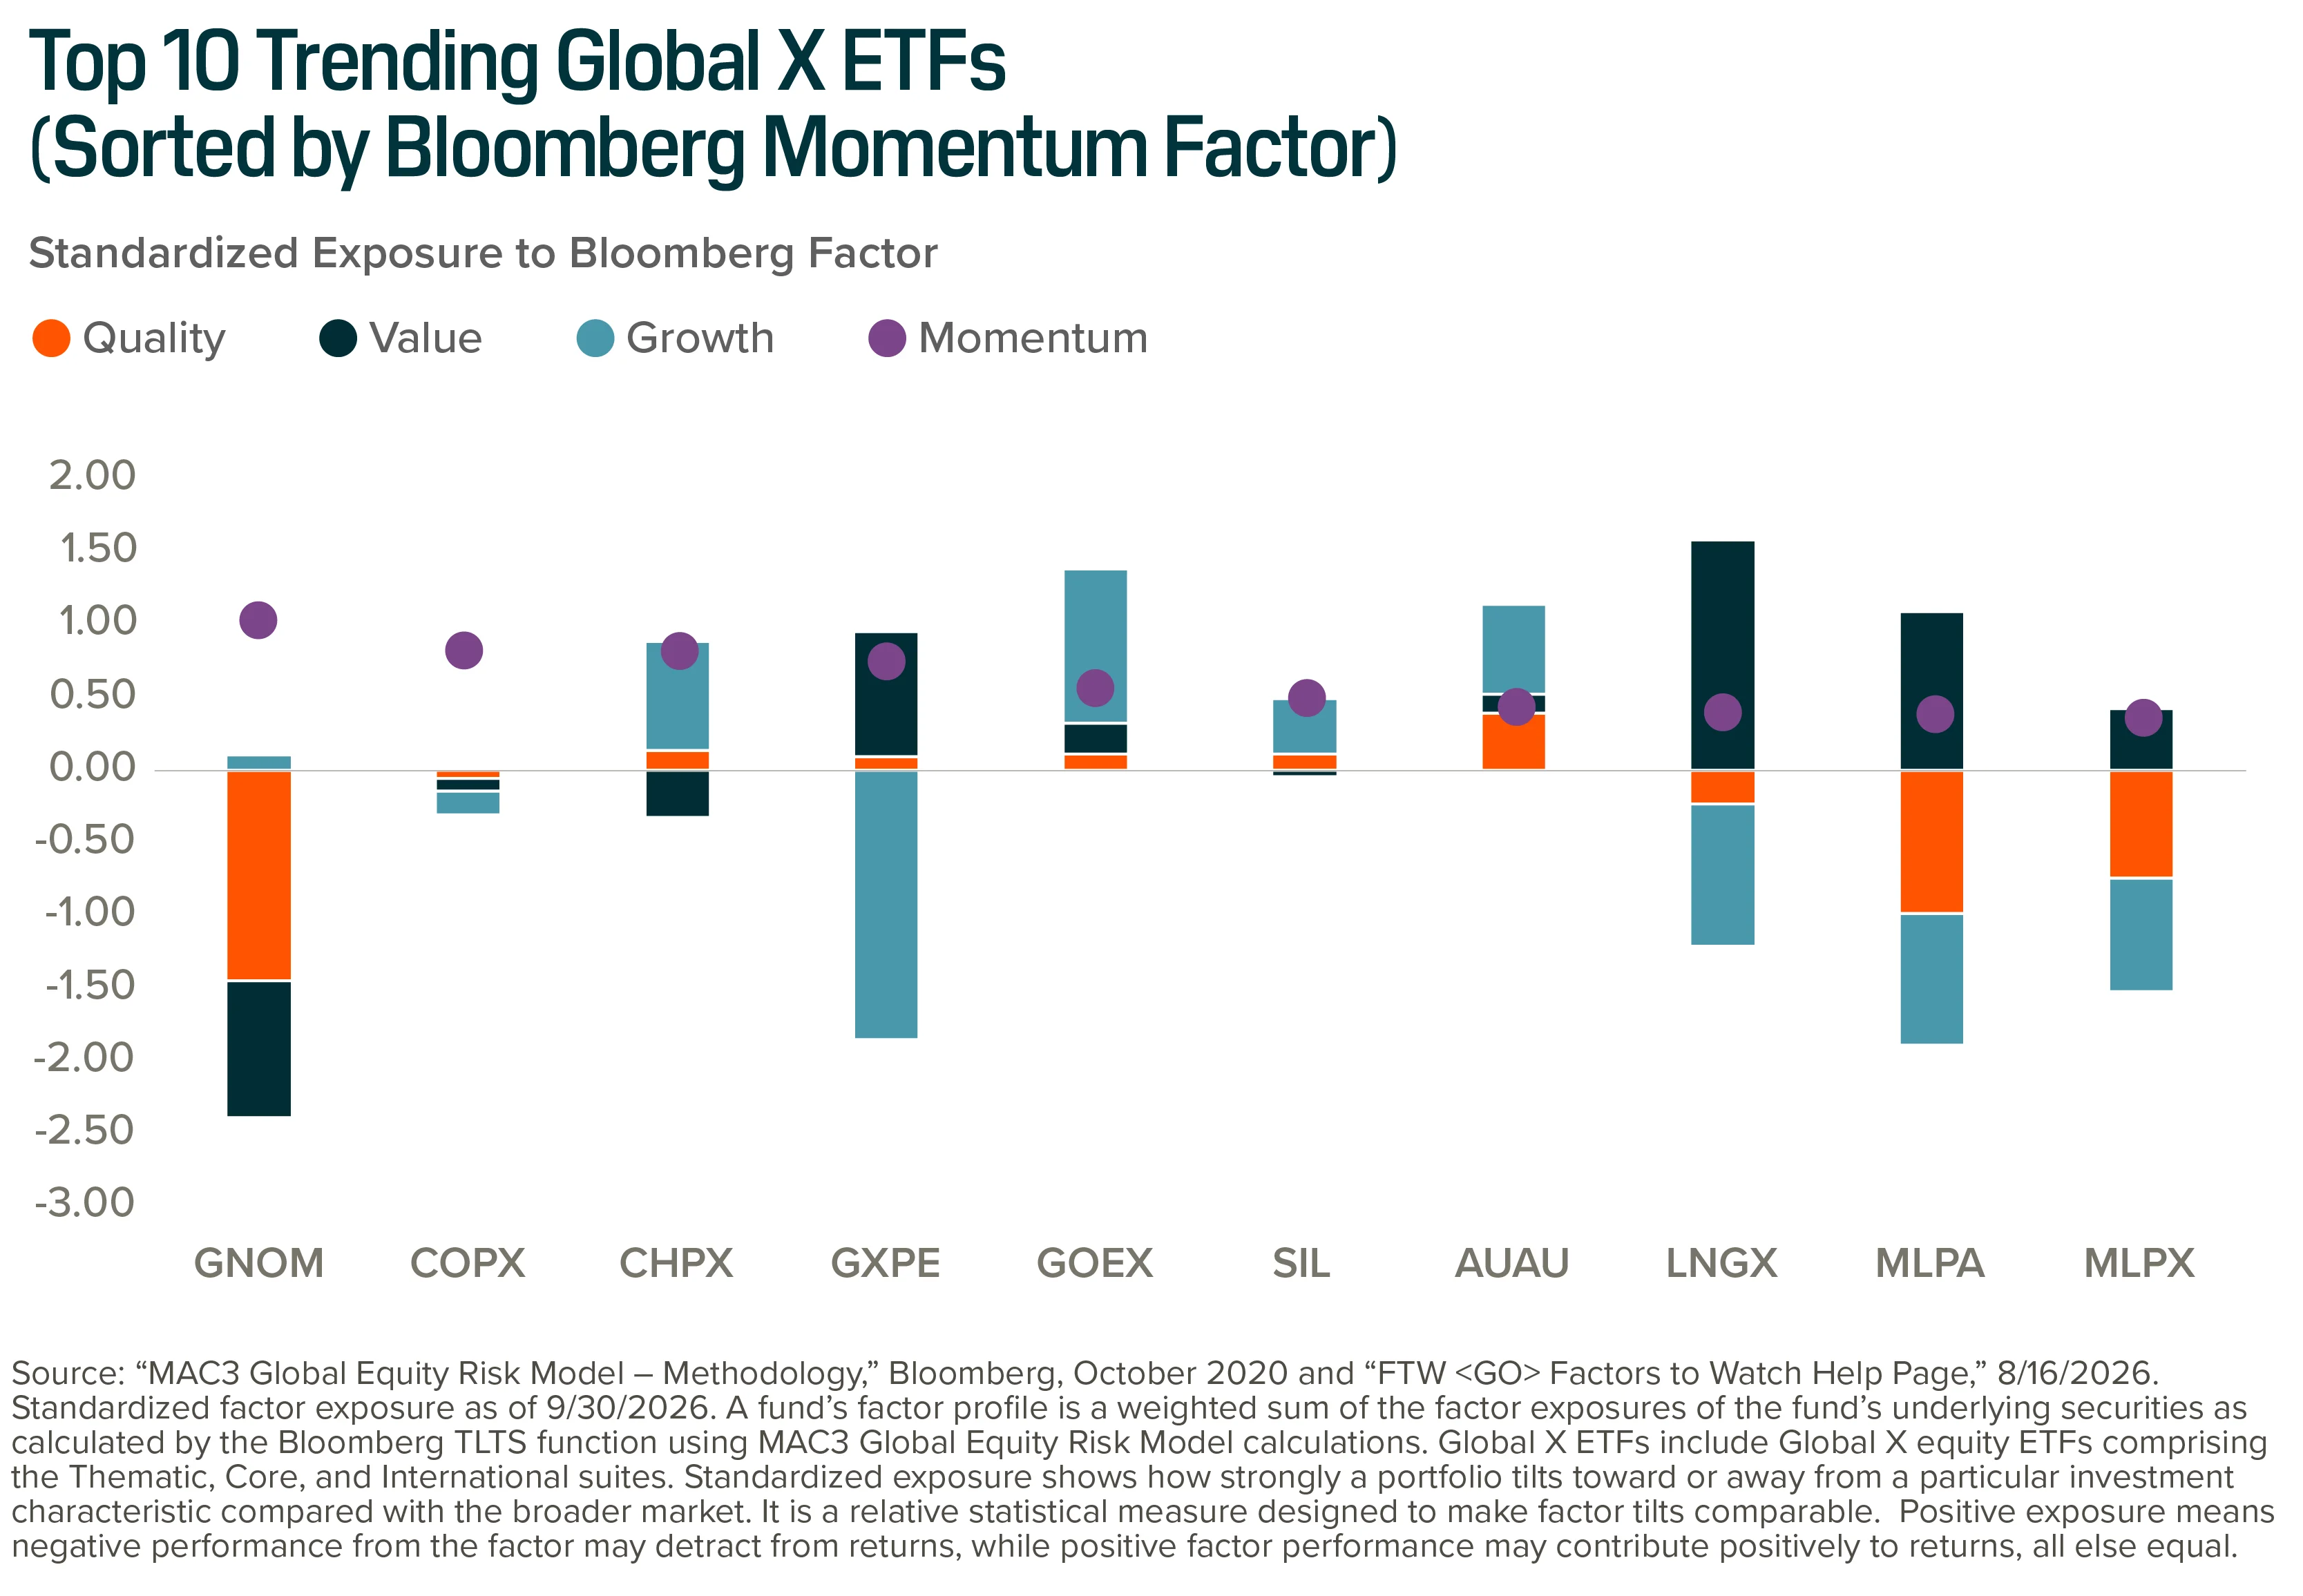
Among the Top Trending Themes, AI-adjacent and precious metal producers may benefit from positive growth factor exposure, while energy producers/distributors may benefit from positive value factor exposure.

As of 9/30/2026, we observe four thematic categories comprising the Top Trending list, as measured by the Bloomberg Momentum Factor. These themes have enjoyed positive pricing trends, signaling strong investor demand.

Top Trending Theme in Focus: Genomics & Biotechnology

This month we apply a factor lens to the Global X Genomics & Biotechnology ETF (GNOM). Here is the summary of the structural thesis:

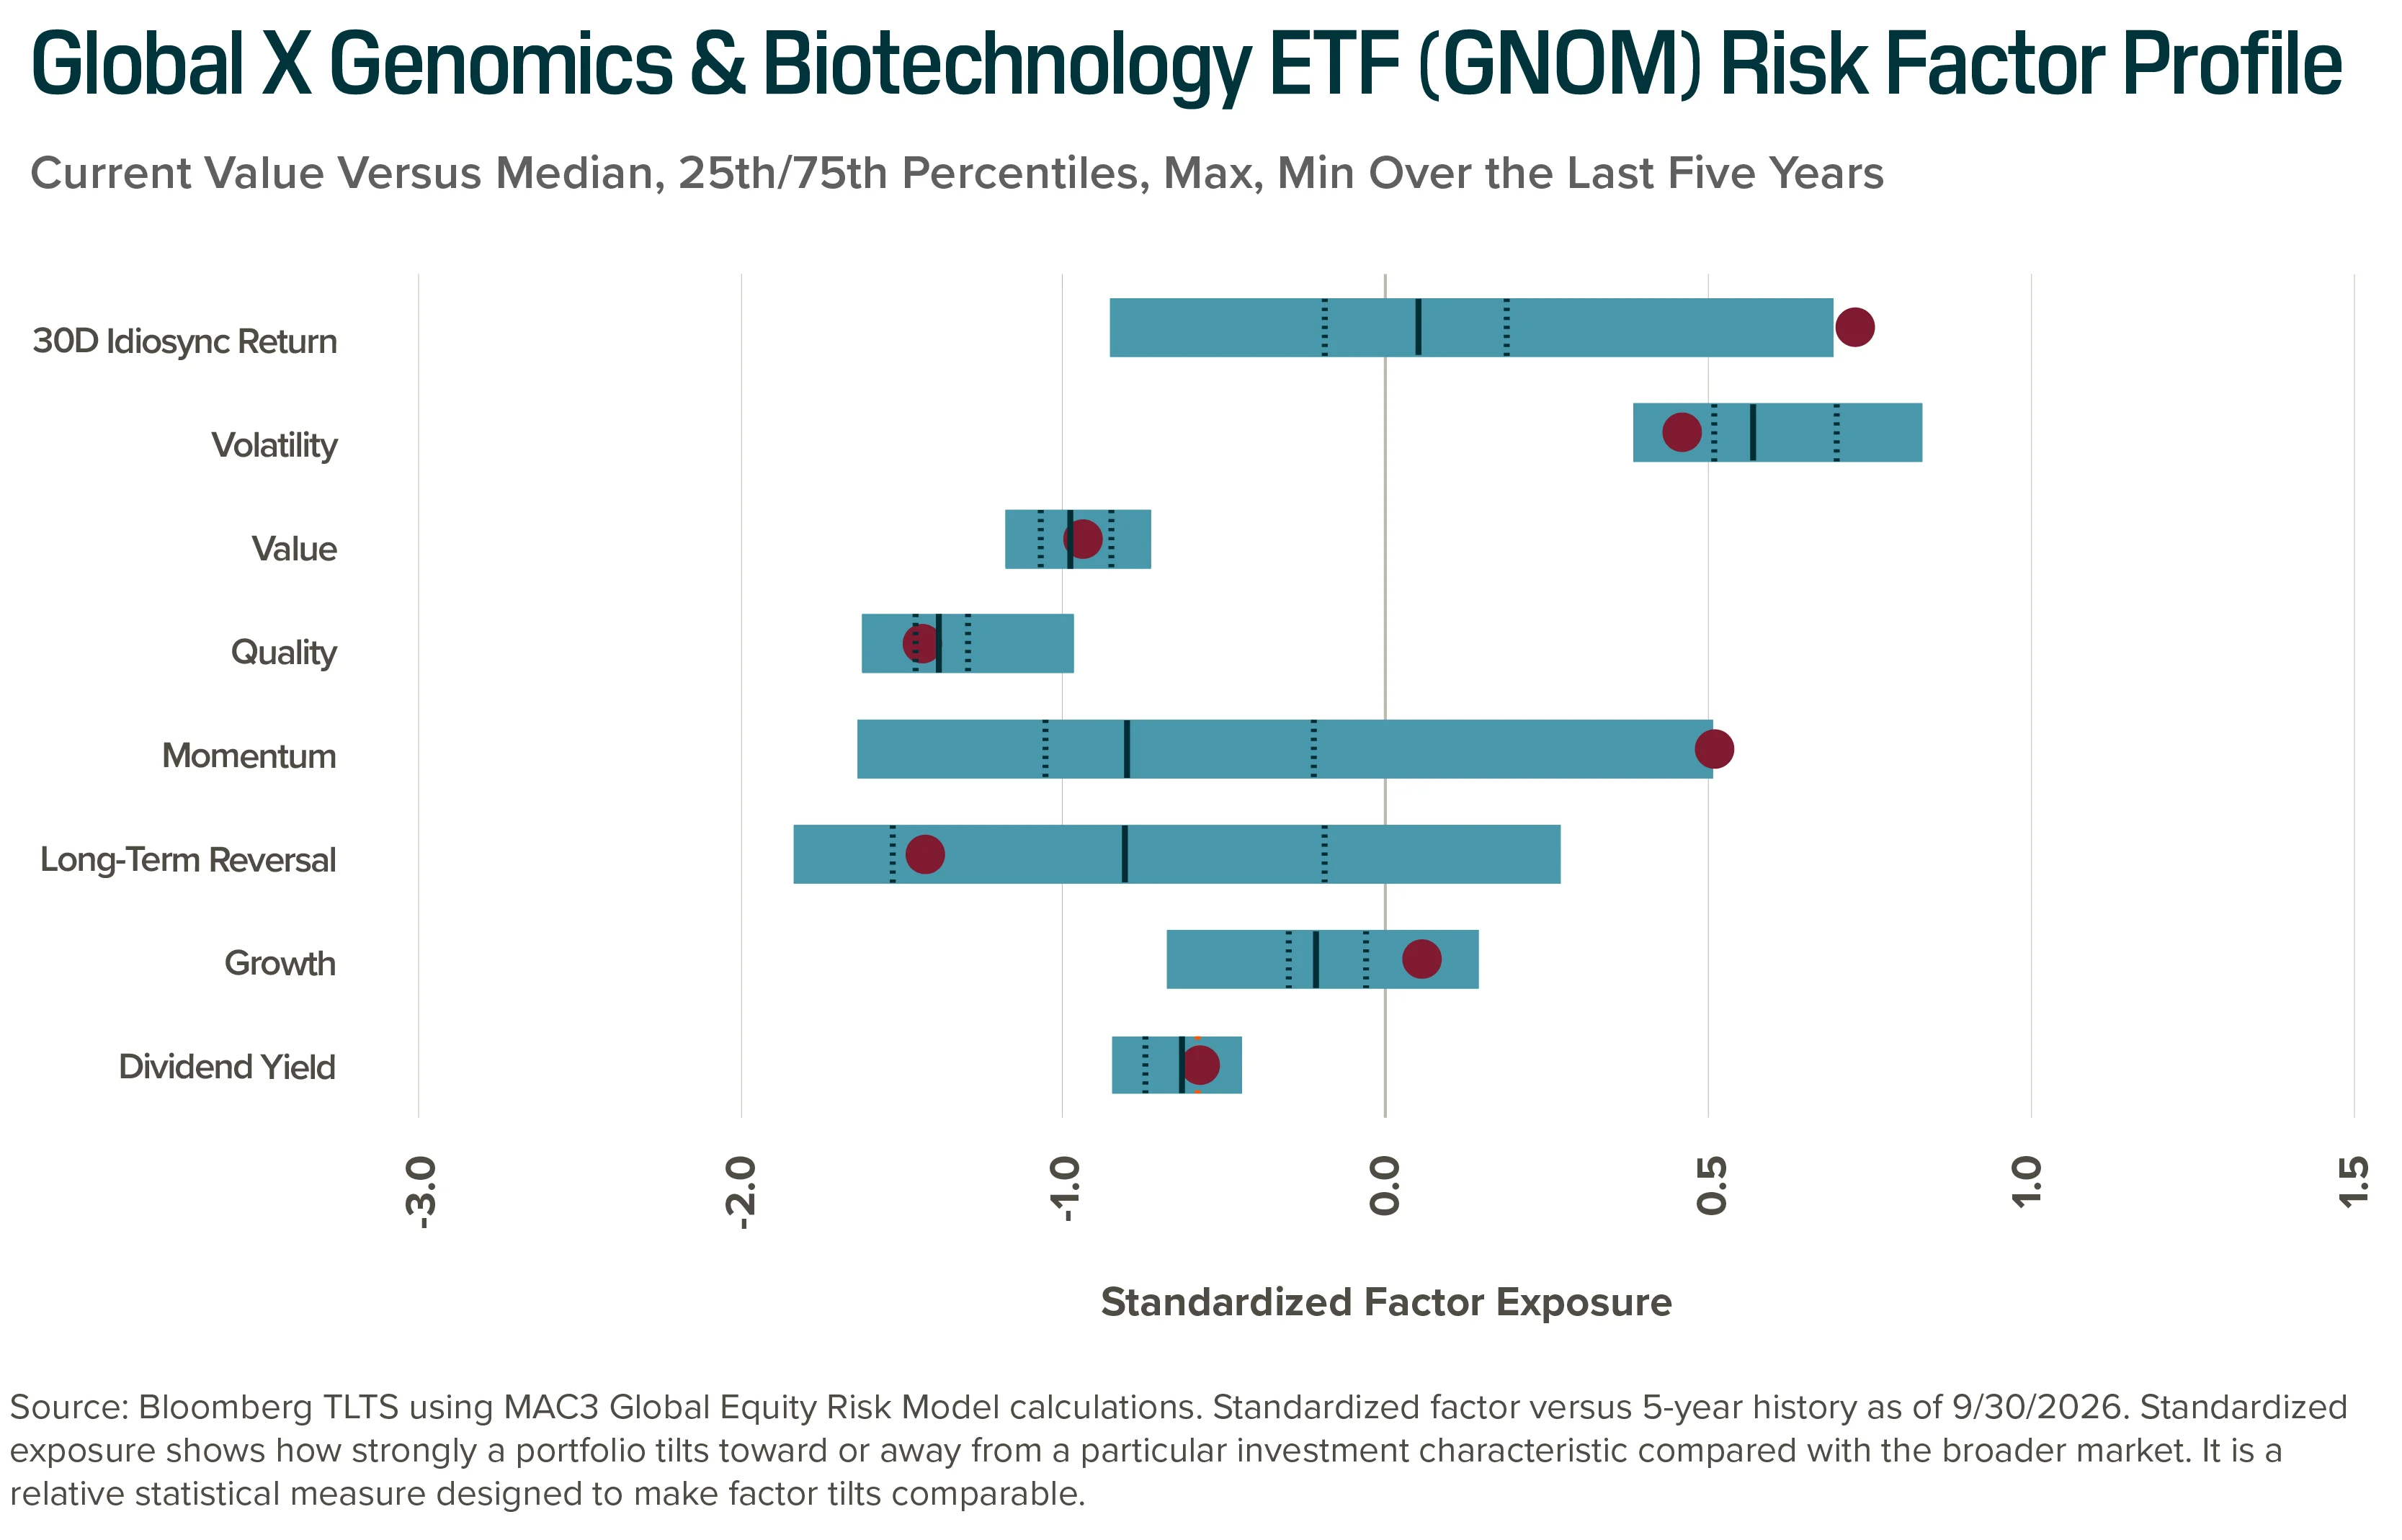
The charts below examine the fund’s current factor exposure and fundamental/pricing trends.
Through the Systematic Lens: Thematic Equity: Factor Landscape (October 2026) Chart 3
Through the Systematic Lens: Thematic Equity: Factor Landscape (October 2026) Chart 4
Through the Systematic Lens: Thematic Equity: Factor Landscape (October 2026) Chart 5

The performance data quoted represents past performance. Past performance does not guarantee future results. The investment return and principal value of an investment will fluctuate so that an investor’s shares, when sold or redeemed, may be worth more or less than their original cost and current performance may be lower or higher than the performance quoted. Performance current to the most recent month- or quarter-end is available here.
Through the Systematic Lens: Thematic Equity: Factor Landscape (October 2026) Chart 6

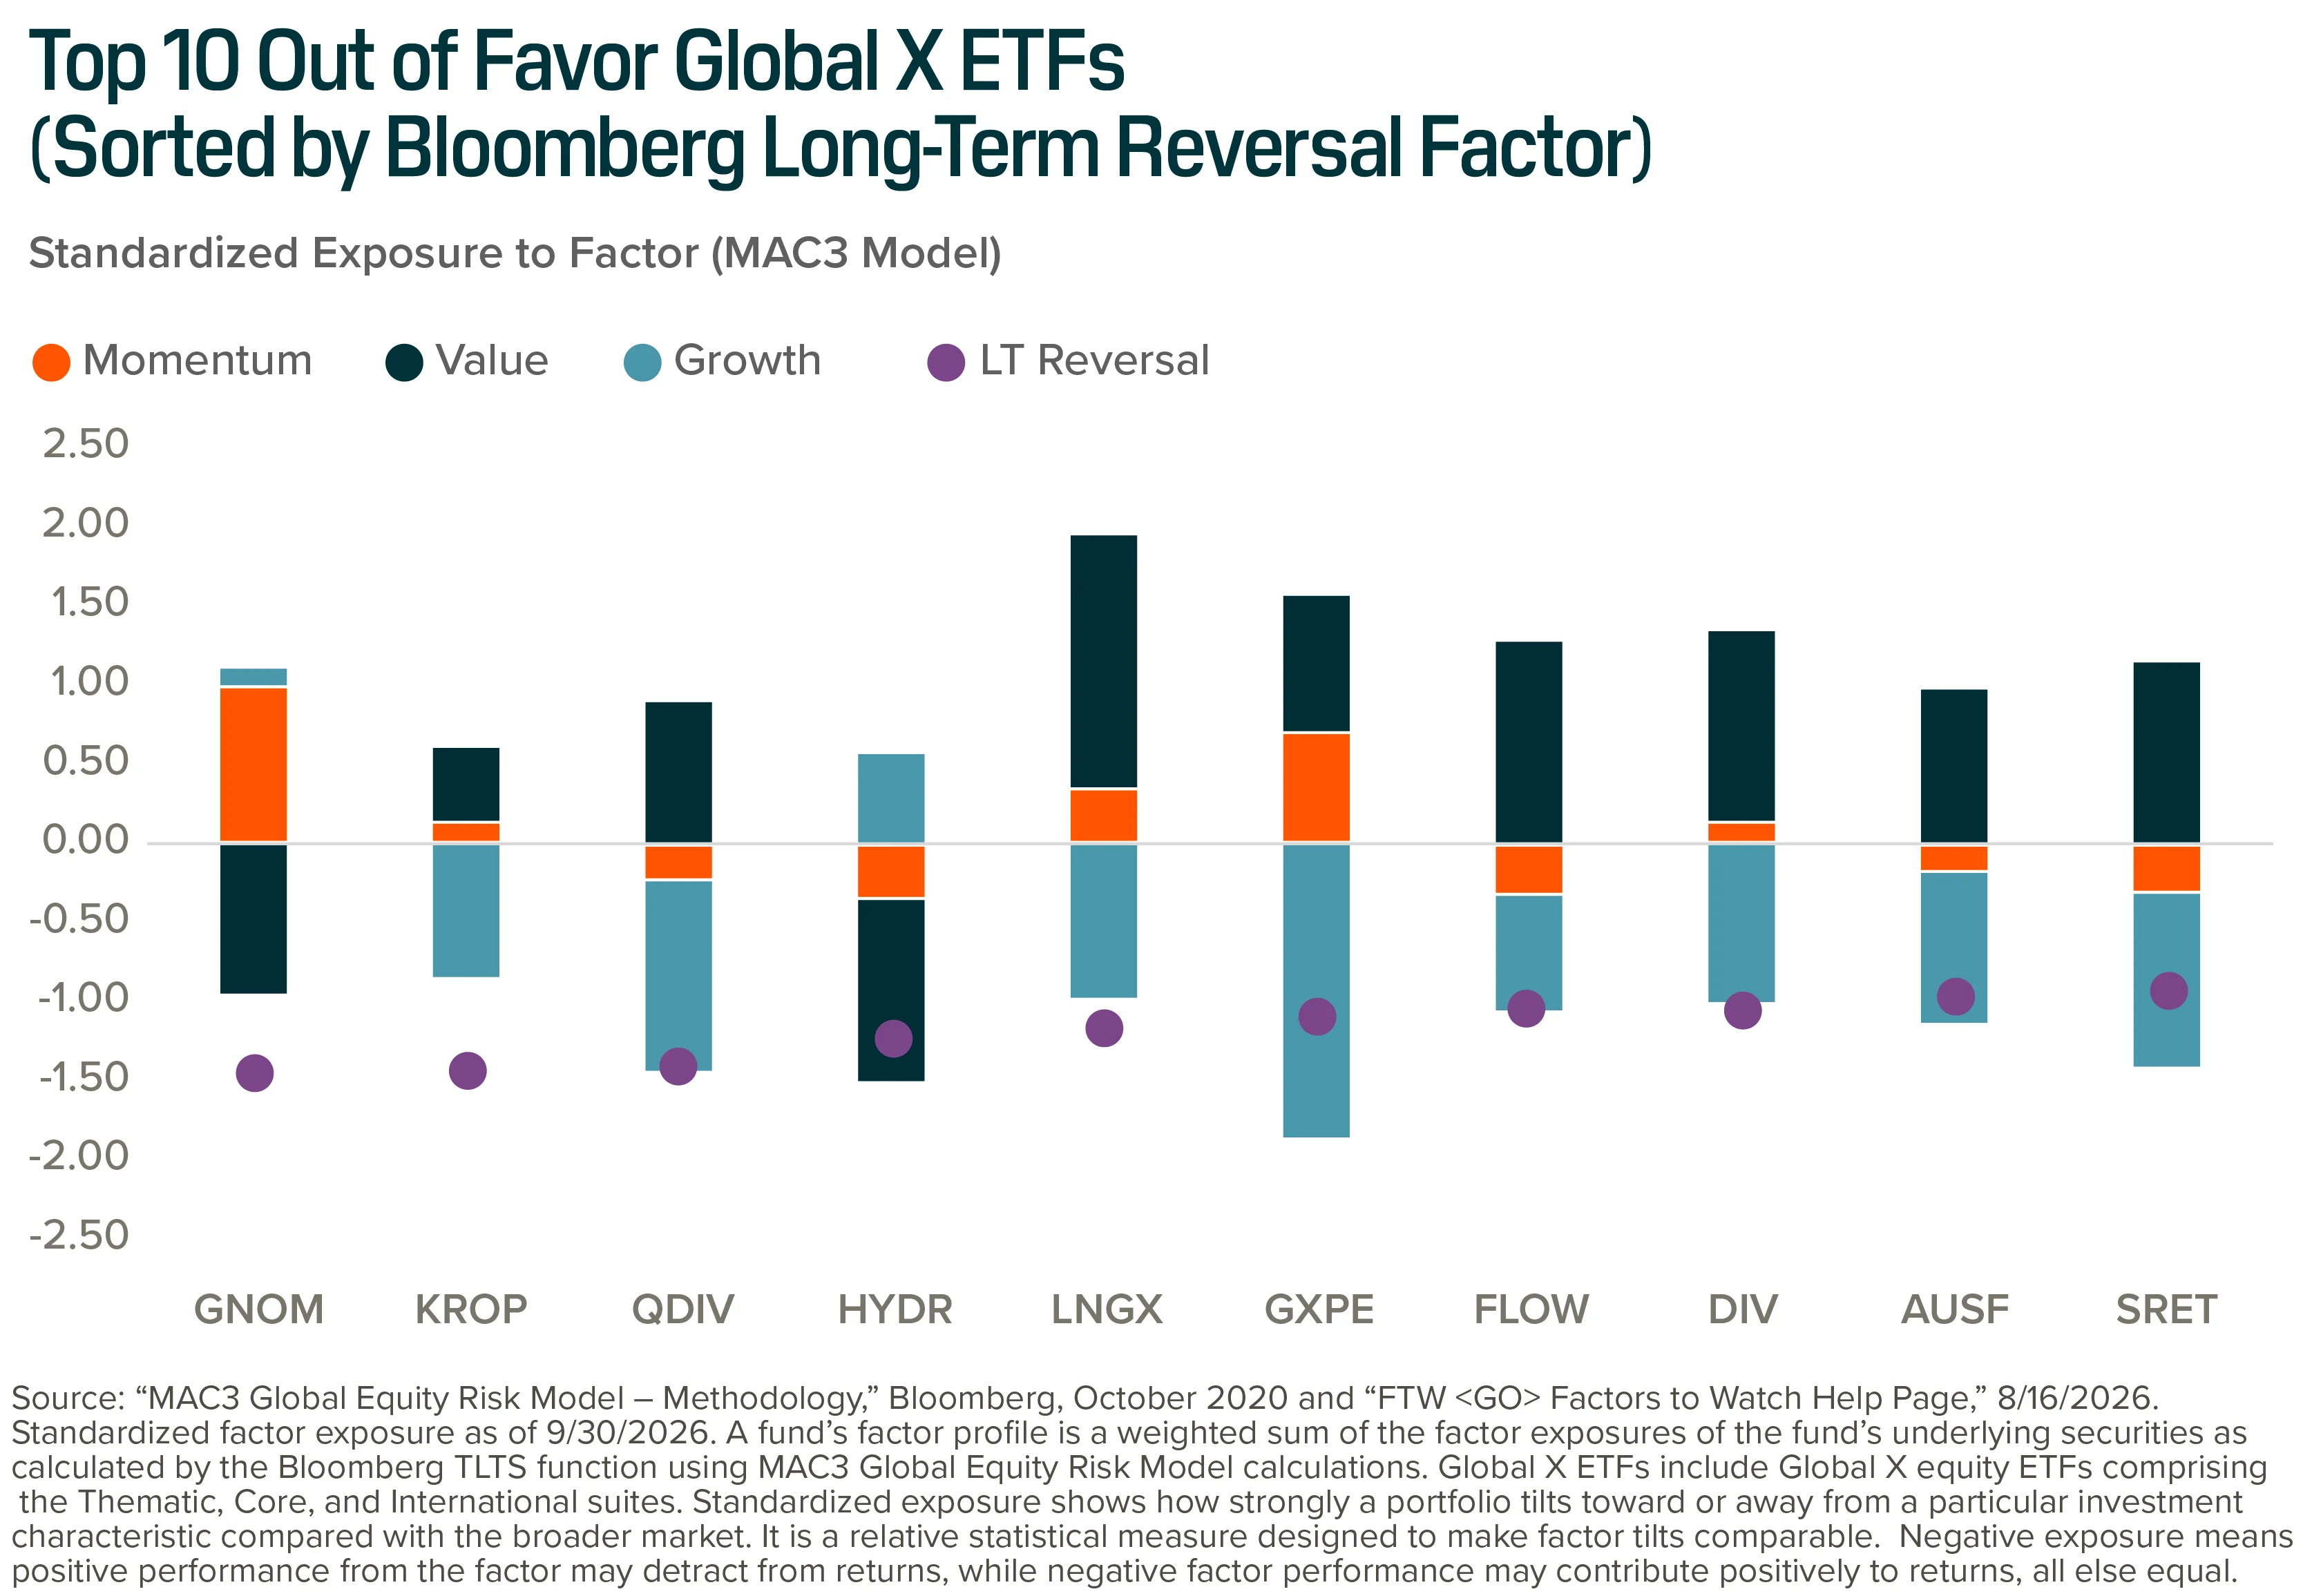
This month’s Top Out-of-Favor list, as measured by the Bloomberg Long-Term Reversal Factor, spans five categories. Many of the underlying securities held in these themes have underperformed over the past five years as investors moved on from the promising growth potential they once exhibited, though several are now showing signs of recovery.

Out-of-Favor Theme in Focus: Global X Natural Gas ETF (LNGX)

In this section, we’re applying a factor lens to the Global X Natural Gas ETF (LNGX). The long-term thesis is summarized here:

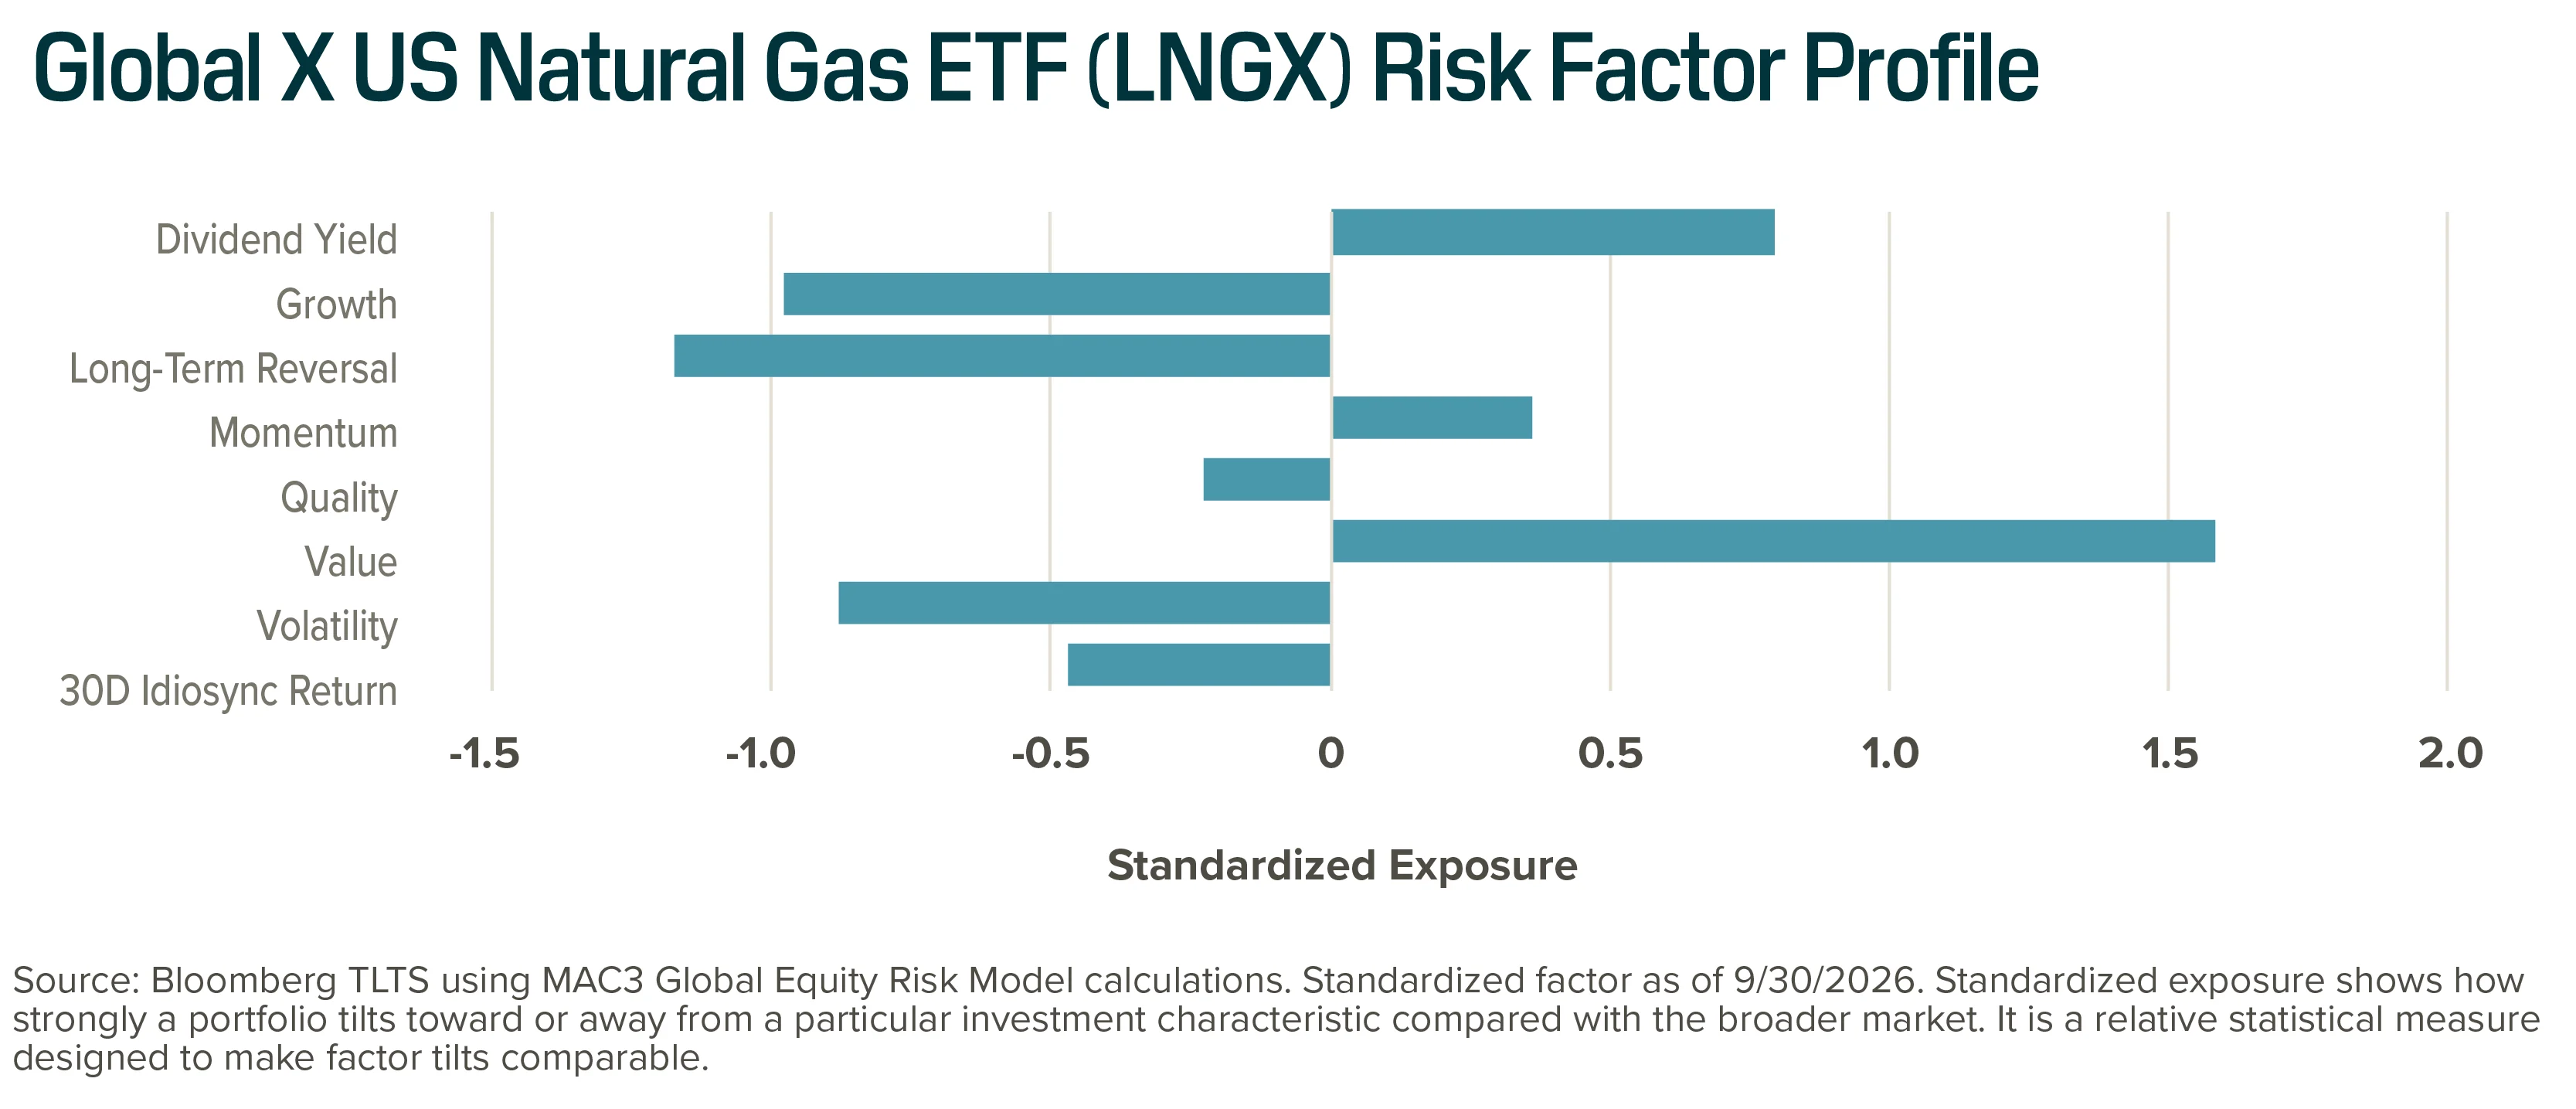
Here we review LNGX’s factor exposure and fundamental / pricing trends. Funds with under one year of history (like LNGX) are only shown with current factor exposures:
Through the Systematic Lens: Thematic Equity: Factor Landscape (October 2026) Chart 7
Through the Systematic Lens: Thematic Equity: Factor Landscape (October 2026) Chart 8
Through the Systematic Lens: Thematic Equity:  Factor Landscape (October 2026) Chart 9

The performance data quoted represents past performance. Past performance does not guarantee future results. The investment return and principal value of an investment will fluctuate so that an investor’s shares, when sold or redeemed, may be worth more or less than their original cost and current performance may be lower or higher than the performance quoted. Performance current to the most recent month- or quarter-end is available here.

Conclusion

We believe a practical starting point for building a thematic equity portfolio is a core group of funds spanning a broad cross-section of themes, with opportunistic allocations to out-of-favor or underappreciated themes.

Related ETFs

AUAU – Global X Gold Miners ETF

AUSF – Global X AI Adaptive U.S. Factor ETF

CHPX – Global X AI Semiconductor & Quantum ETF

COPX – Global X Copper Miners ETF

DIV – Global X SuperDividend® U.S. ETF

FLOW – Global X U.S. Cash Flow Kings 100 ETF

GNOM – Global X Genomics & Biotechnology ETF

GOEX – Global X Gold Explorers ETF

GXPE – Global X PureCap℠ MSCI Energy ETF

HYDR – Global X Hydrogen ETF

KROP – Global X AgTech & Food Innovation ETF

LNGX – Global X U.S. Natural Gas ETF

MLPA – Global X MLP ETF

MLPX – Global X MLP & Infrastructure ETF

QDIV – Global X S&P 500® Quality Dividend ETF

SIL – Global X Silver Miners ETF

SRET – Global X SuperDividend® REIT ETF

Click the fund name above to view current performance and holdings. Holdings are subject to change. Current and future holdings are subject to risk.

Artificial Intelligence (AI)-Adjacent themes representing computing bottlenecks such as AI semiconductors/quantum (CHPX), along with critical inputs needed for capital spending on infrastructure / advanced devices such as copper miners (COPX). These themes trade at slight premium valuations (moderately negative Value exposure), but whose financial profiles are turning more stable (moderately positive Quality exposure). We believe the structural growth narrative remains intact given the strong AI and broader infrastructure capital expenditure cycle.

Precious metals mining and/or exploration themes, such as AUAU, GOEX, SIL, benefited from the late 2025/early 2026 run-up in precious metals prices (primarily gold and silver) before correcting later in the year. The precious metals complex may face headwinds if heightened inflation expectations continue to warrant a hawkish monetary policy path for the Federal Reserve. Still, strong earnings growth (positive Growth exposure), improving financial metrics (positive Quality exposure) and reasonable valuations may help buffer further pressures on hard assets stemming from higher inflation-adjusted (real) interest rates and tighter monetary policies.

Energy Producers (GXPE, LNGX) and Energy Distributors/Delivery (MLPA, MLPX) have benefitted from conventional energy supply constraints, largely brought on by geopolitical events (Ukraine/Russia, Strait of Hormuz Conflict) which disrupted global oil supply routes. Themes tied to conventional energy, whether upstream production or mid-stream distribution/delivery, are trading at less expensive valuations than the broader market, as investors likely expect the bump from higher commodity prices to near-term earnings growth to eventually normalize to lower long-term trend levels.

Genomics (GNOM) rounds out the list, with renewed interest driven by AI’s transformative potential for gene therapy, drug discovery, and personalized medicine; it also appears on the Long-Term Reversal list below as this theme appears to be recovering from long-term underperformance versus the broader market. We profile the genomics theme (GNOM) as this month’s Top Trending Theme in Focus

Genomics and biotech are entering a multi-decade growth phase driven by platform breakthroughs, AI-driven R&D productivity, and demographic demand. Gene editing has moved into approved medicine, with CRISPR therapies cleared by the FDA, next-generation approaches advancing in the clinic, and the FDA streamlining pathways for personalized treatments.2,3 AI is cutting drug discovery cost and time from roughly $2-3 billion and 10-15 years, and cheap whole genome sequencing (approaching $500) is enabling population-scale precision medicine.4 Heightened demand may be driven by an aging population (the 60+ cohort doubling by 2050), expanding modalities such as mRNA, ADCs, cell and gene therapy, radiopharmaceuticals, and protein degraders, and pharmaceutical-focused capital deployed through M&A and partnerships.5,6

Market sentiment (Momentum) has significantly improved as the theme appears to be bottoming from a long-term downward trend (Long-Term Reversal). Recent news tied to advancements in personalized cancer vaccine treatments and AI model training likely serve as the catalysts for the turnaround in sentiment.7,8

Commensurate with the improvement in sentiment, the fund is also exhibiting improving Growth and Quality factor readings as well as lower Volatility versus its trailing five-year history.

GNOM has positive exposure to Growth and Momentum while exhibiting lower Volatility versus its 5-year history.

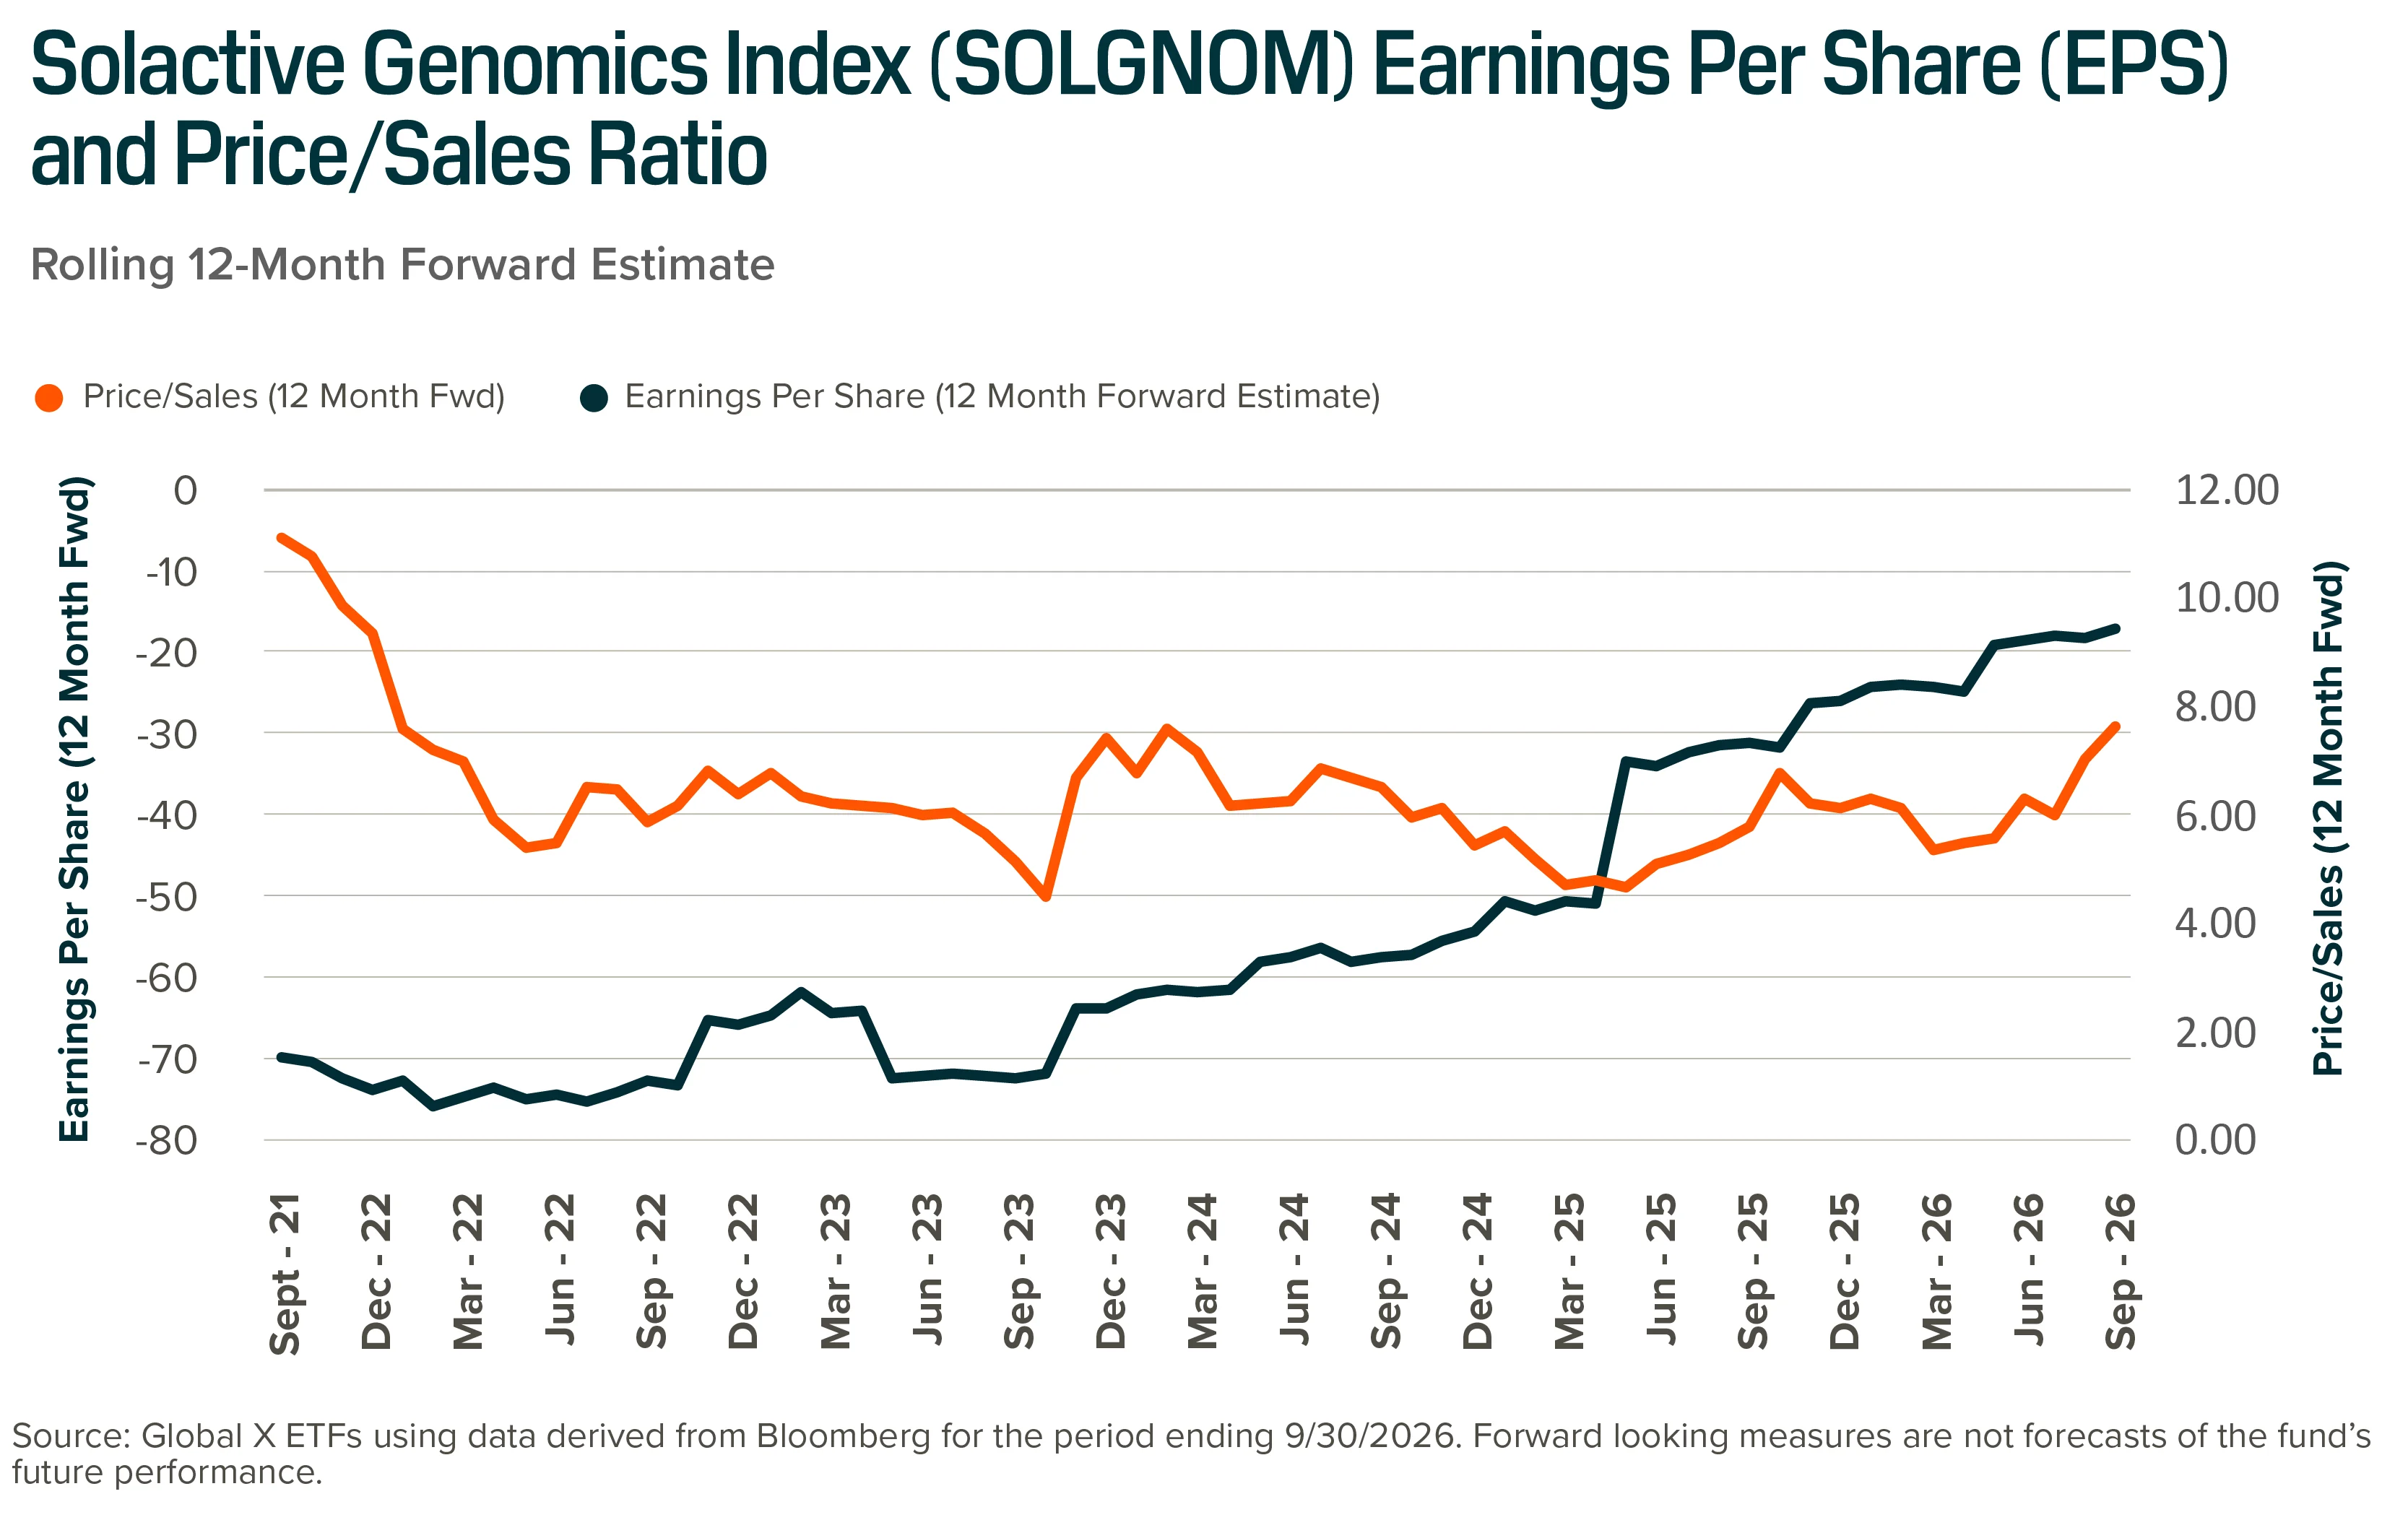
Estimated earnings for the underlying constituents of the Solactive Genomics Index (the tracking index for GNOM) have improved, though the underlying constituents of the index remained unprofitable. As of 9/30/26, its forward price/sales ratio has improved from the trough levels seen over the past two years, reflecting improving prospects, and room to grow into that valuation should these advancements in gene therapy reach commercialization.

Forward EPS for the Solactive Genomics Index has improved despite constituents having ongoing operating losses, while the Price/Sales ratio for the index has slowly expanded.

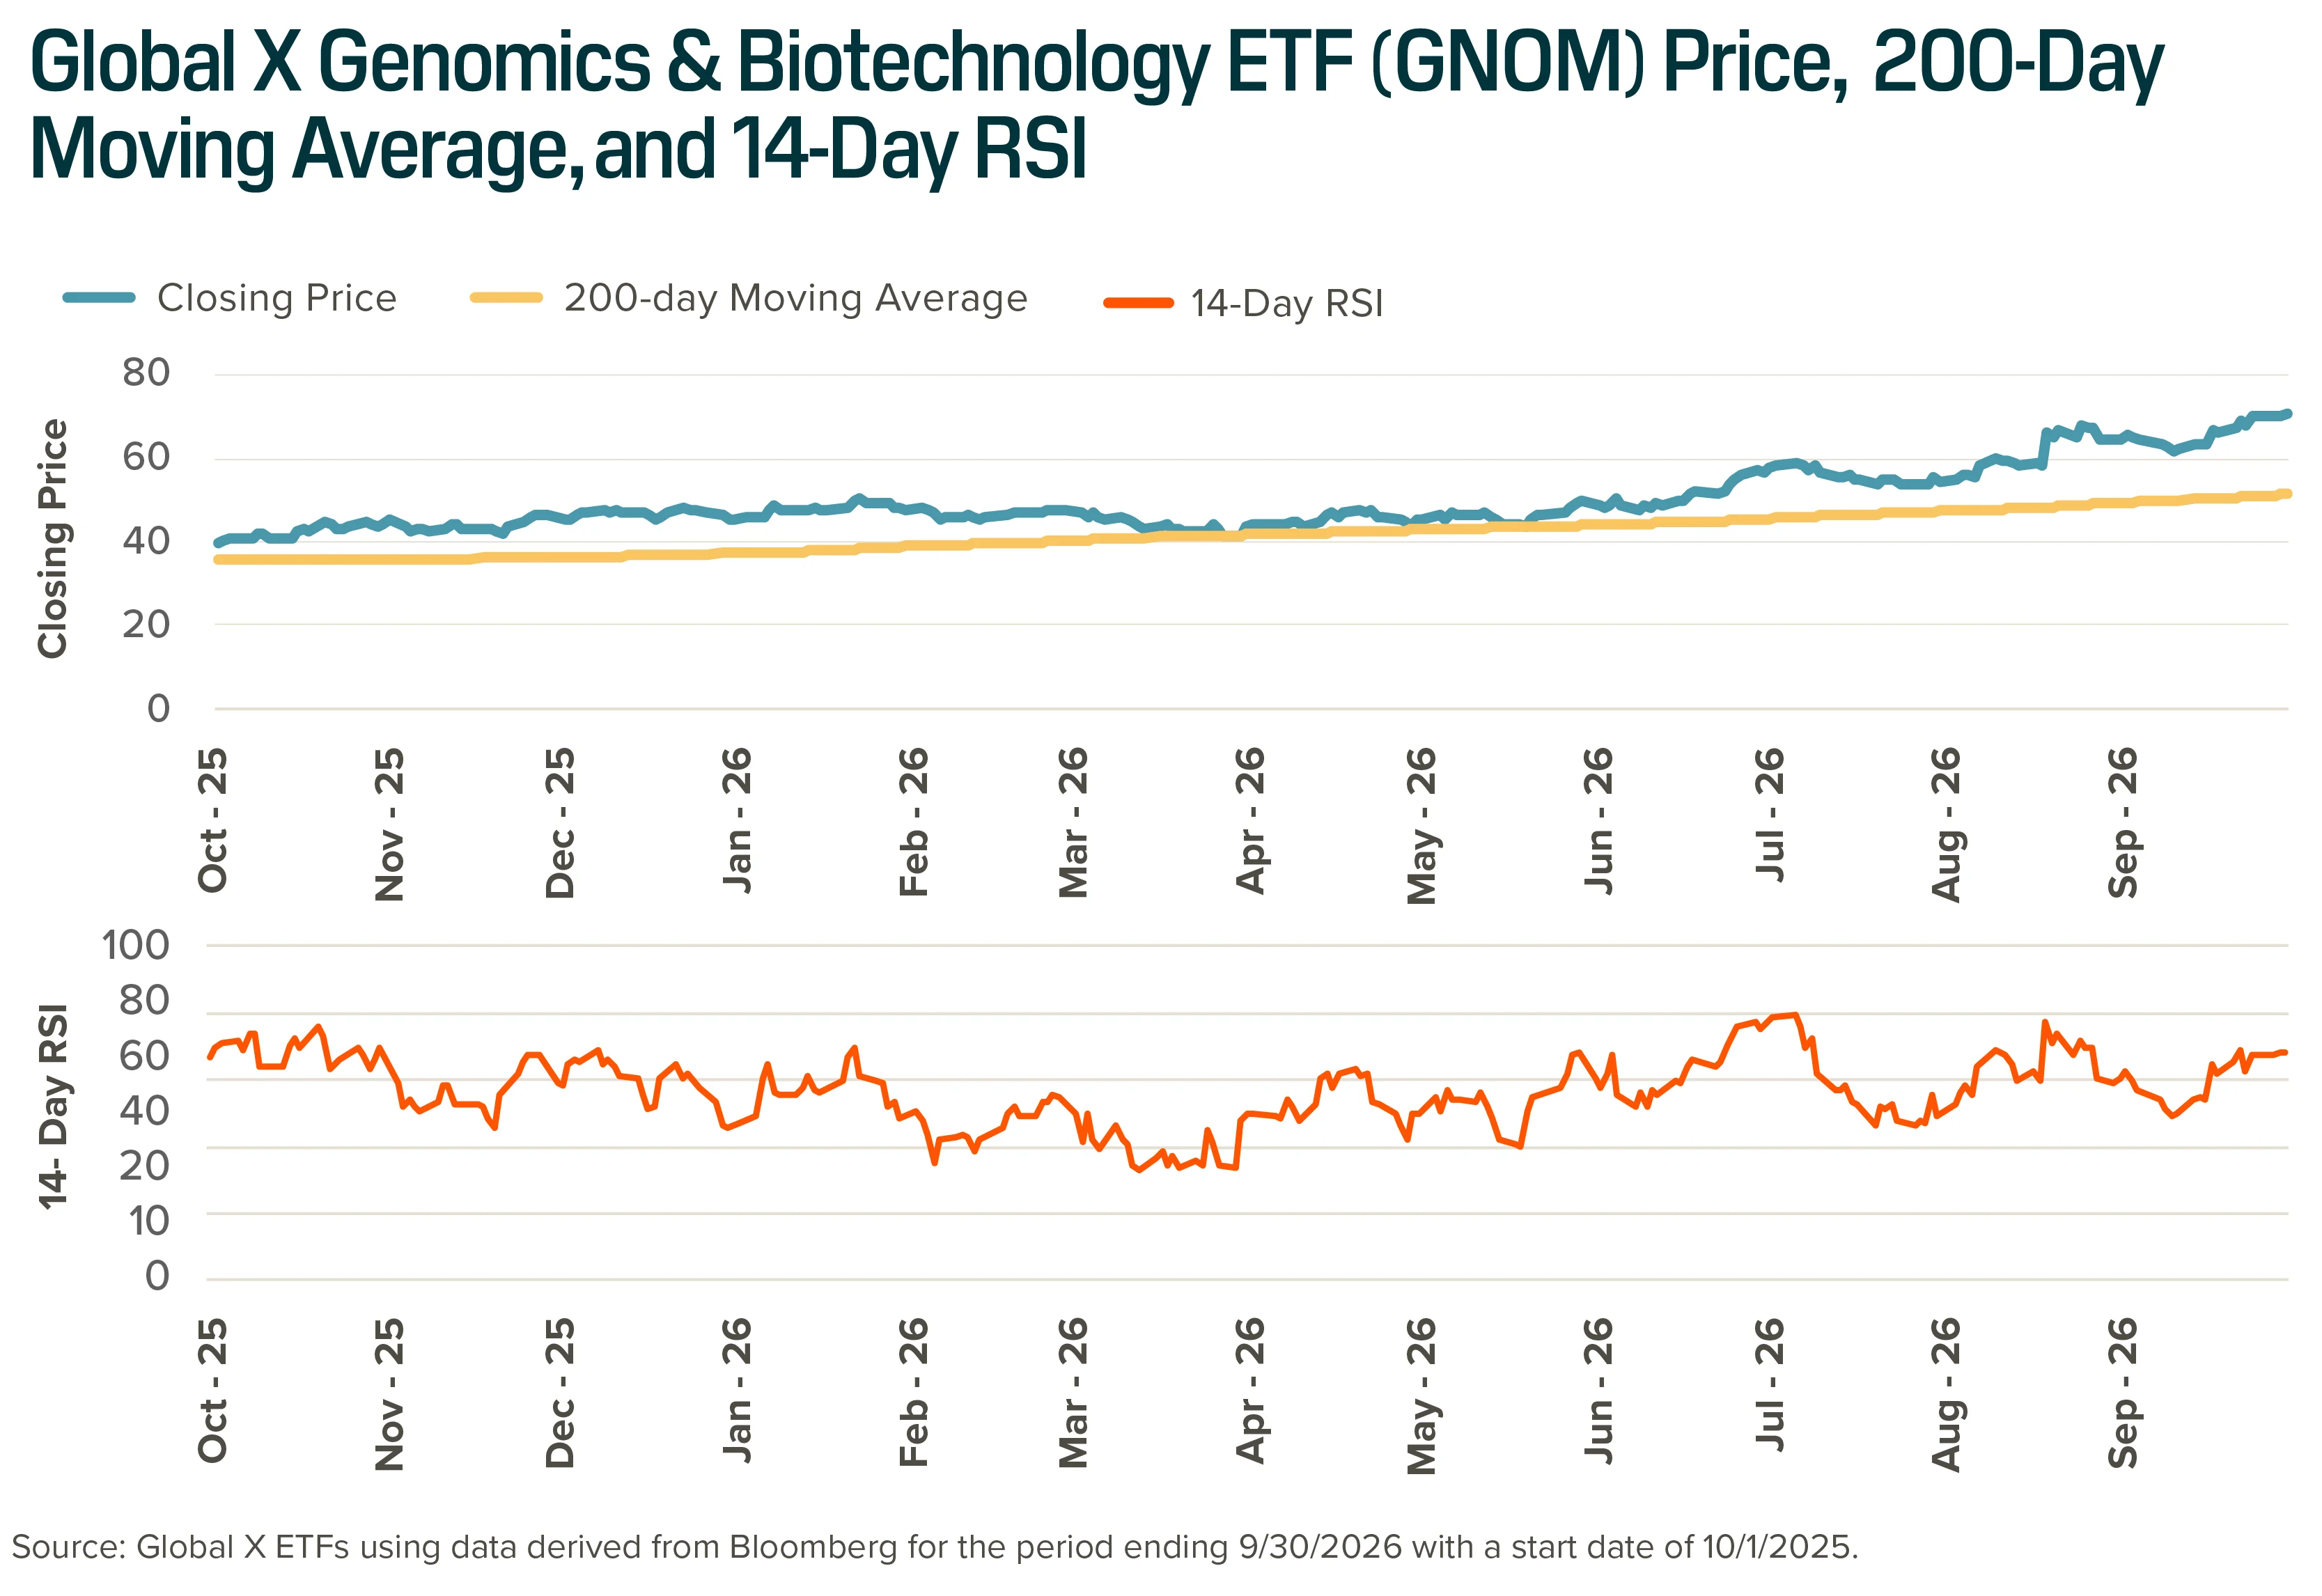
After troughing towards the end of April, the fund has recovered, sitting comfortably above its 200 moving day average as of 9/30/2026. The fund is neither overbought nor oversold on a short-term basis (as indicated by the 14-Day RSI through 9/30/2026), and the fund could see trend-following investors drive “buy-the-dip” demand on near-term pullbacks should the underlying fundamentals hold.

Overall, the genomics and biotechnology theme has benefited from a combination of positive price trends and strong growth catalysts

Price was above intermediate support (200-Day Moving Average); the RSI suggests the fund is neither overbought nor oversold as of 9/30/2026.

Genomics and energy producers appear to be recovering from long-term underperformance (Long-Term Reversal) based on recent positive Momentum.

Natural Gas Energy Producers (LNGX) remains out of favor as the natural gas market has lagged the recent advances seen across other conventional energy sources, such as oil and coal. However, as mentioned above, themes tied to conventional energy, whether upstream production or mid-stream distribution/delivery, are trending higher and trading at less expensive valuations (Value) than the broader market. We profile the U.S. natural gas theme (LNGX) as this month’s Out-of-Favor Theme in Focus.

The genomics and biotechnology theme (GNOM) has long been out of favor but is starting to see renewed interest as AI advances gene therapy and drug discovery. Earlier, we highlighted GNOM as the Top Trending Theme in Focus.

Alternative energy inputs/processing such as Hydrogen (HYDR), are showing some signs of consolidating as the growth outlook improves (Growth).

Defensive-oriented dividend payers (DIV, QDIV, SRET), free cash flow generators (FLOW), and our multi-factor ETF (AUSF) remained out of favor amid strong “risk-on” appetite and an optimistic earnings-growth outlook. A shift away from pro-cyclical leadership would likely be the catalyst for a turnaround, and low valuations (Value) may offer support for patient investors.

Food-innovation and agricultural tech theme (KROP) remained out of favor as earnings normalized from the post-Russia/Ukraine hypergrowth period and tracked lower grain and soybean prices. We view the theme as attractively valued but in need of a sustained growth catalyst.

The structural bull case for U.S. natural gas producers and liquified natural gas (LNG) companies rests on a convergence of durable, multi-year demand catalysts. U.S. LNG feedgas demand is projected to more than double to 29.7 billion cubic feet/day (bcf/d) between 2024 and 2030, creating an average supply deficit of 0.6 bcf/d over that period.9 Peak LNG export volumes are projected to exceed 25 bcf/d by 2028 as new capacity additions ramp, with data center build-outs expected to cause a 7.7 gigawatt (GW) increase in average power demand in 2026 alone.10 Global LNG demand is forecast to grow at 5.8% per annum from 2025–2030, driven primarily by emerging Asia, with Chinese LNG demand projected to rise 65% during this period.11 Geopolitical disruptions, including damage to Qatari LNG facilities taking approximately 50 million tonnes per year offline, could take years to repair, further accelerating demand for U.S. supply.12

Excess production leading to oversupply and questionable capital allocation decisions have weighed on this theme, helping to explain the long-term underperformance.13

The geopolitical environment has contributed to the disruption of global energy supplies, including LNG as well as surging AI data center power demand are now fueling a recovery in natural gas producers and distributors, reflected in LNGX’s positive Momentum reading.

LNGX’s Growth factor exposure remains negative as earnings growth has stalled (see below) while waiting for the demand environment to turn more favorable for the sector; however, the theme continues to trade at attractive valuations (Value).

The theme is also exhibiting lower volatility (Volatility, 30-Day Idiosyncratic Return), possibly reflecting the steady environment of natural gas pricing and demand.

LNGX has exhibited less volatility (Volatility, 30-Day Idiosyncratic Return) while Value remains attractive but the Growth outlook is likely contingent on demand catalysts to be realized.

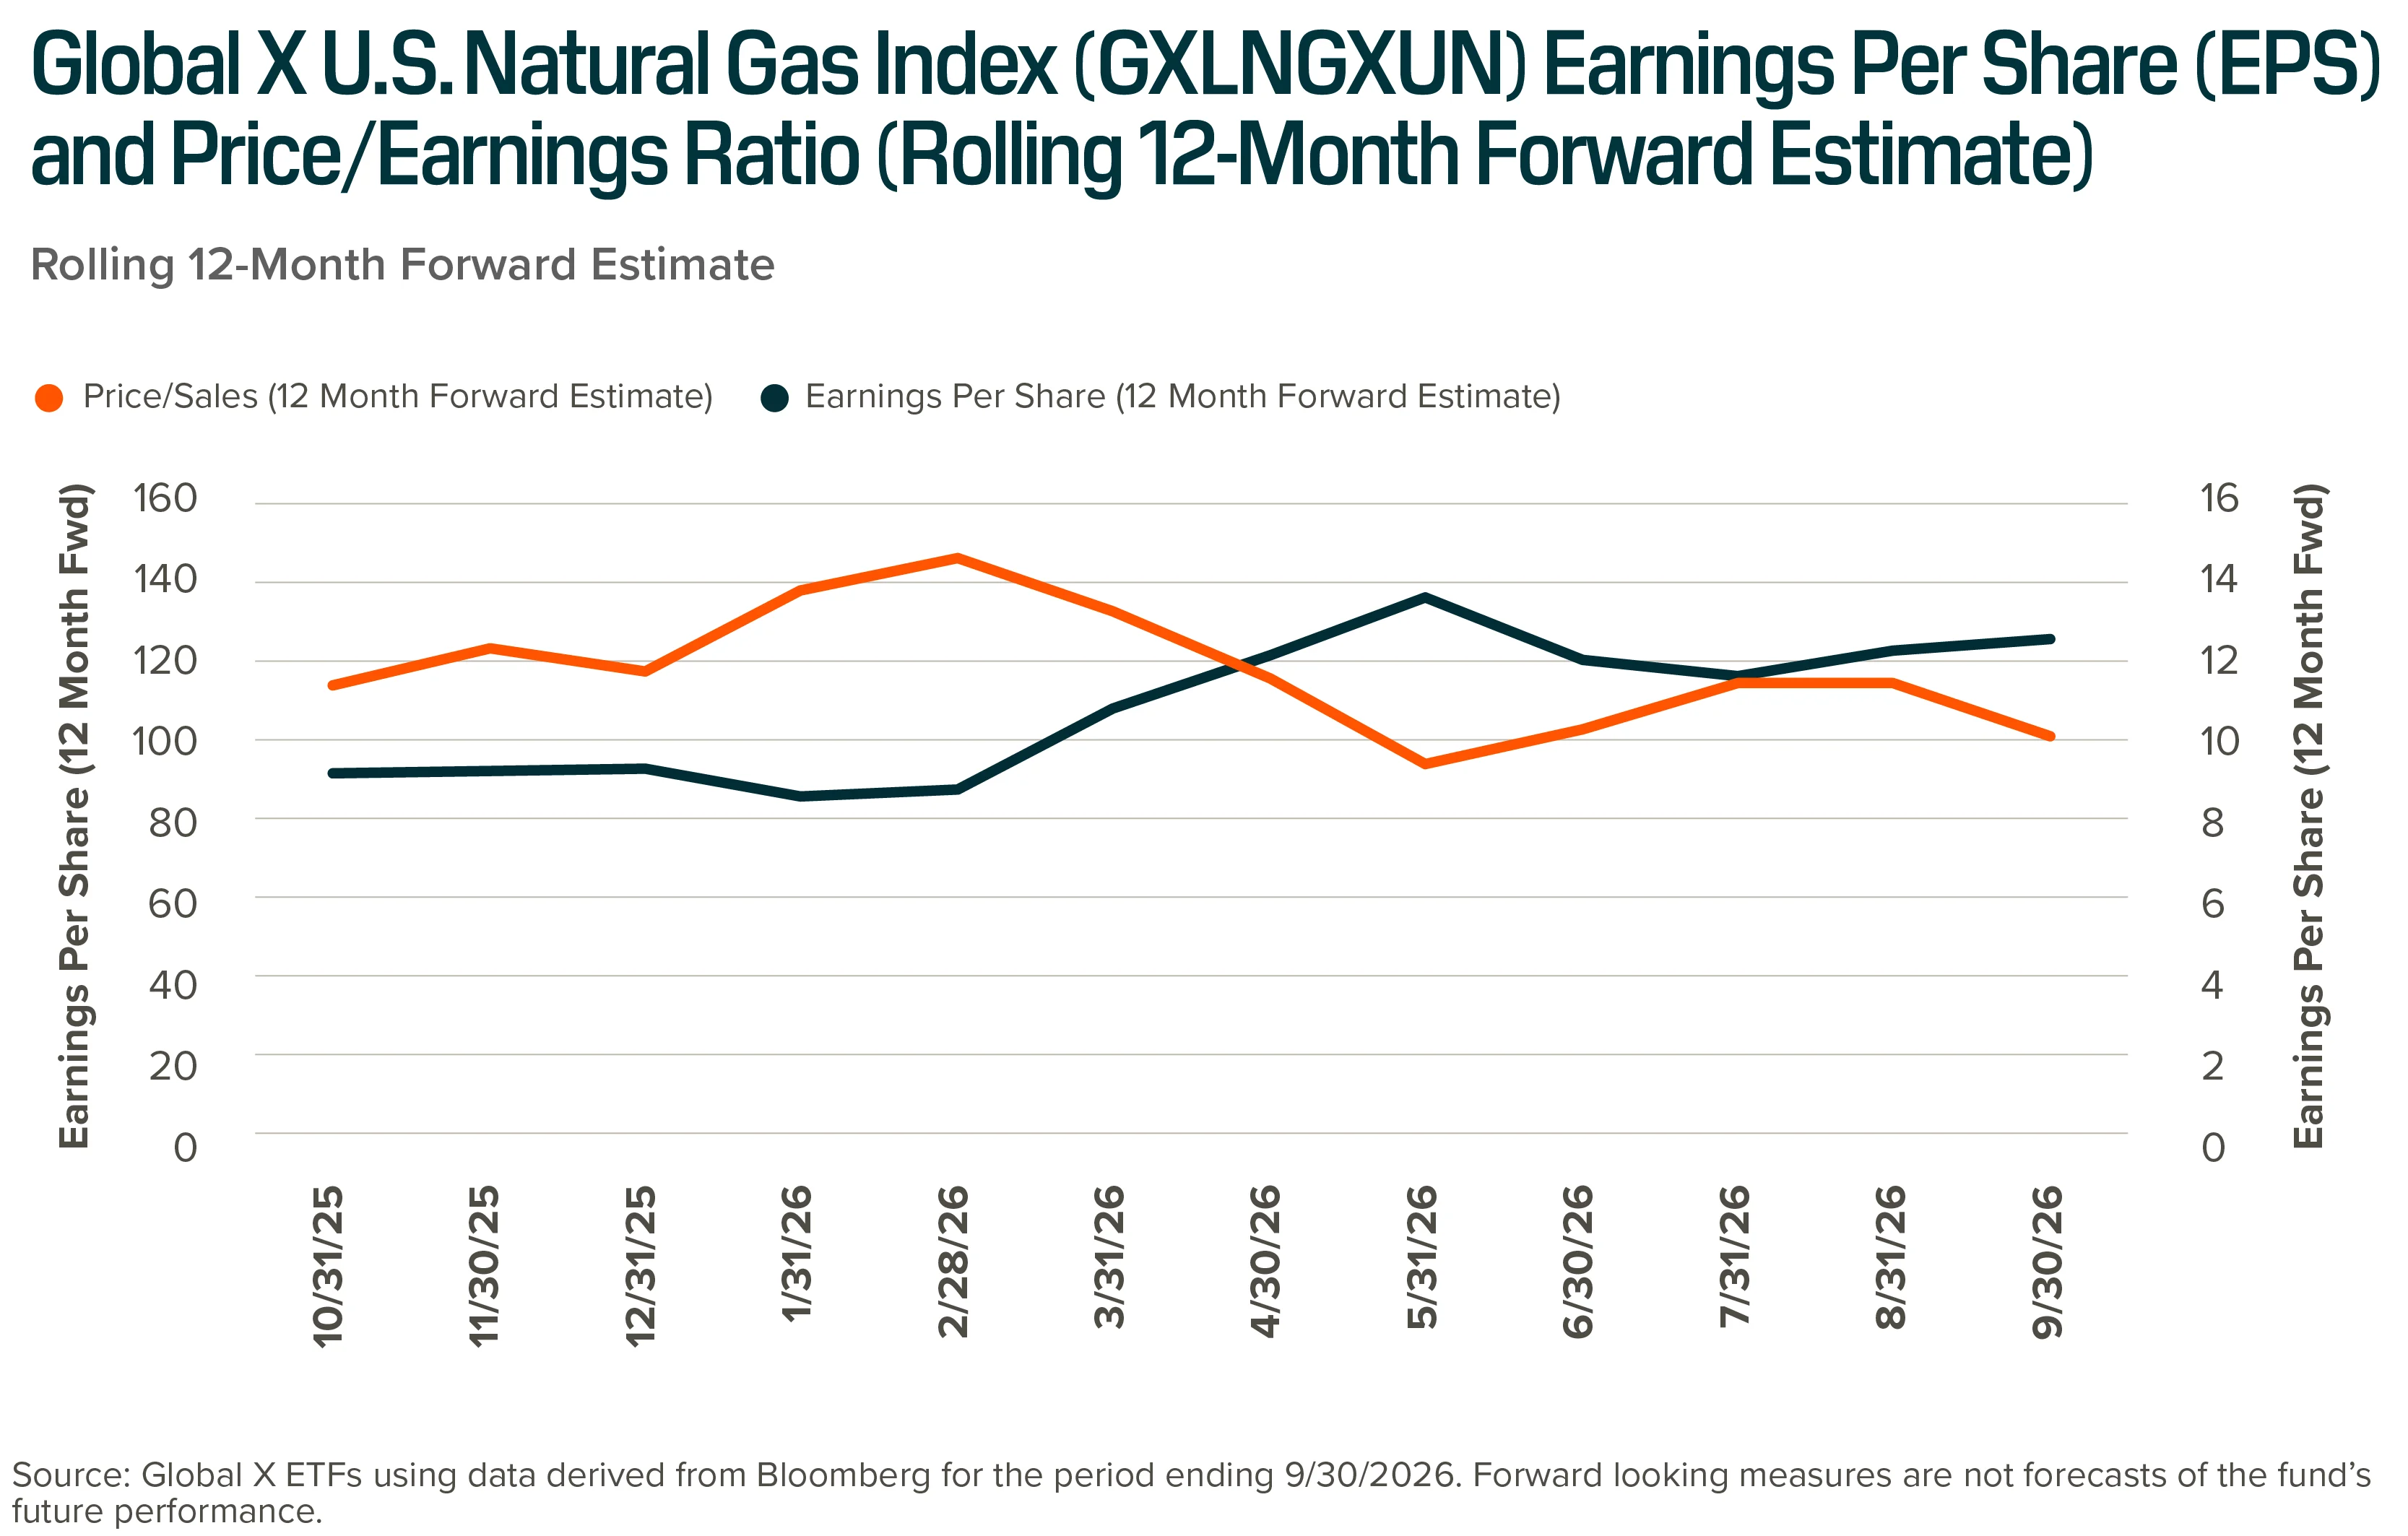
Estimated earnings for the underlying constituents of the Global X U.S. Natural Gas Index (the tracking index for LNGX) have slowly improved since inception of the index, likely helped by the supply constraints from the aftermath of geopolitical conflicts. As of 9/30/26, its forward price/earnings multiple has compressed slightly as projected earnings have risen, possibly indicating investor expectations of a normalized path of earnings following the spike in energy prices in response to the Strait of Hormuz conflict.

Forward EPS for the Solactive U.S. Natural Gas Index has improved following the Strait of Hormuz conflict, while the Price/Earnings ratio has declined, improving the valuation profile.

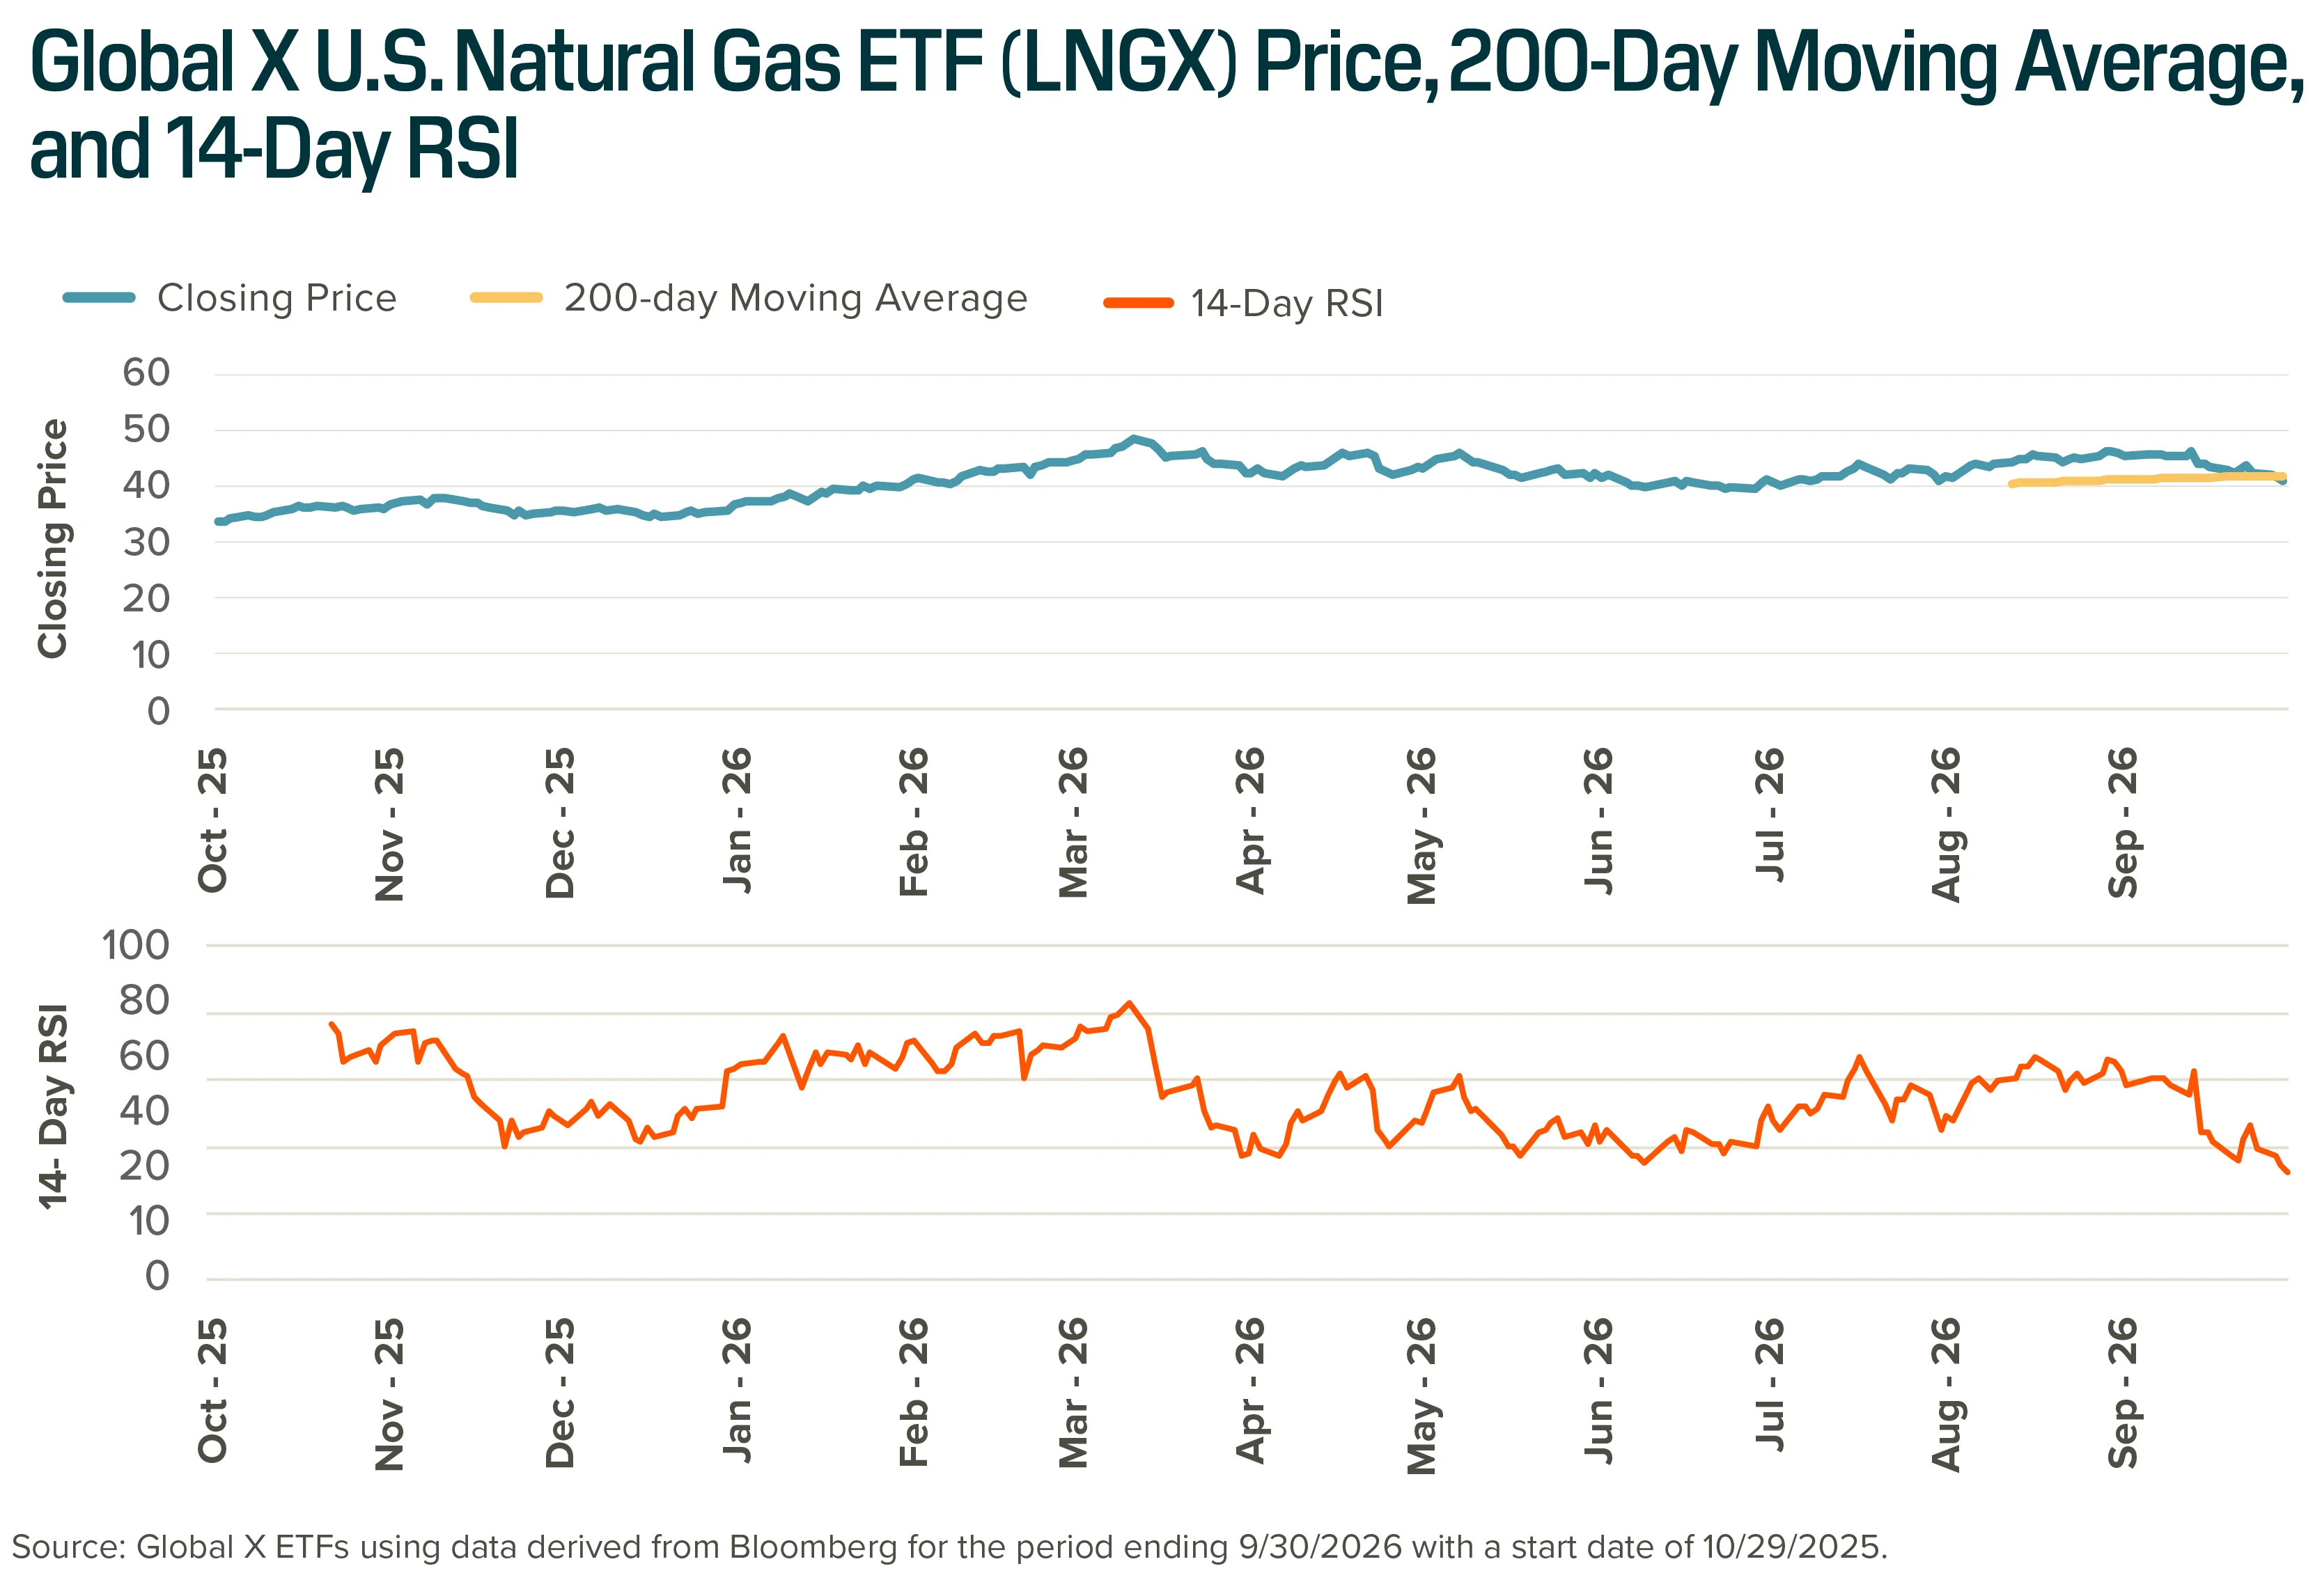
After rallying sharply through the height of the Strat of Hormuz conflict (around the end of March), LNGX has traded in a tight range, having just broken its 200 moving day average (as of 9/30/2026). The recent selling pressures (as indicated by the 14-Day RSI through 9/30/2026) appear to be overextended as natural gas prices have pulled back from their recent highs.

The natural gas theme is enjoying improving sentiment although the growth outlook appears to in a holding pattern until demand catalysts start to materialize. LNGX potentially offers high operating leverage to greater demand posed by energy-hungry data centers and from energy importing countries across Asia and Europe.

LNGX’s price has mostly trended higher but just recently dropped below its 200-day moving average. The RSI points to oversold conditions.

For themes with positive price trends, consider AI-adjacent themes (CHPX), commodity producers (AUAU, COPX, GOEX, GXPE, MLPA, MLPX, and SIL), and genomics (GNOM). Keep in mind, precious metal miners and/or explorers (such as AUAU, GOEX, SIL) could remain pressured by inflation and interest rate uncertainty but could see better entry points if rates decline. We highlighted GNOM as a Top Trending Theme following July’s tech sell-off.

For out-of-favor themes showing recent recovery, consider conventional and alternative energy (GXPE, HYDR, LNGX) and life sciences (GNOM). Defensive, dividend- and cashflow-focused themes (AUSF, DIV, QDIV, FLOW, SRET) and food innovation/ agriculture tech (KROP) remained out of favor but could turn if market sentiment shifts defensive. We highlighted LNGX as a Top Out-of-Favor Theme given its improving sentiment and attractive valuations.

Related articles

1of3
Thought LeadershipThematic GrowthEquity

Through the Systematic Lens: Thematic Equity: Factor Landscape (August 2026)

B

Benjamin Lavine

Aug 25, 202611 min read
Product ResearchCommoditiesEnergy Infrastructure

Energy Playbook: Navigating the Global Supercycle

Product ResearchCommoditiesEnergy Infrastructure

Energy & MLP Insights: Market Implications of a Third Gulf War

Thought LeadershipThematic GrowthEquity

Through the Systematic Lens: Thematic Equity: Factor Landscape (August 2026)

Related funds
Commodities
AUAUGold Miners ETF
Core
AUSFAdaptive U.S. Factor ETF
Thematic
CHPXAI Semiconductor & Quantum ETF
Explore All ETFs
Footnotes
  1. “Global Equity Monthly, September 2026,” Jennie Li and Izabella Wieckowska, Bloomberg Intelligence, 10/5/2026.

  2. “FDA Clears Way for Faster Personalized Gene Editing Therapy,” Gerry Smith, Bloomberg News, 10/31/2025.

  3. “Gene Editing 2026 Outlook,” Bloomberg Intelligence, 5/7/2026.

  4. “Manhattan Venture Research – AI Drug Discovery Has Crossed the Rubicon,” 8/20/2026.

  5. “Ageing and Health,” World Health Organization, 10/1/2025

  6. “In Vivo CAR-T Therapy: The Next Frontier in Cell Therapy Explained,” Life Science Daily News, 8/12/2026

  7. “Moderna and Merck Revive mRNA Hopes with Melanoma Success,” Bloomberg News, 8/19/2026

  8. 10X Genomics Q4 & FY2025 Earnings Call Prepared Remarks, 2/12/2026

  9. "Fundamentals Set to Power Henry Hub Gas After the Iran War", Bloomberg Intelligence, 9/4/2026

  10. “Commodities in 2026: 10 Numbers to Watch from Power to Oil,” BloombergNEF, 12/17/2025

  11. “Global LNG supply set to jump in 2026, limiting prices and spurring demand,” Reuters, 1/21/2026

  12. “QatarEnergy expects 3-5 years to repair LNG facilities after strikes,” S&P Global, 3/19/2026

  13. “Natural Gas Outlook: Producers Face A Familiar Disconnect In 2026,” Forbes, 1/29/2026

Glossary
  • Beta (Factor): A measure of the volatility of a security measured as its sensitivity to the broader market. By definition, the equity market has a beta of 1.0. The higher the beta, the riskier the security is considered to be.
  • Billion Cubic Feet Per Day (Bcf/d): standard unit for measuring natural gas flow rates, whether that's production, consumption, pipeline throughput, or LNG export volumes.
  • Bloomberg MAC3 Global Equity Risk Model (Bloomberg MAC3): Bloomberg’s third-generation multi-asset class equity risk model suite covering 14 global and local equity markets. The model provides a full term structure of risk calibrated across six horizons (daily, weekly, monthly, quarterly, annual, and long-term). All horizons share a common factor exposure matrix, with horizon-specific factor covariance matrices and specific risk forecasts. The inception date of the factor calculations used in the Bloomberg MAC3 model is 12/31/1998. Factor exposures measure how strongly a stock or portfolio is tilted toward or away from a specific characteristic, such as value, momentum, or size, based on Bloomberg’s MAC3. Factors are calculated using the following methodology: 1) rank all stocks in each sector from highest to lowest, 2) divide stocks in each sector on a given rebalance date into five quintiles, 3) take all the top quintile stocks across sectors and calculate the average return. The same is done for all bottom quintile stocks across sectors; 4) take the difference of the average returns. This is referred to as Long/Short Sector Neutral.
  • Bloomberg U.S. Equity Universe (Risk Model): The U.S. equity universe used within the MAC3 Global Equity Risk Model, consists of U.S.-domiciled/listed equity securities with sufficient data approximating 6,000 securities.
  • Dividend Yield (Factor): A style factor in the Bloomberg MAC3 model reflecting the dividend yield of a security relative to its peers. Dividend yield is also sometimes regarded as a value signal.
  • Earnings Yield (Factor): A style factor typically associated with “value” investing, measuring the ratio of earnings to price. Securities with higher earnings yields are considered more attractively valued.
  • Estimate Revisions (Factor): A sentiment factor measuring the direction and magnitude of sell-side analyst revisions to forward earnings estimates. Positive revisions indicate improving earnings expectations and are typically associated with near-term price momentum.
  • Global X U.S. Natural Gas Index: tracks the performance of U.S. listed and domiciled companies involved in the Natural Gas and Natural Gas Liquids (NGL) upstream and midstream business activities.
  • Growth (Factor): A fundamental style factor measuring the rate of growth of a company’s earnings, sales, or cash flows relative to peers.
  • 30D Idiosync Ret (Factor): The sum of idiosyncratic (or residual) return over the past 30 days standardized within local markets and sourced directly from the Bloomberg MAC3 Global Risk Model.
  • Leverage (Factor): A composite of financial statement leverage and market leverage standardized within local markets and sourced directly from the Bloomberg MAC3 Global Risk Model. . The factor is typically included within the Quality composite.
  • Liquidity (Factor): A style factor measuring the ease with which a security can be traded.
  • Long-Term Reversal (Factor): A style factor measuring the exponential time-weighted average of log returns over a trailing 48-month period with the most recent 12 months excluded (to remove the effect of momentum). A negative value indicates the security is trading with negative long-term momentum, suggesting potential mean reversion from prolonged underperformance. Bloomberg calculates a value for a fund based on the fund’s holdings as of a specific date, using data for the individual securities. It does not reflect the actual return of the fund, which may have varied. Fund holdings have varied over time, which would affect results. A fund itself may not have history for the entire 48 months.
  • Low Volatility (Factor): A composite factor constructed consisting of Beta and Residual Volatility factors standardized within local markets. The pure factor portfolio is long low volatility stocks and short high volatility stocks.
  • Momentum (Factor): A style factor measuring the exponential time-weighted average of log returns over a trailing 12-month period with the most recent month excluded (to remove the effect of short-term reversal). Bloomberg applies a proprietary time-weighting scheme to account for negative returns associated with short-term reversals. Bloomberg calculates a value for a fund based on the fund’s holdings as of a specific date, using data for the individual securities. It does not reflect the actual return of the fund, which may have varied. Fund holdings have varied over time, which would affect results. A fund itself may not have history for the entire 12 months.
  • Moving Average: calculates the average closing price of a security over a defined lookback period, say 50 days or 200 days, and updates that average each day as new price data comes in. The result is a smoothed line plotted on a price chart that filters out day-to-day volatility and can make the prevailing trend easier to see.
  • Pure Factor Portfolio: A hypothetical portfolio constructed via cross-sectional regression that is dollar-neutral, carries unit exposure to the target style factor, and has zero exposure to all other risk factors. Pure factor portfolios are used to measure the isolated return contribution of each factor and to validate risk model accuracy.
  • Quality (Factor): A composite style factor reflecting the financial health and earnings quality of a company, typically encompassing profitability (Profit factor), balance sheet strength (inverse of Leverage), and earnings stability (inverse of Variability). Securities with higher quality characteristics have historically earned a risk premium in most markets under the Bloomberg MAC3 model.
  • Relative Strength Index (RSI): A momentum oscillator measuring the speed and magnitude of a security’s recent price changes on a scale of 0 to 100. Readings above 70 are generally considered overbought (potential price reversal); readings below 40 are generally considered oversold. The 14-Day RSI is the standard lookback period.
  • Residual Volatility (Factor): A style factor in the Bloomberg MAC3 model where the pure factor portfolio is long high-volatility stocks and short low-volatility stocks. Residual volatility captures the idiosyncratic volatility of a security after removing common factor exposures and is distinct from the overall Volatility or Beta factors.
  • S&P 500 Momentum Index: is based on risk-adjusted price performance over both 6-month and 12-month horizons. The S&P 500 Momentum is designed to measure the performance of securities in the S&P 500 universe that exhibit persistence in their relative performance.
  • Size (Factor): A style factor where the pure factor portfolio is long large-cap stocks and short small-cap stocks.
  • Solactive Genomics Index: tracks the performance of companies that have or are expected to have significant exposure to the field of Genomics by using a natural language processing (NLP) algorithm that evaluates publicly available information. Genomics Activities include but are not limited to: Gene editing, Genomic sequencing, Development and testing of genetic medicine/therapies, and Computational genomics and genetic diagnostics.
  • Valuation (Factor): A fundamental style factor described by a combination of three price ratios: book-to-price, sales-to-price, and cash-flow-to-price. Securities with higher valuation factor scores are considered cheaper relative to fundamental measures. Note that the Bloomberg MAC3 “Value” factor is distinct from the broader “Earnings Yield” factor, which focuses specifically on earnings-to-price ratio.
  • Value (Factor): A composite of the Valuation and Earnings Yield factors standardized within local markets. Larger scores indicate higher value.
  • Variability (Factor): A style factor often viewed as a negative indicator of investment quality, capturing the variability or inconsistency of a company’s earnings and financial results.
  • Volatility (Factor): In the context of the Bloomberg TLTS factor profile, Volatility reflects the overall price variability of a security or fund relative to its peers, encompassing both systematic (beta-related) and idiosyncratic sources of risk. A high Volatility factor score indicates the fund’s constituents exhibit above-average price fluctuations.

This month highlights semiconductors/quantum computing as one of the top trending themes and hydrogen as an out-of-favor-theme showing possible recovery.

This month highlights semiconductors/quantum computing as one of the top trending themes and hydrogen as an out-of-favor-theme showing possible recovery.

Electrification, energy infrastructure, alternative power, and critical materials are converging into what we believe is a multi-decade supercycle.

M

Multiple authors

Jul 10, 202620 min read

The War in Iran could impair energy output and thus reshape supply chains. It also highlights the growing importance of North American energy infrastructure.

G

Global X Research

Apr 1, 202612 min read
B

Benjamin Lavine

Aug 25, 202611 min read
Product ResearchCommoditiesEnergy Infrastructure

Energy Playbook: Navigating the Global Supercycle

Electrification, energy infrastructure, alternative power, and critical materials are converging into what we believe is a multi-decade supercycle.

M

Multiple authors

Jul 10, 202620 min read
Product ResearchCommoditiesEnergy Infrastructure

Energy & MLP Insights: Market Implications of a Third Gulf War

The War in Iran could impair energy output and thus reshape supply chains. It also highlights the growing importance of North American energy infrastructure.

G

Global X Research

Apr 1, 202612 min read